Open Access
Technical Note
Development and application of a microarray meter tool to
optimize microarray experiments
Richard JD Rouse
1,2, Katrine Field
1, Jennifer Lapira
1, Allen Lee
1, Ivan Wick
1,
Colleen Eckhardt
1, C Ramana Bhasker
3, Laura Soverchia
1,4and
Gary Hardiman*
1,5Address: 1Biomedical Genomics Microarray Facility (BIOGEM), La Jolla CA 92093, USA, 2HTS Resources, LLC, 11175-A Flintkote Avenue, San Diego, CA 92121, USA, 3Center for Molecular Genetics, Department of Pediatrics, School of Medicine, University of California, San Diego, La Jolla, CA 92093-0634, USA, 4Department of Experimental Medicine and Public Health, University of Camerino, 62032 Camerino (MC), Italy and 5Department of Medicine, University of California San Diego, La Jolla, CA 92093-0724, USA
Email: Richard JD Rouse - [email protected]; Katrine Field - [email protected];
Jennifer Lapira - [email protected]; Allen Lee - [email protected]; Ivan Wick - [email protected];
Colleen Eckhardt - [email protected]; C Ramana Bhasker - [email protected]; Laura Soverchia - [email protected]; Gary Hardiman* - [email protected]
* Corresponding author
Abstract
Background: Successful microarray experimentation requires a complex interplay between the slide chemistry, the printing pins, the nucleic acid probes and targets, and the hybridization milieu. Optimization of these parameters and a careful evaluation of emerging slide chemistries are a prerequisite to any large scale array fabrication effort. We have developed a 'microarray meter' tool which assesses the inherent variations associated with microarray measurement prior to embarking on large scale projects.
Findings: The microarray meter consists of nucleic acid targets (reference and dynamic range control) and probe components. Different plate designs containing identical probe material were formulated to accommodate different robotic and pin designs. We examined the variability in probe quality and quantity (as judged by the amount of DNA printed and remaining post-hybridization) using three robots equipped with capillary printing pins.
Discussion: The generation of microarray data with minimal variation requires consistent quality control of the (DNA microarray) manufacturing and experimental processes. Spot reproducibility is a measure primarily of the variations associated with printing. The microarray meter assesses array quality by measuring the DNA content for every feature. It provides a post-hybridization analysis of array quality by scoring probe performance using three metrics, a) a measure of variability in the signal intensities, b) a measure of the signal dynamic range and c) a measure of variability of the spot morphologies.
Background
Microarray production efforts require manipulations such
as probe desiccation and reconstitution in print buffers, which become increasingly cumbersome with extended
Published: 11 July 2008
BMC Research Notes 2008, 1:45 doi:10.1186/1756-0500-1-45
Received: 22 February 2008 Accepted: 11 July 2008
This article is available from: http://www.biomedcentral.com/1756-0500/1/45 © 2008 Rouse et al; licensee BioMed Central Ltd.
library sets. Once a particular print buffer composition has been selected, and the probe library is reconstituted in this solution, switching to an alternate buffer may require further cDNA amplifications or oligonucleotide syntheses to generate additional probes. It is undesirable to waste probe material evaluating immobilization chemistries yet optimization experiments are almost always required [1-4]. As novel slide and print chemistries emerge, in addi-tion to advances in robotic dispensing systems, a thor-ough evaluation of the best combination of reagents and hardware should be considered before committing the probe collection to the spotting process. This is best achieved through the use of a microarray control set.
A robust microarray control set should a) be easy to implement, b) be applicable to a wide variety of spotting robots, capillary pins and slide chemistries and provide a quality metric for all aspects of a microarray study includ-ing array fabrication, c) provide strong signal intensity to every probe on the array thereby facilitating accurate spot-finding, d) be reproducible, facilitating comparison of datasets from different users and laboratories, and e) measure signal intensity over a dynamic range [5].
Researchers typically prepare their own control sets. One example is the AFGC Microarray Control Set [6]. Com-mercial control sets have also been developed including, The Lucidea Microarray Score Card (Amersham Bio-sciences) and the SpotReport (Stratagene Inc., La Jolla, CA). These control sets have limited utility for evaluating the parameters in array fabrication, where uniform signal intensity across a given probe concentration is required.
In the present approach we describe a 'microarray meter' which addresses the issues (a-e) outlined above. The probes are engineered with a universal sequence and printed across a defined concentration range, which pro-vides a measure of the amount of DNA required with spe-cific slide chemistries. Two fluorescent labeled targets are hybridized concurrently, a homogenous universal refer-ence labeled with Cy3 and a pool of Cy5 labeled B. subtilis mRNAs, which serve as a control to measure signal inten-sity across a dynamic range. The reference allows assess-ment of spot detection and feature quality control, whereas the bacterial sequences monitor experimental dynamic range. In this study we applied the microarray meter tool to monitor the efficiency of array fabrication for three commercial microarray spotting robots paired with different capillary pin combinations. The microarray meter tool also permitted an evaluation of different slide and hybridization chemistries, further optimizing experi-mental conditions prior to the fabrication of high density arrays.
Development of the microarray meter targets and probes
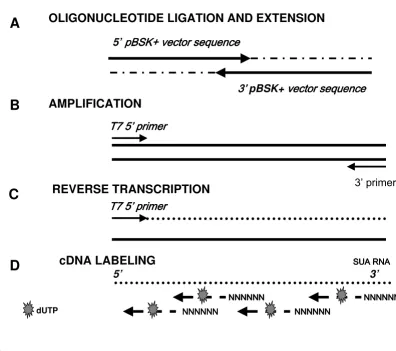
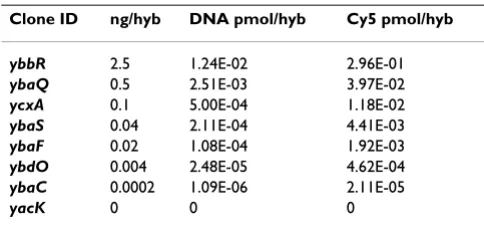
The microarray meter consists of nucleic acid targets (ref-erence and dynamic range control) and probe compo-nents. The first target component is a homogenous Synthetic Universal Amplicon (SUA) reference target, cre-ated as outlined in Figure 1. The second component com-prises a series of dynamic range controls whose sequences are derived from Bacillus subtilis. These bacterial sequences were transcribed in vitro and each individually labeled with Cy5 (Table 1). After labeling, each of the dynamic range control sequences were individually pooled at defined concentrations (Table 2). The Cy5 dynamic range control and Cy3 SUA targets were co-hybridized to all arrays.
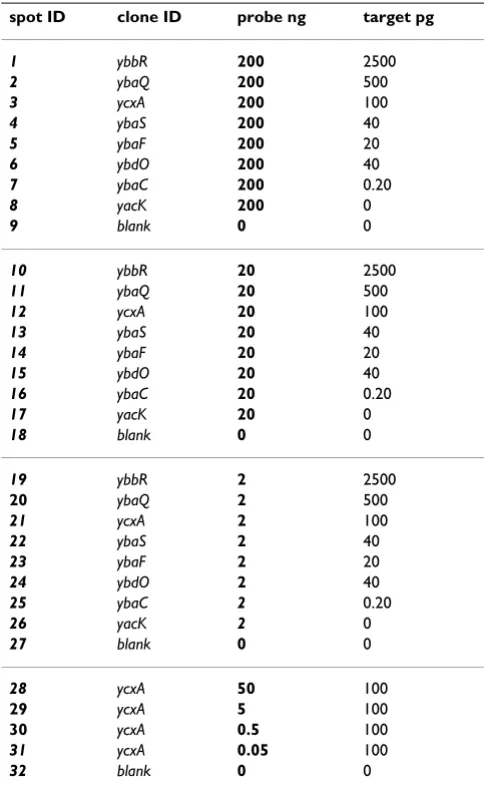
Additionally there are a series of probe components in the microarray meter design corresponding to B. subtilis RNA used here as dynamic range controls. The relationship between each printed probe and the corresponding hybridized target is outlined in Table 3. A dilution series was included to test the optimal spotting concentration of the probes, and identify instrument to instrument varia-tion in this regard.
More detail on the microarray meter components is pro-vided in Additional file 1.
Microarray meter analysis of DNA probe variability, signal dynamic range and feature morphology
We examined the variability in probe quality and quantity (as judged by the amount of DNA printed and remaining post-hybridization) on reflective amino silane slides (Amersham Biosciences) using three robots, The Molecu-lar Dynamics GenIII spotter equipped with GenIII capil-lary printing pins (Amersham Biosciences, Piscataway, NJ), The QArrayMini (Genetix, Boston, MA) equipped with Telechem ChipMaker™ Pins (Sunnyvale, CA) and The BioRobotics MicroGrid II Robot equipped with MicroSpot 10 K pins (Genomic Solutions, Ann Arbor, MI). Signal intensity following hybridization with the SUA target served as a measure of the amount of DNA deposited. As the hybridization, washing and scanning conditions were identical across all three slide types and as this analysis was carried out post-hybridization, an assessment of the quality of cDNA array fabrication, judged via probe performance, was possible.
4.8%), followed by the BioRobotics MicroGrid II/MicroS-pot 10 K pins (mean, 7.1%) and the QArrayMini/Chip-Maker pins (mean, 11.8%). With decreasing probe concentrations the CV values increased, reflecting greater inconsistency in pin performance at the lower concentra-tions. At 20 ng/μl CV values were again lowest for the Molecular Dynamics GenIII spotter/GenIII pins (mean, 9.8%), followed by the QArrayMini/ChipMaker pins (mean, 13.8%) and the BioRobotics MicroGrid II/MicroS-pot 10 K pins (mean, 20.7%). At the lowest probe concen-trations, 2 ng/μl, lowest CVs were observed for the QArrayMini/ChipMaker (mean, 14.5%), followed by the Molecular Dynamics GenIII spotter/GenIII pins (mean, 24.1%) and the BioRobotics MicroGrid II/MicroSpot 10 K pins (mean, 28.4%).
[image:3.612.89.486.99.450.2]As an additional measure of cDNA array performance we compared signal dynamic range for microarrays fabricated using the three robots. The dilution series for the dynamic range concentrations were prepared by dilution of stock solutions. The Cy5 labeled controls were added per hybridization in defined molar quantities as listed in Table 2. This mirrored the various transcript abundances found within a cell, a feature commonly encountered in a microarray experiment. The resultant Cy5 signal intensi-ties for the microarray meter probes were determined for the different probe concentrations and plotted versus the abundance of a particular dynamic range control (expressed as an arbitrary copy number) in the hybridiza-tion reachybridiza-tion (Figure 2B).
This data set revealed a similar performance between the QArrayMini/ChipMaker and the BioRobotics MicroGrid Schematic of Synthetic Universal Amplicon (SUA) construction
Figure 1
Schematic of Synthetic Universal Amplicon (SUA) construction. (a) An extension reaction using two oligonucle-otides was used to generate a double stranded DNA product. (b) This product served as template for PCR amplification to attach a T7 RNA promoter sequence. (c) The 127 bp SUA was transcribed in vitro to RNA. (d) The RNA product was subse-quently reverse transcribed into a fluorescent single stranded cDNA target.
OLIGONUCLEOTIDE LIGATION AND EXTENSION
5’
S%6.
S%6.
S%6.
S%6.YHFWRUVHTXHQFH
YHFWRUVHTXHQFH
YHFWRUVHTXHQFH
YHFWRUVHTXHQFH
ಫ
ಫ
ಫ
ಫ
pBSK+YHFWRUVHTXHQFH
YHFWRUVHTXHQFH
YHFWRUVHTXHQFH
YHFWRUVHTXHQFH
AMPLIFICATION
7ಫSULPHU
7ಫSULPHU
7ಫSULPHU
7ಫSULPHU
ಫSULPHU
REVERSE TRANSCRIPTION
7ಫSULPHU
7ಫSULPHU
7ಫSULPHU
7ಫSULPHU
cDNA LABELING
111111 111111 111111 111111
111111 111111111111 111111
111111 111111111111 111111
111111 111111 111111 111111
A
B
C
D
68$51$68$51$68$51$68$51$5’ 3’
II/MicroSpot 10 K arrays as regards the dynamic range per-formance of the microarrays. When the probes were printed at higher concentrations (200 ng/μl), the data for these robots followed a linear trend, given the nature of the dilution series for the dynamic range controls. The sig-nal intensities for the corresponding probes on the Molec-ular Dynamics GenIII printed arrays were lower, and the dynamic range data followed a non-linear profile. The overall probe performance for this robot was reduced at higher DNA concentrations. Microarrays printed using all three robots using the lowest concentration of probe material (2 ng/μl) performed less efficiently due to reduced and variable signal intensities.
The applicability of the microarray meter to 70-mer oligo-nucleotide arrays was investigated via an analysis of probe performance on reflective amino silane slides using the Molecular Dynamics GenIII spotter/GenIII capillary print-ing pins and the QArrayMini/Telechem ChipMaker™ Pins. Signal intensity following hybridization with the SUA tar-get served once again as a measure of the amount of DNA deposited. The printing format was similar to that for the cDNA-based arrays, with every probe printed with every
pin and with the inclusion of replicate spots. The CV for each of the replicate probes and for each of the 12 pins was calculated and the data is presented in Figure 2C. The corresponding signal dynamic range data is presented in Figure 2D. This revealed comparable probe performance at higher concentrations for both robot and pin combina-tions, and less variability with the Molecular Dynamics GenIII spotter/GenIII capillary printing pins at lowest probe concentrations. Interestingly the dynamic range data followed a linear profile at higher oligonucleotide concentrations for the Molecular Dynamics GenIII combi-nation.
Use of the microarray meter to assess feature morphology
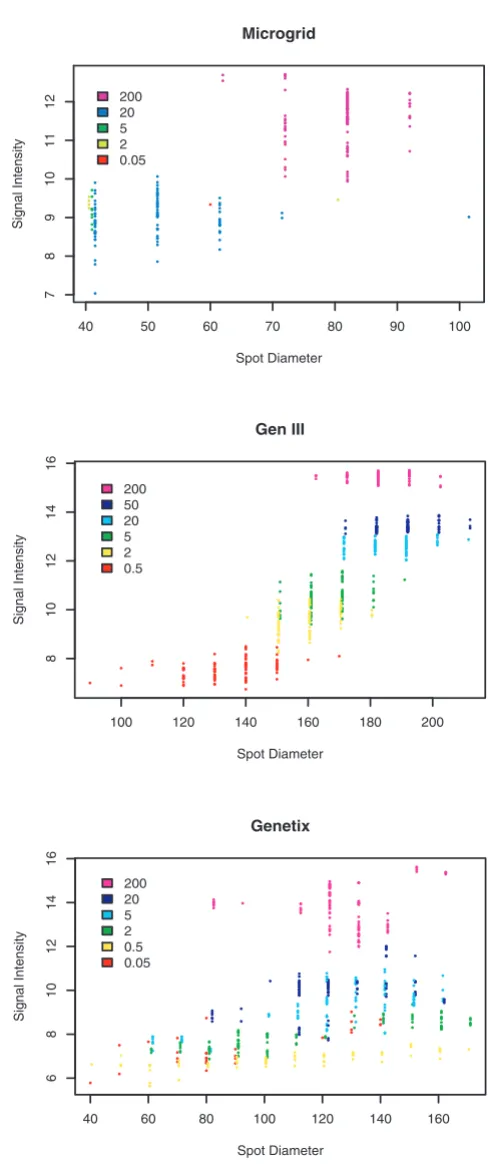
Analysis of the diameter of the ycxA spot following hybrid-ization with the SUA target served as a measure of the effi-ciency of DNA attachment to the slide surface, and its retention following hybridization (see Additional file 1, supplemental figure S6). In order to fully assess feature morphology an analysis of feature signal intensity versus feature diameter was performed and the data is plotted in Figure 3. Probes that performed poorly were flagged and only those that passed feature quality control were plot-ted. Compared to the Molecular Dynamics GenIII spotter/ GenIII pins and the QArrayMini/ChipMaker pins the BioRobotics MicroGrid II/MicroSpot 10 K pins arrays pos-sessed more flagged features. Spot morphologies with the GenIII spotter/GenIII pins performed best as judged by larger feature sizes and better signal intensities even with lower amounts of probe.
Use of the microarray meter to compare different slide chemistries and hybridization buffers
[image:4.612.57.554.101.235.2]The utility of the microarray meter in assessing different print chemistries and hybridization conditions was assessed. The data revealed a similar performance between Amersham reflective Type 7* and Corning Gap II slides as regards the dynamic range performance of the cDNA Table 1: Analysis of the microarray meter targets.
Control OD DNA A260 OD dye A650/
550
DNA ng/ul DNA pmol/ul DYE pmol/ul Cy/DNA U/DNA % labeling
efficiency
ybbR 0.294 0.322 9.692 0.048 1.288 26.76 50.00 53.53
ybaQ 0.221 0.162 7.277 0.037 0.648 17.73 65.25 27.18
ycxA 0.202 0.220 6.664 0.033 0.878 26.36 64.25 41.03
ybaS 0.219 0.223 7.213 0.038 0.891 23.44 69.00 33.97
ybaF 0.270 0.240 8.910 0.048 0.960 20.01 59.25 33.78
ybdO 0.189 0.201 6.223 0.039 0.806 20.92 38.00 55.05
ybaC 0.405 0.396 13.365 0.073 1.584 21.72 57.50 37.78
yacK 0.293 0.293 9.653 0.055 1.170 21.18 50.00 42.36
SUA 0.168 0.023 5.440 0.214 1.120 5.22 8.25 63.27
The OD DNA and OD DYE fields list optical density data derived from the spectrophotometer for each target. Mass concentration (ng/ul), DNA molar concentration (pmol/ul), cyanine dye (DYE) molar concentrations (pmol/ul),
[image:4.612.54.296.587.700.2]Cy/DNA (ratio of the molecular dye and DNA concentration per target), U/DNA (expected amount of labeled uracil per DNA molecule), percentage labeling efficiency (ratio of expected versus measured labeled uridines per DNA molecule) were determined as outlined in the text.
Table 2: Microarray meter dynamic range controls
Clone ID ng/hyb DNA pmol/hyb Cy5 pmol/hyb
ybbR 2.5 1.24E-02 2.96E-01
ybaQ 0.5 2.51E-03 3.97E-02
ycxA 0.1 5.00E-04 1.18E-02
ybaS 0.04 2.11E-04 4.41E-03
ybaF 0.02 1.08E-04 1.92E-03
ybdO 0.004 2.48E-05 4.62E-04
ybaC 0.0002 1.09E-06 2.11E-05
yacK 0 0 0
microarrays (see Additional file 1, supplemental Figure S7). At lower probe concentrations the signal intensities were however significantly higher on the Type 7* surface. Lowest CV values were observed with the Type 7* slides, using DNA probes at a concentration of 200 ng/μl (see Additional file 1, supplemental Figure S8). The microarray meter also determined that an in-house (Type 1) hybridi-zation buffer performed better than a commercial (Type 2) counterpart (see Additional file 1, supplemental Fig-ures S9 and S10).
Conclusion
Systemic technological biases can confound microarray data interpretation and integration [8-10]. Although dif-ferent groups have contributed to improving the overall microarray manufacturing process, the microarray meter described in this report is very useful in characterizing the array quality by measuring the DNA content for every array spot [11-14]. This provides a level of confidence for every signal generated and evaluates the performance of both the manufacturing and experimental processes, simultaneously.
Microarrays printed with all three robots using the lowest concentration of the microarray meter probes performed poorly due to reduced signal intensities. This suggests that probes should fall within an experimentally verifiable dilution range with a particular printing instrument to be meaningful to the final analyses. For instance, the micro-array meter revealed that probes at 20 ng/μl performed optimally when the Molecular Dynamics GenIII instru-ment was used to spot arrays. However, this was not the case with the other robots used. Interestingly, less variabil-ity in spot diameter was observed using the Molecular Dynamics GenIII instrument even at reduced probe con-centrations. The microarray meter has determined that arrays fabricated using this robot coupled with higher DNA concentration performed sub-optimally. Elevated DNA probe concentrations coupled with this robot have a detrimental effect on experimental conditions possibly due to probe saturation. A non-linear profile using the microarray meter was obtained with the 200 ng/μl DNA probe concentration. Consequently empirical determina-tion of the optimal printing condidetermina-tions is recommended for each robot, pin and slide combination.
There are several means of evaluating microarray quality, prior to hybridization including staining with dimeric cyanine dyes, hybridization with a universal primer or tar-get, hybridization with fluorescently labeled random oli-gonucleotides or red reflection scanning [15-18]. Unlike some control sets the microarray meter permits visualiza-tion of all the probes and not just a subset that serve as fiducial or landmark features. It enables a direct compari-son of the different variables associated with array fabrica-tion and experimentafabrica-tion. Furthermore the microarray meter has utility for comparisons of multiple data sets. Many choices exist as regards robotic printers, capillary pins, slide chemistries and hybridization buffers for microarray experimentation. The microarray meter per-mits a direct comparison of these components, guiding the ultimate choice that is most appropriate to the objec-tive of a particular research program.
[image:5.612.54.296.100.496.2]In summary the microarray meter tool has been adapted for use with cDNA and oligonucleotide arrays, permitting Table 3: Microarray meter probes
spot ID clone ID probe ng target pg
1 ybbR 200 2500
2 ybaQ 200 500
3 ycxA 200 100
4 ybaS 200 40
5 ybaF 200 20
6 ybdO 200 40
7 ybaC 200 0.20
8 yacK 200 0
9 blank 0 0
10 ybbR 20 2500
11 ybaQ 20 500
12 ycxA 20 100
13 ybaS 20 40
14 ybaF 20 20
15 ybdO 20 40
16 ybaC 20 0.20
17 yacK 20 0
18 blank 0 0
19 ybbR 2 2500
20 ybaQ 2 500
21 ycxA 2 100
22 ybaS 2 40
23 ybaF 2 20
24 ybdO 2 40
25 ybaC 2 0.20
26 yacK 2 0
27 blank 0 0
28 ycxA 50 100
29 ycxA 5 100
30 ycxA 0.5 100
31 ycxA 0.05 100
32 blank 0 0
The relationship between each printed probe and the corresponding hybridized target is outlined.
Serial dilutions were carried out so that each of the eight probes was diluted from DNA stocks at 200, 20 and 2 ng/l.
One of the probes ycxA was also serially diluted to additional concentrations namely, 5 ng/l, 0.5 ng/l and 0.05 ng/l.
A: Coefficient of variation (CV) in probe signal intensities on cDNA microarrays Figure 2
A: Coefficient of variation (CV) in probe signal intensities on cDNA microarrays. printed with (a) BioRobotics Microgrid II equipped with MicroSpot 10 K pins, (b) QArrayMini equipped with Telechem ChipMaker Pins, and (c) Molecular Dynamics GenIII spotter. The microarray meter probes were printed from stocks at 200, 20 and 2 ng/μl as described in the text with every capillary pin. B: Signal dynamic range analysis (cDNA microarrays). The signal intensities derived from hybridization of Cy5 labeled dynamic range spikes to increasing concentrations of complementary array probes (2, 20 and 200 ng/μl) was determined and plotted against the abundance of a particular sequence (expressed as an arbitrary copy number) in the hybridization reaction. C: Coefficient of variation (CV) in probe signal intensities on oligonucleotide microar-rays printed with (a) Molecular Dynamics GenIII spotter and (b) QArrayMini equipped with Telechem ChipMaker Pins. The microarray meter probes were printed from oligonucleotide stocks at 200, 20 and 2 ng/μl as described in the text with every capillary pin. D: Signal dynamic range analysis (oligonucleotide microarrays). The signal intensities derived from hybridization of Cy5 labeled dynamic range spikes to increasing concentrations of complementary array probes was deter-mined and plotted against the abundance of a particular sequence (expressed as an arbitrary copy number) in the hybridization reaction. For the CV analysis presented in A and C, each robot's 12 pins printed 7 probes at the three different dilutions as 8 replicate spots on a slide. The mean values of the variation observed with each probe across all pins are represented as bars. The error bars denote one standard deviation. Data are plotted on a logarithmic scale in C and D. Each data point represents the mean of 96 measurements, (each of the 12 pins printed 8 replicate spots per probe per slide).
a
SIGNAL MEAN PERCENT CV
0 2 04 06 08 0 1 0 0 200 20 2
ybaC ybaF ybaQ ybaS ybdO ybhR ycxA
PROBE
b
SIGNAL MEAN PERCENT CV
0 2 04 06 08 0 1 0 0 200 20 2
ybaC ybaF ybaQ ybaS ybdO ybhR ycxA
PROBE
c
SIGNAL MEAN PERCENT CV
0 2 04 06 08 0 1 0 0 200 20 2
ybaC ybaF ybaQ ybaS ybdO ybhR ycxA
PROBE
a
SIGNAL MEAN PERCENT CV
0 20 40 60 80 100 200 20 2
ybaC ybaF ybaQ ybaS ybdO ybhR ycxA
PROBE
b
SIGNAL MEAN PERCENT CV
0 20 40 60 80 100 200 20 2
ybaC ybaF ybaQ ybaS ybdO ybhR ycxA
PROBE
0 1 2 3
012345
COPIES PER CELL (LOG10 SCALE)
CYE 5 SIGNAL (LOG10 SCALE)
200
0 1 2 3
012345
COPIES PER CELL (LOG10 SCALE)
CYE 5 SIGNAL (LOG10 SCALE)
20
0 1 2 3
01234
COPIES PER CELL (LOG10 SCALE)
CYE 5 SIGNAL (LOG10 SCALE)
2 0 1 2 3
01234
COPIES PER CELL (LOG10 SCALE)
CYE 5 SIGNAL (LOG10 SCALE)
200
MICROGRID/MICROSPOT 10K GENETIX/TELECHEM CHIPMAKER GEN III/GEN III
0 1 2 3
01234
COPIES PER CELL (LOG10 SCALE)
CYE 5 SIGNAL (LOG10 SCALE)
20
MICROGRID/MICROSPOT 10K GENETIX/TELECHEM CHIPMAKER GEN III/GEN III
0 1 2 3
0123
COPIES PER CELL (LOG10 SCALE)
CYE 5 SIGNAL (LOG10 SCALE)
2
MICROGRID/MICROSPOT 10K GENETIX/TELECHEM CHIPMAKER GEN III/GEN III A
B
C
D
Gen III / Gen III Genetix / Telechem Gen III / Gen III
Genetix / Telechem Gen III / Gen III
Analysis of the morphological variability in the array features using the ycxA probe Figure 3
Analysis of the morphological variability in the array features using the ycxA probe. Plot of signal intensities versus feature diameter. Only probes that passed feature quality control were considered. The data for all three robots is presented.
40 50 60 70 80 90 100
7
8
9
1
01
11
2
Microgrid
Spot Diameter
Signal Intensity
200 20 5 2 0.05
100 120 140 160 180 200
8
1
01
21
41
6
Gen III
Spot Diameter
Signal Intensity
200 50 20 5 2 0.5
40 60 80 100 120 140 160
6
8
10
12
14
16
Genetix
Spot Diameter
Signal Intensity
Publish with BioMed Central and every scientist can read your work free of charge "BioMed Central will be the most significant development for disseminating the results of biomedical researc h in our lifetime."
Sir Paul Nurse, Cancer Research UK
Your research papers will be:
available free of charge to the entire biomedical community
peer reviewed and published immediately upon acceptance
cited in PubMed and archived on PubMed Central
yours — you keep the copyright
Submit your manuscript here:
http://www.biomedcentral.com/info/publishing_adv.asp
BioMedcentral
analyses of the variations introduced by differing combi-nations of spotting robots and capillary pin.
Availability
Project Home Page: http://www.microarrays.ucsd.edu/ microarraymeter
Authors' contributions
RR and GH conceived the study. RR and LS fabricated the synthetic universal amplicon (SUA), amplified the probes and prepared the fluorescent targets. KF, CE and JL fabri-cated microarrays and performed hybridizations. CRB, AL and IW provided bioinformatics support. CRB helped draft the manuscript. GH co-ordinated the study and wrote the manuscript. All authors read and approved the final manuscript.
Conflicts of interests
The authors declare that they have no competing interests.
Additional material
Acknowledgements
This work was generously supported in part by NIH/NIDDK – Award 1 P30 DK063491-03.
References
1. Marton MJ, DeRisi JL, Bennett HA, Iyer VR, Meyer MR, Roberts C, Stoughton R, Burchard J, Slade D, Dai H, Bassett DE Jr, Hartwell LH, Brown PO, Friend SH: Drug target validation and identification of secondary drug target effects using DNA microarrays.
Nature Med 1998, 4:1293-1301.
2. Hardiman G: Microarrays Technologies 2006: an overview.
Pharmacogenomics 2006, 8:1153-1158.
3. Bowtell DDL: Options available – from start to finish for obtaining expression data by microarray. Nature Genetics 1999,
21:25-32.
4. Rouse R, Verdun K, Hardiman G: DNA microarrays and the core facility. In Microarray Methods and ApplicationsVolume 3. Edited by: Hardiman G. DNA Press Inc., Eagleville, PA; 2003:37-66.
5. Chandrasekharappa S, Holloway A, Iyer V, Monte D, Murphy M, Nowak NJ: Generation of probes for spotted microarrays. In
DNA Microarrays: A Molecular Cloning Manual Edited by: Bowtell D,
Sambrook J. Cold Spring Harbor Laboratory Press, Cold Spring Har-bor, NY; 2003:1-60.
6. Finkelstein D, Ewing R, Gollub J, Sterky F, Cherry JM, Somerville S:
Microarray data quality analysis: lessons from the AFGC project. Arabidopsis Functional Genomics Consortium. Plant
Mol Biol 2002, 48:119-131.
7. Patel JK, Patel NM, Shiyani RL: Coefficient of variation in field experiments and yardstick thereof – An empirical study.
Cur-rent Science 2001, 81:1163-1164.
8. Brown PO, Botstein D: Exploring the new world of the genome with DNA microarrays. Nature Genet 1999, 21:33-37.
9. Knight J: When the chips are down. Nature 2001, 410:6831. 10. Hardiman G: Microarray platforms-comparisons and
con-trasts. Pharmacogenomics 2004, 5:487-502.
11. Hegde P, Qi R, Abernathy K, Gay C, Dharap S, Gaspard R, Hughes JE, Snesrud E, Lee N, Quackenbush J: A concise guide to cDNA microarray analysis. Biotechniques 2000, 3:548-556.
12. Diehl F, Grahlmann S, Beier M, Hoheisel JD: Manufacturing DNA microarrays of high spot homogeneity and reduced back-ground signal. Nucleic Acids Res 2001, 29:E38.
13. Dolan PL, Wu Y, Ista LK, Metzenberg RL, Nelson MA, Lopez GP:
Robust and efficient synthetic method for forming DNA microarrays. Nucleic Acids Res 2001, 29:E107-7.
14. Worley J, Bechtol K, Penn S, Roach D, Hanzel D, Trounstine M, Barker D: A Systems Approach to Fabricating and Analyzing DNA Microarrays. In Microarray Biochip Technology Volume 4. Edited by: Schena M. Biotechniques Books, Eaton Publishing, Natick MA; 2000:65-85.
15. Dudley AM, Aach J, Steffen MA, Church GM: Measuring absolute expression with microarrays with a calibrated reference sample and an extended signal intensity range. Proc Natl Acad
Sci USA 2002, 99:7554-7559.
16. Rouse RJ, Espinoza CR, Niedner RH, Hardiman G: Development of a microarray assay that measures hybridization stoichiome-try in moles. Biotechniques 2004, 36:464-470.
17. Khan RL, Gonye GE, Gao G, Schwaber JS: A universal reference sample derived from clone vector for improved detection of differential gene expression. BMC Genomics 2006, 7:109-119. 18. Hou BH, Somerville S, Holloway A, Murphy M: Checking the
Qual-ity of the printed slide. In DNA Microarrays: A Molecular Cloning
Manual Edited by: Bowtell D, SambrookJ. Cold Spring Harbor
Labo-ratory Press, Cold Spring Harbor, NY; 2003:79-84.
Additional file 1
The microarray meter consists of nucleic acid targets (reference and dynamic range control) and probe components. A description of the differ-ent plate designs formulated to accommodate differdiffer-ent robotic and pin designs is provided.
Click here for file