RESEARCH ARTICLE
In silico characterization of cell–cell
interactions using a cellular automata
model of cell culture
Takanori Kihara
1*, Kosuke Kashitani
2and Jun Miyake
2Abstract
Background: Cell proliferation is a key characteristic of eukaryotic cells. During cell proliferation, cells interact with each other. In this study, we developed a cellular automata model to estimate cell–cell interactions using experimen‑ tally obtained images of cultured cells.
Results: We used four types of cells; HeLa cells, human osteosarcoma (HOS) cells, rat mesenchymal stem cells (MSCs), and rat smooth muscle A7r5 cells. These cells were cultured and stained daily. The obtained cell images were bina‑ rized and clipped into squares containing about 104 cells. These cells showed characteristic cell proliferation patterns. The growth curves of these cells were generated from the cell proliferation images and we determined the doubling time of these cells from the growth curves. We developed a simple cellular automata system with an easily accessible graphical user interface. This system has five variable parameters, namely, initial cell number, doubling time, motil‑ ity, cell–cell adhesion, and cell–cell contact inhibition (of proliferation). Within these parameters, we obtained initial cell numbers and doubling times experimentally. We set the motility at a constant value because the effect of the parameter for our simulation was restricted. Therefore, we simulated cell proliferation behavior with cell–cell adhesion and cell–cell contact inhibition as variables. By comparing growth curves and proliferation cell images, we succeeded in determining the cell–cell interaction properties of each cell. Simulated HeLa and HOS cells exhibited low cell–cell adhesion and weak cell–cell contact inhibition. Simulated MSCs exhibited high cell–cell adhesion and positive cell– cell contact inhibition. Simulated A7r5 cells exhibited low cell–cell adhesion and strong cell–cell contact inhibition. These simulated results correlated with the experimental growth curves and proliferation images.
Conclusions: Our simulation approach is an easy method for evaluating the cell–cell interaction properties of cells. Keywords: Cell proliferation, Cell–cell adhesion, Cell–cell contact inhibition, Cellular automata, Cell assay system
© The Author(s) 2017. This article is distributed under the terms of the Creative Commons Attribution 4.0 International License (http://creativecommons.org/licenses/by/4.0/), which permits unrestricted use, distribution, and reproduction in any medium, provided you give appropriate credit to the original author(s) and the source, provide a link to the Creative Commons license, and indicate if changes were made. The Creative Commons Public Domain Dedication waiver (http://creativecommons.org/ publicdomain/zero/1.0/) applies to the data made available in this article, unless otherwise stated.
Background
Cell culture techniques enable us to directly observe cells in vitro. Today, we can culture many types of cells includ-ing triploblastic, stem, and cancer cells. These cells can be viable and can proliferate under 2 dimensional (2D) cell culture conditions. Cells demonstrate their unique characteristics under such conditions; in particular, pro-liferation is one of the unique characteristics of cultured
cells. During cell proliferation, cells not only divide but also move and interact with each other. These elementary steps of cell proliferation demonstrate the characteristics of different cell types [1].
Cell culture is often used in cell assay systems, such as in evaluating the effect of drugs on cancer cells [2, 3]. Con-sidering the necessity for reduction of animal experiments, the demand for in vitro cell assay systems for drug and cosmetic development has increased [4, 5]. The param-eters available for evaluation from the cell assay system are cell growth rate, motility, and gene expression [6–9]. On the other hand, cell–cell interactions are also impor-tant parameters for cell characterization. Epithelial and
Open Access
*Correspondence: [email protected]
1 Department of Life and Environment Engineering, Faculty
of Environmental Engineering, The University of Kitakyushu, 1‑1 Hibikino, Wakamatsu, Kitakyushu, Fukuoka 808‑0135, Japan
Page 2 of 15 Kihara et al. BMC Res Notes (2017) 10:283
endothelial cells show high intercellular adhesion and they ultimately form tight junctions [10, 11]. Fibroblasts and smooth muscle cells adhere to each other and form cell aggregates [12, 13]. In the process of epithelial-to-mesen-chymal transformation, which is essential for animal and cancer development, intercellular adhesiveness decreases [14]. Increasing the density of endothelial or smooth mus-cle cells increased cell–cell contact and decreased cell spreading, leading to growth arrest [15]. Furthermore, the homotypic intercellular adhesive forces between ecto-derm, mesoecto-derm, and endoderm cells are different in each other [16]. Although these cell–cell interactions are important properties of cells, they are hard to evaluate in standard cell assay systems. Therefore, simple methods for evaluating cell–cell interaction properties are required for the development of cell assay systems for drug screening.
Mathematical modeling and computational simula-tion using differential equasimula-tions and cellular automata assume an important role in experimental modeling to study a variety of biological events [17]. Modeling is per-formed by abstracting some characteristic factors from the biological events, and the simulation displays the reconstruction results when those factors are used. Thus, modeling and computational simulation can help us to understand how certain biological processes occur, as well as inform us of the critical factors involved in these biological processes. There are many cellular automata models that can describe the population dynamics of cultured cells [1, 18–22]. These models capture the fea-tures of the proliferation process and include important parameters (cell size, seeding density, spatial distribution of cells, migration, and oxygen density) necessary for pre-diction of cell population behavior. Furthermore, there are some cellular automata models that include cell–cell adhesion effects to simulate cultured cells in 2D and 3D [19, 20, 23]. Therefore, using these models, we can esti-mate the cell–cell interaction properties of cultured cells. In this study, we developed a system for estimating the cell–cell interactions of cultured cells using a cellular automata model. To estimate the interaction parameters, we focused on images of cells in 2D cell culture because cell–cell interactions, especially cell–cell adhesion and cell–cell contact inhibition (of proliferation), affect the formation of cell aggregates. We obtained cultured cell images over time, and then assessed these images for cor-roboration with the cellular automata system. Using the cell growth rate and seeding density, which were deter-mined from the images, we succeeded in estimating the cell–cell adhesion and cell–cell contact inhibition param-eters. This method is useful for estimating these cell–cell interaction properties. This method could therefore be used as a new cell assay system for analysis of cell–cell interactions during drug screening.
Methods Materials
Male Fisher 344 rats were purchased from Japan SLC (Shizuoka, Japan). The rat aorta smooth muscle cell line, A7r5, was obtained from DS Pharma Biomedical Co. Ltd (Osaka, Japan). The human cervical cancer cell line, HeLa, and the human osteosarcoma cell line, HOS, were obtained from the Health Science Research Resources Bank (Osaka, Japan). Cell culture medium was purchased from Sigma-Aldrich (St. Louis, MO). Fetal bovine serum (FBS) was purchased from JRH Biosciences (Lenexa, KS). Antibiotics were purchased from Life Technologies Japan Ltd. (Tokyo, Japan). Other reagents were purchased from Wako Pure Chemical Industries Ltd. (Osaka, Japan), Sigma-Aldrich, and Life Technologies Japan Ltd.
Preparation and culture of rat mesenchymal stem cells Rat mesenchymal stem cells (MSCs) were isolated and primarily cultured as previously described [24]. Briefly, bone marrow cells were obtained from the femoral shafts of 7-week-old male Fisher 344 rats, which were anes-thetized and euthanized by exposing of carbon diox-ide. The cells were obtained from at least two rats and pooled in order to reduce the influence of individual differences. The culture medium was Eagle’s minimal essential medium (with Earle’s Salt and l-glutamine) containing 15% FBS and antibiotics (100 units/mL peni-cillin G, 100 µg/mL streptomycin sulfate, and 0.25 µg/ mL amphotericin B). The medium was replaced twice a week, and cells at passages 2–3 were used in this study. This study was carried out in strict accordance with the recommendations in the Guide for the Care and Use of Laboratory Animals of the University of Kitakyushu. The protocol was approved by the Committee on the Ethics of Animal Experiments of the University of Kitakyushu.
Cell culture
A7r5 cells, HeLa cells, and HOS cells were cultured in DMEM supplemented with 10% FBS and antibiotics (100 units/mL penicillin G, 100 µg/mL streptomycin sulfate). The medium was replaced twice a week.
Cell staining
Cells were seeded in a 35-mm culture dish at around 1 × 10⁴ cells/cm2. The cells were fixed with 4% paraform-aldehyde and stained with 0.4% trypan blue solution. The cells were imaged at 8.4× magnification using a stereomi-croscope (SZX12; Olympus, Tokyo, Japan) equipped with a DP70 color charge-coupled device camera (Olympus).
Image extraction of cell distribution
split into each RGB color channel. Then, the red chan-nel image, which was the image with the highest con-trast against the background, was subtracted from the background light shadow. The image was binarized with the adequate threshold intensity value, which was deter-mined by referring to the highly magnified image. The size of the square image was dependent on each cell type (rat MSC, 3.5 × 3.5 mm; Hela and HOS cells, 3 × 3 mm; A7r5 cells, 4 × 4 mm). After clipping the square image from the binarized image, the resolution of the image decreased to 100 × 100 px. The clipping cell size was determined by the area of approximately 1 × 10⁴ cells. We prepared more than five images for each condition.
Cell dynamics simulator Simulator specification
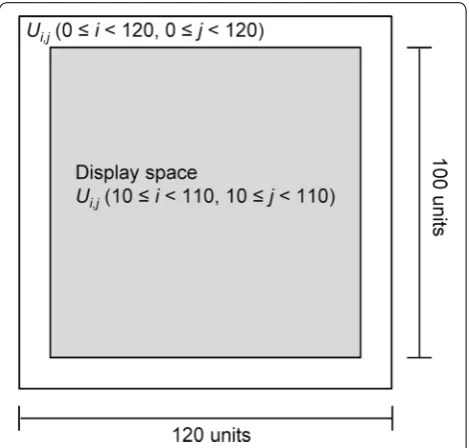
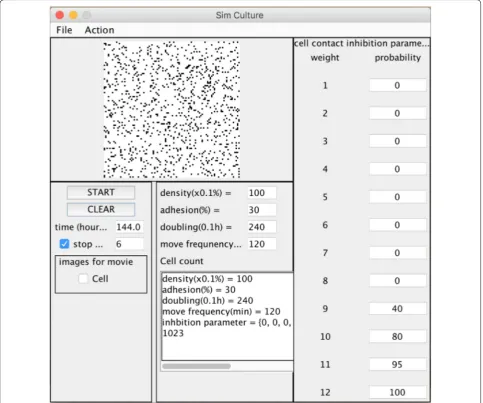
The 2D cell simulator was developed using Java (Ora-cle, Redwood Shores, CA). The cell distribution of the simulator was modeled by the cellular automata. The calculated space was set to 120 × 120 cell units and the displayed space on the screen was 100 × 100 cell units of the center of the calculated space (Fig. 1). Each unit indi-cates whether it is occupied by cells (black point) or it is vacant (white point). The model includes cell movement and division regulated by cell–cell interactions (cell–cell adhesion inhibits cell movement and cell–cell contact inhibition inhibits cell division). One cycle of the calcula-tion of cellular events (movement and division) indicates 10 min in a virtual environment. Because cells in the
early stages of cell culture exhibit a proliferation lag, we simulated cell proliferation behavior after 24 h of culture. Therefore, the cell seeding number, s0, was used to
repre-sent the cell number after 1-day culture in each cell type.
Cell dynamics
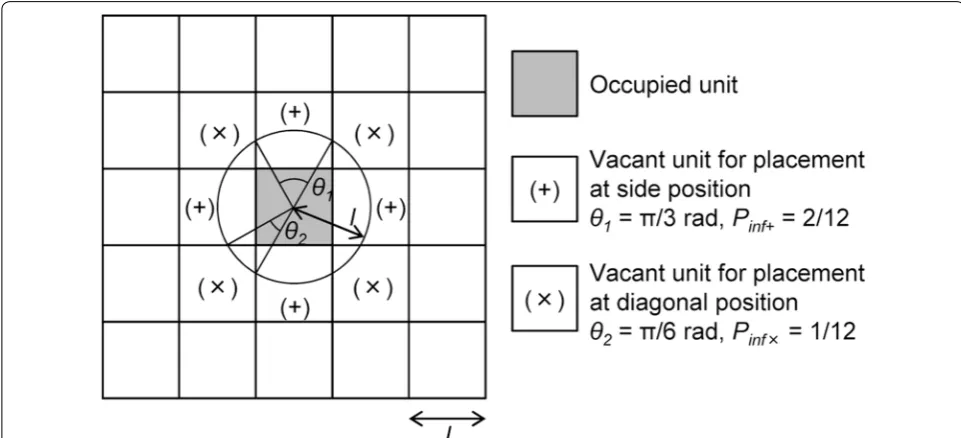
Each cell unit contacts the neighboring 8 units (Fig. 2). According to a previous study using cellular automata dynamical simulation of cell culture [21], the influence probabilities for the center unit from the neighboring 8 units are 1/12 and 2/12 at a diagonal position (Pinf×) and a side position (Pinf+) of a center unit, respectively (Fig. 2). Each influence probability was derived from the ratio of the central angle to 2π rad on a circle with a radius equal to the length of one side of the unit square.
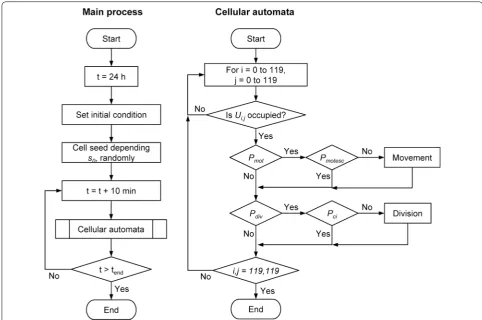
Figure 3 shows a flowchart of the cellular automata simulation. The method of cellular automata was applied in all cell occupied units.
The cell movement event is produced according to the probability, Pmot, which depends on the cell
motil-ity parameter mot; Pmot = 1/(6 mot). The mot means the
time (h) for a single unit transfer of the cell on average. During the cell movement event, the cell can escape from the event according to the influence of the surround-ing cells. The total influence of surroundsurround-ing cells, Psu, is
determined based on the influence probabilities, a diago-nal position of cell number n×, and a side position of cell number n+, Psu = n×Pinf× + n+Pinf+ = (n× + 2n+)/12.
Using the cell–cell adhesion parameter a, the cell escapes from the movement event with the probability, Pmotesc,
If the cell does not escape from the event, the cell moves around a vacant unit depending on the influence probabilities.
The cell division event is produced according to the probability, Pdiv, which depends on the cell doubling time
(h) td,
where α (=0.7147) is the offset of the cell division due to overlap with the immediately preceding cell division. During the cell division event, the cell can escape from the event according to the influence of the surround-ing cells. The total influence is determined by the influ-ence probabilities (Pinf×, Pinf+) and the cell number of the diagonal position and the side position of the cell, ci = 12 n× Pinf× + 12 n+ Pinf+ = n× + 2 n+. According to the cell–cell contact inhibition parameters, the cell escapes from the division event with the probabilities Pci. The Pci
can be fixed arbitrarily; but, in this study, we used four Pmotesc=1−
1− a 100
12Psu
.
Pdiv= α
(6td),
Fig. 1 Cell proliferation simulation space. The total calculated space is 120 × 120 cell units. Ui,j (0 ≤i < 120, 0 ≤j < 120) represents
[image:3.595.57.292.453.677.2]Page 4 of 15 Kihara et al. BMC Res Notes (2017) 10:283
different parameters as null (0, 0, 0, 0, 0, 0, 0, 0, 0, 0, 0, 1), weak inhibition (0, 0, 0, 0, 0, 0, 0, 0, 0, 0, 0.9, 1), positive inhibition (0, 0, 0, 0, 0, 0, 0, 0, 0.4, 0.8, 0.95, 1), and strong inhibition (0, 0, 0, 0, 0, 0.3, 0.6, 0.8, 0.9, 0.96, 0.99, 1). If the cell does not escape from the event, one of the daugh-ter cells occupies a surrounded vacant unit depending on the influence probabilities, and the other daughter cell occupies the unit of the original mother cell.
Estimation of cell proliferation parameters
The simulated cell proliferation parameters could be estimated from the growth curve and cell proliferation images. Cell proliferation was serially simulated with various cell proliferation parameters. Then, the simu-lated cell number was evaluated and rated by comparing with the experimentally obtained data using least square analysis. Within the several higher conditions, the most matching parameters were finally determined by visually comparing the simulated cell images with the experimen-tally obtained cell images.
Results and discussion
Analysis of cell proliferation under experimental culture conditions
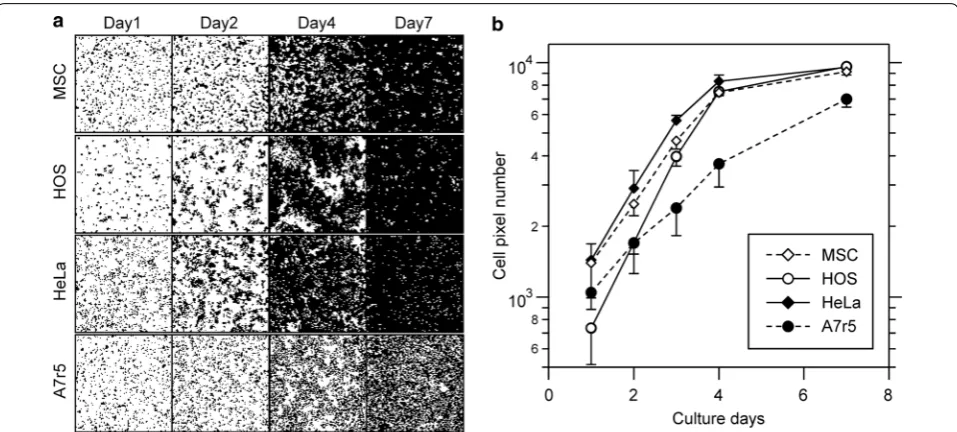
First, we analyzed cell proliferation using four different types of cells: rat mesenchymal stem cells (MSCs), human cervical cancer HeLa cells, human osteosarcoma HOS cells, and rat aorta smooth muscle A7r5 cells. These cells were stained with trypan blue daily. The obtained cell images
were binarized and clipped into squares of about 104 cells. Then, the resolution of the clipped image was decreased to 100 × 100 px. Figure 4a shows the binarized and clipped images of each cell type. The appearance of the prolif-eration process varied according to the cell type. The area covered by MSCs showed a mottled pattern at 4 days and cell-free area remained even at 7 days. HOS cells grew in large colonies initially, but eventually showed a conflu-ent pattern. HeLa cells grew rapidly and quickly reached confluence. A7r5 cells showed sparse cell confluence after 7 days of culture. The growth curves, calculated using num-ber of black pixels in the cell images, are shown in Fig. 4b. The cell-stained pixels grew exponentially in the early phase of cell culture. Therefore, the transition of the pixel number represents the cell proliferation curve. Next, we calculated the doubling time and the pixel number at 24 h for each cell type using the pixel proliferation data from the early phase of the cell culture. The calculated doubling times of MSCs, HOS, HeLa, and A7r5 cells were approximately 27.7, 19.7, 24.2, and 40.3 h, respectively. The pixel number at 24 h for each cell type was 1390, 740, 1450, and 1070, respectively. Using these experimental data, we analyzed the cell–cell interaction properties of each cell type.
Development of cell proliferation simulator
To estimate cell–cell interaction properties such as cell–cell adhesion and cell–cell contact inhibition, we constructed a simple cell proliferation simulator using a cellular automata model. Here, cell–cell adhesion and
Fig. 2 Array of unit squares representing cells. One unit is in contact with the neighboring 8 units. l is the length of a unit, which is altered in each cell type. θ1 (π/3) and θ2 (π/6) are the angles which face to the side and the diagonal position of units, respectively. The influence probabilities from
[image:4.595.56.537.88.307.2]cell–cell contact inhibition show cell migration inhibi-tion and cell division inhibiinhibi-tion, respectively. The graphi-cal user interface of our developed system is shown in Fig. 5. We arranged 120 × 120 cell units of virtual space as cell proliferation space (Fig. 1), and a single black point was used to represent a single cell (Fig. 2). We assumed that the centered 100 × 100 cell units of the virtual space reflected the binarized and clipped images of cul-tured cells (Fig. 4a). To construct the simulator, we set 5 parameters, which were initial cell seeding cell number s0, doubling time td (h), motility mot (h), cell–cell
adhe-sion a (%), and cell–cell contact inhibition Pci (detailed in
“Methods”).
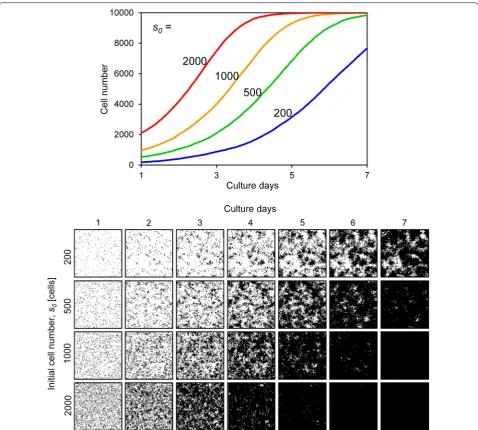
First, we showed outputs from our simulator. The outputs of this simulator were the cell number and cell image for each culture time, based on setting the above five parameters. Figure 6 shows results when the initial cell number s0 was variable. The growing cells gradually
filled the cell culture space, eventually occupying the entire space (Fig. 6). Comparing low versus high s0
val-ues, the cells with low s0 values grew and formed a large
cell colony, whereas cells with high s0 values completely
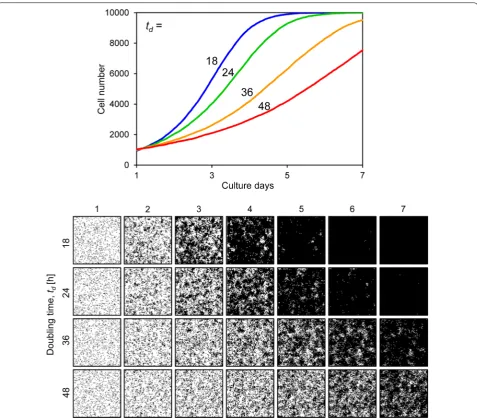
filled the space (Fig. 6). Figure 7 shows results when the doubling time td was variable. When td was set to 18 h,
the cells occupied almost the entire culture space on day 5 of culture. However, when td was set to 48 h, the
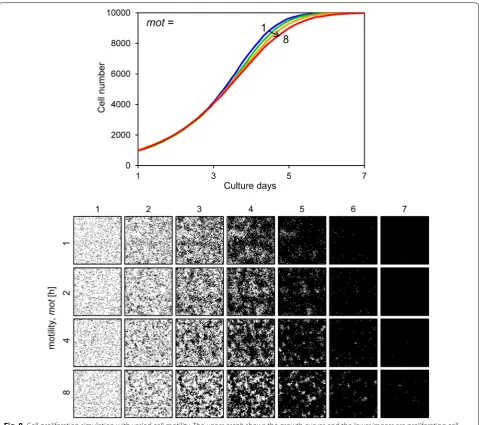
slope of the growth curve decreased and the cells could not fill the space by day 7 (Fig. 7). Figure 8 shows the results when the motility mot was variable. The growth curves demonstrate gradual growth when the mot value was high, i.e. low motility conditions (Fig. 8). Focusing on the growing cell images at day 4 of culture, the cells were well spread when the mot value was low, whereas they displayed a mottled pattern when the mot value was high (Fig. 8). Figure 9 shows the results when cell– cell adhesion a was variable. The slope of the growth
Fig. 3 Flow charts of the cell proliferation simulation. The left chart shows the main process and the right chart shows the cellular automata process. One cycle of the process is 10 min of virtual cell culture. There are two events, namely movement and division, in the cellular automata process. The movement event is started according to the Pmot, which is determined by the cell motility parameter mot, and terminated according to the Pmotesc,
which is determined by the effect of cell–cell adhesion (parameter a) with surrounding cells (the parameter is Psu). The cell division event is started
according to the Pdiv, which is determined by the cell doubling time td, and terminated according to the Pci, which is determined by the effect of
[image:5.595.55.538.87.407.2]Page 6 of 15 Kihara et al. BMC Res Notes (2017) 10:283
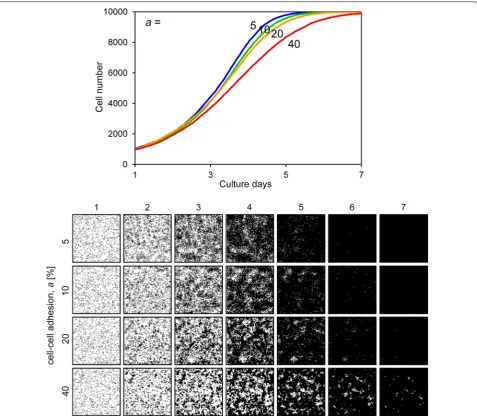
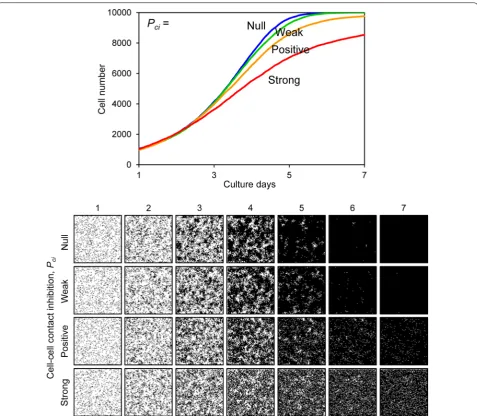
curve gradually decreased when the value of a was high (Fig. 9). The cell images obtained after 4 days of culture showed a highly mottled pattern when the value of a was high (Fig. 9). Figure 10 shows the results when cell–cell contact inhibition Pci was variable. When the Pci was set
as null, the cells completely filled the space after 7 days of culture (Fig. 10). However, when the Pci was set to
strongly inhibited conditions, the cells proliferated but only sparsely filled the culture space (Fig. 10).
The initial cell number s0 and the doubling time td
are critical factors for cell proliferation, and when they are changed, the form and slope of the growth curve drastically changes (Figs. 6, 7). In this study, these two parameters were determined by the experimental results. However, the effects of motility mot, cell–cell adhesion a, and cell–cell contact inhibition Pci were
relatively restricted. These parameters affected growing cell patterns (Figs. 8, 9, 10). In this study, we could not determine these parameters from the experimentally obtained results. Of these parameters, mot and a are parameters for assessing for the cell movement event (Fig. 3). Comparing the cell proliferation simulation with variable mot to that with variable a, the impact of a was more significant than that of mot (Figs. 8, 9). Furthermore, cell motility can be determined by some
other methods [7, 25]. Therefore, in this study, we sim-ulated the cell proliferation behavior with the cell–cell adhesion a and cell–cell contact inhibition Pci, which
are the parameters reflecting the cell–cell interaction activity, as variable.
Simulation of experimentally obtained cell proliferation One of the advantages of simulation is obtaining hypo-thetical experimental data. We can serially simulate various cell proliferation behaviors with varied cell prolif-eration parameters. Therefore, we attempted to estimate the cell–cell interaction activity parameters, i.e. cell–cell adhesion a and cell–cell contact inhibition Pci, for MSCs,
HOS, HeLa, and A7r5 cells. The experimentally obtained initial cell number and doubling time of each cell were used in the simulation. The motility was defined as a constant value. a varied from 10 to 40, in intervals of 10. Pci was defined as null, weak, positive, or strong
inhibi-tion. The simulated data were evaluated by comparison with experimentally obtained data. The simulated growth curves were ranked by least square analysis with the experimental growth curves. After choosing several high-ranking conditions, we visually compared the simulated cell images with experimentally obtained images, and then determined the simulation parameters of each cell.
[image:6.595.59.538.87.303.2]Figure 11 shows the simulated cell proliferation behav-iors of each cell type. The simulated growth curves fit with the experimental data for each cell type (Fig. 11). With regard to the cell growth images, simulated images roughly resembled the experimental images for each cell type. Simulated MSCs demonstrated a high cell–cell adhesion (a = 40) and positive cell–cell contact inhibi-tion (Fig. 11a). These cells exhibited fine mottled patterns of cell growth at day 3, and they did not reach confluence at day 7 (Fig. 11a). The fine mottled pattern was similar to that observed in the experimentally obtained cell prolif-eration images. Simulated HOS cells showed low cell–cell adhesion (a = 20) and weak cell–cell contact inhibition
(Fig. 11b). The simulated growth curve highly correlated with the experimental results. However, the experimen-tal HOS cells exhibited a large colony cell pattern at day 3, but the simulation could not reproduce the cell pat-terns (Fig. 11b). The simulated HeLa cells demonstrated low cell–cell adhesion (a = 20) and weak cell–cell con-tact inhibition (Fig. 11c). The simulated growth curve and cell images correlated with the experimental results (Fig. 11c). The simulated A7r5 cells demonstrated low cell–cell adhesion (a = 20) and strong cell–cell contact inhibition (Fig. 11d). The simulated growth curve of A7r5 cells also correlated with experimentally obtained results. The simulated cell images showed sparse cell confluence
[image:7.595.57.541.89.492.2]Page 8 of 15 Kihara et al. BMC Res Notes (2017) 10:283
with many vacant cell spaces at the later stages of cell culture, which was consistent with the experimentally obtained A7r5 cell pattern at day 7 (Fig. 11d).
In our system, the initial cell number and cell doubling time were experimentally obtained for each cell type. These two parameters most significantly affected the cell growth curve, and thus our simulated growth curves highly correlated with those that were experimentally obtained (Fig. 11). However, simulated images of growing cells were not always consistent with the experimentally
obtained images. Cell–cell adhesion affected the fine mottled formation of cell patterns, and cell–cell contact inhibition affected cell confluency at a later stage of cell culture (Figs. 9, 10). Therefore, we successfully simu-lated MSCs, which formed fine mottled patterns; HeLa cells, which demonstrated global proliferation; and A7r5 cells, which reached highly sparse confluence (Fig. 11). However, we could not fully simulate HOS cell prolifera-tion, which demonstrated a large colony growth pattern (Fig. 11). The formation of large colonies requires a small
Fig. 6 Cell proliferation simulation with varying initial cell numbers. The upper graph shows the growth curves and the lower images are the prolifer‑ ating cell images for each condition. The initial cell number s0 ranged from 200 to 2000. Other parameters were constant values: td, 24; a, 20; mot, 4;
[image:8.595.59.538.86.516.2]number of initial seeding cells (Fig. 6). However, the ini-tial cell number of HOS cells was about 740 (Table 1), which is higher than the initial cell number forming the large cell colony (Fig. 6). This inconsistency is attribut-able to the cell attachment behavior to the culture sub-strate. The experimentally obtained cell images of HOS cells at day 1 showed many small cell aggregations that contain several cells (Fig. 4). The cell-seeding algorithm of our system was assigned a random number. Thus, the simulated initial cell location was more dispersed than the experimental HOS cell initial location. We then simu-lated the proliferation of HOS cells using the experimen-tally obtained cell image from day 1, and repeated the cell
simulation with cell–cell adhesion a as variable and weak cell–cell contact inhibition. With low cell–cell adhesion (a = 10), the simulated growth curve correlated with the experimental growth curve of HOS cells (Fig. 12). Furthermore, the simulated cell image showed large cell colony forming proliferation (Fig. 12). Therefore, the cells that attached to the substrate with small cell aggregation were well simulated using the experimentally obtained initial cell image.
A summary of the simulated parameters for each cell type is shown in Table 1. From our simulation, we iden-tified three modes of cell proliferation behavior based on the four cell types analyzed. The first mode includes
Fig. 7 Cell proliferation simulation with varying cell doubling time. The upper graph shows the growth curves and the lower images are proliferat‑ ing cell images for each condition. The doubling time td [h] ranged from 18 to 48. Other parameters were constant values: s0, 1000; a, 20; mot, 4; Pci,
[image:9.595.60.538.86.504.2]Page 10 of 15 Kihara et al. BMC Res Notes (2017) 10:283
cancerous HOS and HeLa cells, which exhibit low cell– cell adhesion and weak cell–cell contact inhibition. The second was observed in MSCs, which exhibit high cell– cell adhesion and positive cell–cell contact inhibition. The third was observed in A7r5 cells, which exhibit low cell–cell adhesion and strong cell–cell contact inhibition. The cancer cells demonstrated exponential proliferation
and reached more than 95% confluence (Fig. 4). Gener-ally, cancer cells can grow without any positive cell–cell adhesion or cell–cell contact inhibition, and they can eas-ily attain an over-confluent cell pattern. Therefore, our simulated results reasonably describe these cells. The MSCs demonstrated a fine mottled proliferation pattern (Fig. 4), which requires high cell–cell adhesion values
[image:10.595.59.539.86.511.2]to be produced by the simulation (Fig. 9). Mesenchymal cells exhibit cell–cell contact inhibition and intercellular adhesive force is reported to be high [16]. Therefore, we concluded that the selected value of the cell–cell adhe-sion of MSCs was reasonable. A7r5 cells showed a very sparse confluence pattern (Fig. 4). These sparse patterns require strong cell–cell contact inhibition. On the other hand, simulated A7r5 cells did not demonstrate high
cell–cell adhesion. This is likely because the growth curve of A7r5 cells was exponential and the proliferative cell pattern did not show a mottled pattern. Thus, we suppose that this is the interaction properties of A7r5 cells.
In this study, we simulated all cells with a constant motility (mot = 4.0). This is because the effect of motil-ity was limited in the simulated growth curve (Fig. 8). It is difficult to determine appropriate parameter values
Fig. 9 Cell proliferation simulation with varied cell–cell adhesion. The upper graph shows the growth curves and the lower images are proliferating cell images for each condition. The cell–cell adhesion a (%) ranged from 5 to 40. Other parameters were constant values: s0, 1000; td, 24; mot, 4; Pci,
[image:11.595.60.538.87.503.2]Page 12 of 15 Kihara et al. BMC Res Notes (2017) 10:283
when the number of variables increases. Cell simulated results, in particular, can be quantitatively compared to experimentally obtained cell growth curves, but only qualitatively compared to experimentally obtained cell proliferation patterns. Therefore, it is necessary to reduce the number of variables. In this study, we treated only two parameters, cell–cell adhesion and cell–cell contact inhibition, as variables, and we succeeded with cell proliferation simulations (Figs. 11, 12). Future
[image:12.595.60.538.86.502.2]studies on the quantitative comparison of simulated cell images and experimentally obtained images are needed. However, it is difficult to evaluate the similarity of two different images. Here, we attempted 2D Fourier trans-formation of cell images and compared the power spec-trums of the resulting images, but we did not obtain quantitative values from the comparison. Therefore, another image comparison algorithm will be needed for this type of analysis.
Fig. 10 Cell proliferation simulation with varied cell–cell contact inhibition of proliferation. The upper graph shows the growth curves and the
lower images are proliferating cell images for each condition. The cell–cell contact inhibition Pci ranged from null to strong. Other parameters were
Conclusions
We developed a cellular automata simulator for deter-mining the cell–cell interaction properties of cultured cells. Cultured cells proliferated with their character-istic cell patterns and growth curves. We determined their doubling time from their growth curves, and then simulated their proliferation using their doubling
[image:13.595.61.541.88.396.2]times and initial cell numbers, with cell–cell interac-tion properties as variables. The proliferainterac-tion could be simulated and we could determine their cell–cell inter-action properties. HOS and HeLa cancer cells exhibited low cell–cell adhesion and weak cell–cell contact inhi-bition of proliferation. MSCs exhibited high cell–cell adhesion and positive cell–cell contact inhibition of proliferation. A7r5 cells exhibited low cell–cell adhe-sion and strong cell–cell contact inhibition of prolifera-tion. These cell–cell interaction properties, which are characteristic features of each cell, could not be deter-mined from typical cell culture experiments. There-fore, our developed simulation approach is an easy method for evaluating the cell–cell interaction proper-ties of cells. Furthermore, this simulation can be used as a basic system for simulating many types of cellular events.
Fig. 11 Cell proliferation simulation for each cell type. The cell types are MSC (a), HOS (b), HeLa (c), and A7r5 (d). The simulated and experimentally obtained cell proliferation results are shown. The simulation growth curves are represented by lines and those from experimentally obtained results are shown as circles. The simulated cell images (Sim) and experimentally obtained images (Exp) are shown for day 3 (D3) and 7 (D7). The initial cell number s0 and doubling time td were used as determined in Fig. 4. The motility mot was used at a constant value of 4 (h). Cell–cell adhesion a and
cell–cell contact inhibition Pci values used are indicated for each graph
Table 1 Parameters of each cell proliferation simulation
Parameter MSC HOS HeLa A7r5
s0 (cells) 1390 740 1450 1070
td (h) 27.7 19.7 24.2 40.3
a (%) 40 10 20 20
[image:13.595.57.291.494.565.2]Page 14 of 15 Kihara et al. BMC Res Notes (2017) 10:283
Abbreviations
HOS: human osteosarcoma; MSC: mesenchymal stem cell; 2D: 2 dimensional; FBS: fetal bovine serum; GUI: graphical user interface.
Authors’ contributions
TK, KK, and JM designed experiments. TK and KK performed experiments. TK wrote the paper. All authors read and approved the final manuscript.
Author details
1 Department of Life and Environment Engineering, Faculty of Environmental Engineering, The University of Kitakyushu, 1‑1 Hibikino, Wakamatsu, Kitaky‑ ushu, Fukuoka 808‑0135, Japan. 2 Department of Mechanical Science and Bio‑ engineering, Graduate School of Engineering Science, Osaka University, 1‑3 Machikaneyama, Toyonaka, Osaka 560‑8531, Japan.
Acknowledgements
The authors would like to acknowledge Mr. Shuhei Takasaki (School of Engineering Science, Osaka University) for his technical support in the programming.
Competing interests
The authors declare that they have no competing interests.
Availability of data and materials
All relevant data of this article are included within the article.
Ethics approval
Animal procedure was approved by the Committee on the Ethics of Animal Experiments of the University of Kitakyushu. Animal work was carried out in strict accordance with the recommendations in the Guide for the Care and Use of Laboratory Animals of the University of Kitakyushu.
Funding
This work was supported by grants from the Ministry of Education, Culture, Sports, Science, and Technology of Japan (24106507 and 16K01368) and Japan Science and Technology Agency (JST) (AS232Z02662F).
Publisher’s Note
Springer Nature remains neutral with regard to jurisdictional claims in pub‑ lished maps and institutional affiliations.
Received: 25 October 2016 Accepted: 8 July 2017
References
1. Zygourakis K, Bizios R, Markenscoff P. Proliferation of anchorage‑ dependent contact‑inhibited cells: I. Development of theo‑ retical models based on cellular automata. Biotechnol Bioeng. 1991;38:459–70.
2. Wlodkowic D, Cooper JM. Tumors on chips: oncology meets microfluid‑ ics. Curr Opin Chem Biol. 2010;14:556–67.
3. Katt ME, Placone AL, Wong AD, Xu ZS, Searson PC. In vitro tumor models: advantages, disadvantages, variables, and selecting the right platform. Front Bioeng Biotechnol. 2016;4:12.
4. Pfuhler S, Fautz R, Ouedraogo G, Latil A, Kenny J, Moore C, Diembeck W, Hewitt NJ, Reisinger K, Barroso J. The cosmetics Europe strategy for animal‑free genotoxicity testing: project status up‑date. Toxicol In Vitro. 2014;28:18–23.
5. Williams DP, Shipley R, Ellis MJ, Webb S, Ward J, Gardner I, Creton S. Novel in vitro and mathematical models for the prediction of chemical toxicity. Toxicol Res. 2013;2:40–59.
6. An WF, Tolliday N. Cell‑based assays for high‑throughput screening. Mol Biotechnol. 2010;45:180–6.
7. Onuki‑Nagasaki R, Nagasaki A, Hakamada K, Uyeda TQ, Fujita S, Miyake M, Miyake J. Transfection microarrays for high‑throughput pheno‑ typic screening of genes involved in cell migration. Methods Mol Biol. 2010;629:193–203.
8. Harvey AL, Cree IA. High‑throughput screening of natural products for cancer therapy. Planta Med. 2010;76:1080–6.
9. Demir K, Boutros M. Cell perturbation screens for target identification by RNAi. Methods Mol Biol. 2012;910:1–13.
10. Vasioukhin V, Bauer C, Yin M, Fuchs E. Directed actin polymerization is the driving force for epithelial cell–cell adhesion. Cell. 2000;100:209–19. 11. Mege RM, Gavard J, Lambert M. Regulation of cell–cell junctions by the
cytoskeleton. Curr Opin Cell Biol. 2006;18:541–8.
12. Majack RA. Beta‑type transforming growth factor specifies organi‑ zational behavior in vascular smooth muscle cell cultures. J Cell Biol. 1987;105:465–71.
13. Kihara T, Imamura Y, Takemura Y, Mizuno K, Adachi E, Hayashi T. Intercel‑ lular accumulation of type V collagen fibrils in accordance with cell aggregation. J Biochem. 2008;144:625–33.
14. Yilmaz M, Christofori G. EMT, the cytoskeleton, and cancer cell invasion. Cancer Metastasis Rev. 2009;28:15–33.
15. Nelson CM, Chen CS. Cell‑cell signaling by direct contact increases cell proliferation via a PI3K‑dependent signal. FEBS Lett. 2002;514:238–42. 16. Krieg M, Arboleda‑Estudillo Y, Puech PH, Kafer J, Graner F, Muller DJ,
Heisenberg CP. Tensile forces govern germ‑layer organization in zebrafish. Nat Cell Biol. 2008;10:429–36.
17. Souza‑e‑Silva H, Savino W, Feijoo RA, Vasconcelos AT. A cellular automata‑ based mathematical model for thymocyte development. PLoS ONE. 2009;4:e8233.
18. Zygourakis K, Markenscoff P, Bizios R. Proliferation of anchorage‑depend‑ ent contact‑inhibited cells. II: experimental results and validation of the theoretical models. Biotechnol Bioeng. 1991;38:471–9.
19. Lee Y, Kouvroukoglou S, McIntire LV, Zygourakis K. A cellular automaton model for the proliferation of migrating contact‑inhibited cells. Biophys J. 1995;69:1284–98.
[image:14.595.56.291.86.333.2]20. Chung CA, Lin TH, Chen SD, Huang HI. Hybrid cellular automaton mod‑ eling of nutrient modulated cell growth in tissue engineering constructs. J Theor Biol. 2010;262:267–78.
Fig. 12 Cell proliferation simulation of HOS cells using the experi‑ mentally obtained initial cell pattern. The upper graph shows the growth curves and the lower images are simulated (line and Sim) and experimentally obtained (circles and HOS) proliferating cell images. The doubling time td was used as determined in Fig. 4. Other param‑
• We accept pre-submission inquiries
• Our selector tool helps you to find the most relevant journal • We provide round the clock customer support
• Convenient online submission • Thorough peer review
• Inclusion in PubMed and all major indexing services • Maximum visibility for your research
Submit your manuscript at www.biomedcentral.com/submit
Submit your next manuscript to BioMed Central
and we will help you at every step:
21. Kino‑Oka M, Umegaki R, Taya M, Tone S, Prenosil JE. Valuation of growth parameters in monolayer keratinocyte cultures based on a two‑dimen‑ sional cell placement model. J Biosci Bioeng. 2000;89:285–7. 22. Kino‑oka M, Maeda Y, Ota Y, Yashiki S, Sugawara K, Yamamoto T, Taya M.
Process design of chondrocyte cultures with monolayer growth for cell expansion and subsequent three‑dimensional growth for production of cultured cartilage. J Biosci Bioeng. 2005;100:67–76.
23. Cheng G, Youssef BB, Markenscoff P, Zygourakis K. Cell population dynamics modulate the rates of tissue growth processes. Biophys J. 2006;90:713–24.
24. Kihara T, Hirose M, Oshima A, Ohgushi H. Exogenous type I collagen facili‑ tates osteogenic differentiation and acts as a substrate for mineralization of rat marrow mesenchymal stem cells in vitro. Biochem Biophys Res Commun. 2006;341:1029–35.