RESEARCH NOTE
Simple and cost-effective laboratory
methods to evaluate and validate cell-free DNA
isolation
Afsaneh Mojtabanezhad Shariatpanahi
1, Parisa Rokni
1,2, Elaheh Shahabi
1,3, Fatemeh Varshoee Tabrizi
1and Mohammad Amin Kerachian
1,4,5*Abstract
Objective: In the present study, we investigated different simple and cost effective methods to evaluate and validate cell free DNA (cfDNA) isolation. The ability of the QIAamp DNA Blood Mini Kit method to extract cfDNA was assessed by several approaches, including purification of endogenous cfDNA and exogenous spike-in control material, prior to plasma extraction, and followed by quantitative-PCR.
Results: Using QIAamp DNA Blood Mini kit, nearly 27% (380 bp) to 35% (173 bp) cfDNA was recovered with a higher recovery of smaller size cfDNA (173 bp) in comparison to larger ones (380 bp). These simple laboratory methods can be used to assess the efficiency of any cfDNA isolation method.
Keywords: Plasma, Liquid biopsy, Cell-free DNA
© The Author(s) 2018. This article is distributed under the terms of the Creative Commons Attribution 4.0 International License (http://creat iveco mmons .org/licen ses/by/4.0/), which permits unrestricted use, distribution, and reproduction in any medium, provided you give appropriate credit to the original author(s) and the source, provide a link to the Creative Commons license, and indicate if changes were made. The Creative Commons Public Domain Dedication waiver (http://creat iveco mmons .org/ publi cdoma in/zero/1.0/) applies to the data made available in this article, unless otherwise stated.
Introduction
Circulating cell-free DNA (cfDNA) molecules are shed into bloodstream, plasma, serum, urine as well as other body fluids of humans [1]. Most evidence suggests that the released cfDNA is primarily a consequence of apop-tosis that could be released by various pathologic and normal physiologic mechanisms [2]. Evaluation and quantification of cfDNA in plasma or serum, termed “liquid biopsy” has become one of the most important clinical analysis for early cancer detection, genetic and epigenetic monitoring, recurrence prediction, therapeu-tic resistance assessment of cancer and prenatal testing [1–3]. Comprehensive liquid biopsy analysis may also represent a tool to assess both tumor burden and molec-ular features of disease [4]. Despite the extensive clinical utility of cfDNA, there are some challenges and difficul-ties in its extraction and subsequently its usage for exam-ple cfDNA is mostly fragmented and exists at very low
concentrations in plasma. Isolation, quantification and evaluation of cfDNA is not a straightforward task and it requires a sensitive and reliable workflow. Therefore, the present study designed and performed different simple experiments to isolate cfDNA and validate the extraction.
Main text
Sample collection and preparation
Plasma samples were chosen for evaluation of cfDNA extraction since the extracted cfDNA from plasma con-tains a lower background concentration of wild-type DNA in comparison to serum [2]. Peripheral blood was collected from healthy volunteers, placed into EDTA tubes and kept at room temperature (18 °C–22 °C) for no more than 2 h. Thereafter, the blood sample was cen-trifuged twice at 800g for 10 min followed by 1600g for 10 min. The plasma was separated and transferred to another tube and stored at − 80 °C for further analysis.
Circulating cell‑free DNA extraction
Plasma samples were thawed prior to Qiagen extrac-tion. In accordance with the manufacturer’s instructions, DNA was purified using the QIAamp Blood DNA Mini Kit (Qiagen, UK) by fast spin-column procedures. The
Open Access
*Correspondence: [email protected]; [email protected]
5 Department of Medical Genetics, Faculty of Medicine, Mashhad
University of Medical Sciences, Mashhad, Iran
protocol was performed by using 300 µl plasma and elut-ing the DNA with 30 µl of elution buffer (AE) in 2 steps, with 20 µl and 10 µl AE and incubation time of 5 min each.
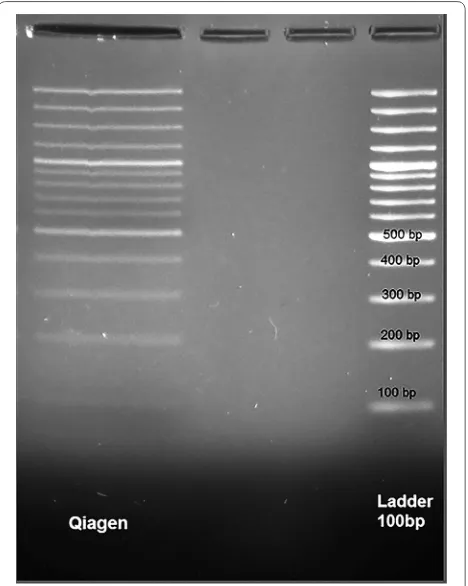
Experiment 1: following the spiked 100 base‑pair DNA ladder
To evaluate the bias associated with fragment size, and to determine if the DNA extraction method has led to loss of small or large DNA fragments, the following approach was used. Plasma of a healthy human was prepared as previously described. Ten microliter of GeneRuler 100 bp (Thermo-Scientific, United States) as a cfDNA was spiked in 300 μl plasma sample. The extraction was performed and the purified DNAs were analyzed on a 2% UltraPure Agarose gel (Invitrogen, United States) stained by Green Viewer (Parstous Biotechnology Co., Iran).
Experiment 2: looking for Y‑chromosome‑specific sequences in male‑bearing pregnancy
To ensure the presence of cfDNA in the extracted DNA, Y-chromosome-specific sequence (DYS221 locus), which represents male fetuses and does not exist in the mater-nal genome, was sought in male-bearing pregnancy in the maternal blood. Cell-free fetal DNA fraction repre-sents approximately 3–13% of the total cell-free maternal DNA plasma. Since a median of 99% of the fetal-derived DNA molecules was less than 313 base pair (bp) in length [5], a 173 bp amplicon of DYS221 locus was considered for amplification.
One and a half milliliter of plasma obtained from a woman with male-bearing pregnancy was prepared. Pooled plasma was divided into 5 micro-tubes (300 µl in each), and then extractions were performed. All these samples were evaluated by SYBR-Green real-time PCR in triplicate. DNA plasmas from a non-pregnant female and a male were considered as negative and positive controls, respectively. The quantitative PCR (qPCR) assays were performed according to the MIQE guidelines.
PCR amplifications were carried out on a LightCycler®
96 System (Roche, Germany). PCR was carried out in a 15 µl total volume using HiFi SYBR Green Master Mix (Farabin, Iran), 300 nM of each primer (Additional file 1: Table S1) , and 2.5 µl of DNA template. The amplification was consisted of 15 min at 95 °C, followed by 50 cycles of 20 s at 95 °C, 15 s at the primer annealing temperature of 59 °C and 15 s at 72 °C.
Experiment 3: following spiked bisulfite DNA
To assess the extraction efficiency, pooled plasma of a healthy human was divided into five micro-tubes (300 µl in each). EpiTect Control Unmethylated Bisulfite DNA (Qiagen, Germany) was spiked into all the plasmas, at
a final concentration of 75 ng/ml. Spiked bisulfite DNA was re-purified using QIAamp Blood DNA Mini kit extraction method.
Each sample was evaluated by SYBR-Green real-time PCR with bisulfite specific PCR (BSP) primers for Bone Morphogenic Protein 3 gene (BMP3, 256 bp) [6] in
tripli-cate. BSP primers specifically amplify bisulfite converted DNA (Additional file 1: Table S1). Genomic DNA was used in qPCR as a negative control and bisulfite unmeth-ylated DNA as a positive control. The qPCR assays were performed according to the MIQE guidelines.
Since a large fraction of DNA will be lost during bisulfite conversion, SYBR-Green nested qPCR assay was carried out [7]. PCR amplifications were run on a LightCycler® 96 System (Roche, Germany). PCR was car-ried out in a 15 µl total volume using HiFi SYBR Green Master Mix (Farabin, Iran), 300 nM of each primer, 0.2 µg/µl bovine serum albumin and 2.5 µl of bisulfite-modified template. The amplification was consisted of 15 min at 95 °C, followed by 15 cycles of 20 s at 95 °C, 15 s at the primer annealing temperature of 60 °C and 15 s at 72 °C.
For the second round of amplification, 2 μl of the PCR product from the initial amplification was used as the template. The condition of second round qPCR was 15 min at 95 °C, followed by 40 cycles of 20 s at 95 °C, 15 s at the primer annealing temperature of 60 °C and 15 s at 72 °C.
Experiment 4: following spiked male genomic DNA
To measure the absolute quantification of cfDNA extracted by Qiagen method, pooled plasma of healthy woman was divided in 11 microtubes (300 µl in each). Fragmented male genomic blood DNA was spiked at 1600 ng/ml (1.6 ng/µl) as final concentration in each plasma (10 microtubes). One remaining unspiked micro-tube was used as a negative control. To assess the recov-ery of the exogenous spike-in from cfDNA extraction, a seven-point two-fold dilution series (from 0.25 ng/µl to 16 ng/µl) of the genomic DNA from male blood (diluent, nuclease-free water) was used to draw standard curve for Y-chromosome-specific sequences: DYS221 locus (173 bp) and DAZ locus (380 bp) separately (Additional file 1: Table S1).
All samples were evaluated by SYBR-Green qPCR in trip-licate and the mean value was used for quantification. Its efficiency was calculated based on the slope of the standard curve (equation: efficiency = (10(−1/slope)− 1) × 100) and all
Experiment 5: Kras mutation monitoring
To show the presence of cell-free tumor DNA in cfDNA extractions, Kras mutation analysis was performed on the extracted cfDNA from plasma of a Kras positive colorec-tal cancer patient (exon 2, codons 12, G12D mutation).
Mutation detection was performed with a clinical vali-dated approach based on the allele-specific qPCR int-plex method [8]. PCR cycling analysis was conducted on LightCycler®96 Real-Time PCR System.
Design of qPCR primer systems were such that it could amplify two amplicons within a region of the tar-get mutant: one corresponding to a mutated allele spe-cific amplicon (61 bp, melting temperature about 81 °C) and the other to a wild-type reference amplicon (67 bp, melting temperature: about 75 °C). The test discriminates highly and specifically between mutant and wild-type alleles using a blocking 3′-phosphate modified oligonu-cleotide and low Tm primers.
The PCR conditions for KRAS were as follows: each 15 µl-triplicate reaction contained 2 µl of purified DNA diluted in 5X HOT FIREPol® EvaGreen® qPCR Mix Plus
HRM Master Mix and 200 nM primers (Additional file 1: Table S1), with the following PCR program and melting conditions used for all amplicons: 95 °C for 15 min; 45 cycles of 95 °C for 15 s and 60 °C for 20 s; 90 °C for 30 s, followed by a high resolution melt of 55–90 °C (0.01 °C/s, 45 acquisitions/°C). Data were acquired and analyzed using the accompanying High Resolution Melt software 1.1v. All HRM reactions were run in triplicate.
Quantitative results were measured as mean ± stand-ard deviation (SD) and differences were assessed by two-tailed unpaired t-test. The reproducibility of differ-ent protocols was evaluated by coefficidiffer-ent of variation (CV). p-value less than 0.05 was considered statistically significant.
Experiment 1: result
After re-purification, the DNA ladder was analyzed on 2% UltraPure Agarose gels by Green Viewer as shown in Fig. 1. The figure displays that all sizes of DNA ladder were purified with Qiagen method similar to the ladder configuration.
Experiment 2: result
SYBR-Green qPCR were performed in triplicate for
DYS221 locus (173 bp). Melting curves of all samples
were observed for every reaction to ensure that only one product was amplified. Three out of 5 Qiagen (Cq mean: 35.1) samples were successfully amplified indicating the presence of cfDNA in extracted DNA in this method (Additional file 2: Fig. S1).
Experiment 3: result
SYBR-Green nested qPCR were performed in triplicate for BMP3 (256 bp). Results showed that all Qiagen (Cq
mean: 33.3) samples were successfully amplified by the SYBR-Green nested qPCR (Additional file 3: Fig. S2).
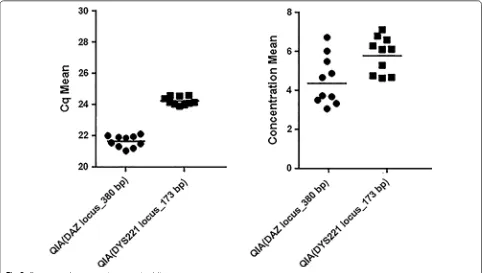
Experiment 4: result
CfDNA extraction for Qiagen method were performed in 10 replicates and each sample was quantified by SYBR-Green qPCR in triplicate for DAZ locus (380 bp) and
DYS221 locus (173 bp) separately.
The standard curve of the DAZ and DYS221 amplicon showed a PCR efficiency of 100% and 94% respectively. The linear regression analysis of mean cycle threshold values per triplicate against log concentrations in the dilution yielded R2= 1 for DAZ and R2= 0.99 for DYS221 locus (Additional file 4: Fig. S3).
All Qiagen samples were successfully amplified by the SYBR-Green qPCR assay. The mean ± SD of Cq-value
was 21.6 ± 0.37 (range 21.0–22.1) for DAZ locus and
24.2 ± 0.26 (range 23.9–24.6) for DYS221 locus. The
mean ± SD of concentration value was 4.54 ± 1.25 (range
3.1–6.75) for DAZ locus and 5.85 ± 0.93 (range: 4.66–
7.14) for DYS221 locus. Data were presented as scatter
[image:3.595.306.540.88.381.2]dot plot (Fig. 2). The Cq coefficients of variation (CV) was 1.74% for DAZ and 1.07% for DYS221 locus and the concentration CV was 27.56% and 15.89% for DAZ and
DYS221 locus, respectively.
Results showed that the recovery of Qiagen cfDNA extraction was about 27% for DAZ locus and 35% for
DYS221 locus and this kit had a CV of 15%, 26%, for DAZ
and DYS221 loci, respectively.
Experiment 5: result
Results indicated that Kras mutation was detected in cfDNA extracted by Qiagen method in plasma of a colo-rectal cancer patient whose colon biopsy was already
Kras positive (Fig. 3).
Sample handling and the techniques used for cfDNA analysis are one of the major hindrances in cfDNA stud-ies [9, 10]. Pre-analytical factors i.e. every step from
Fig. 2 Cq mean and concentration mean (ng/µl)
[image:4.595.57.539.88.361.2] [image:4.595.61.540.525.659.2]blood draw to sample collection and storage of DNA, potentially affecting cfDNA concentration and fragmen-tation, should be taken into account during data analysis [9, 11].
We demonstrated that using Qiagen kit, nearly 27% (DAZ, 380 bp) to 35% (DYS221, 173 bp) cfDNA was recovered with a higher recovery for smaller size cfDNA (DYS221, 173 bp) in comparison to larger ones (DAZ, 380 bp). Xue et al. reported the efficiency of DNA extrac-tion was 18.6% using the standard QIAamp Blood mini kit [12]. Fleischhacker et al. showed the median values for the quantitation for QIAamp DNA Blood Midi Kit was about 1.6–2.7 ng/ml [13].
Limitation
This study has some limitations. Studies with larger sam-ple size, could have more robust and consistent results. The results of some experiments could be affected due to the very fragmented and low concentration of cfDNA in plasma. The cfDNA extracted from plasma is instable and could be degraded by the passage of time as experi-enced by many scientists.
Additional files
Additional file 1: Table S1. Primer sequences.
Additional file 2: Fig. S1. SYBR Green real-time PCR for DYS221 locus in male bearing pregnancy. (a) Amplification Curve. (b) Melting peak.
Additional file 3: Fig. S2. Amplification curve of BMP3 gene in following spiked bisulfite DNA experiment.
Additional file 4: Fig. S3. The standard curve of the DAZ and DYS221 amplicon.
Abbreviations
cfDNA: cell free DNA; bp: base pair; AE: elution buffer; qPCR: quantitative polymerase chain reactions; BSP: bisulfite specific polymerase chain reactions; SD: standard deviation; CV: coefficient of variation.
Authors’ contributions
AMS and MAK conceived and designed the study. AMS, MAK and PR drafted the study protocol. FVT and MAK organized and supervised the study implementations, and AMS, MAK and PR drafted the manuscript. AMS, PR and ES performed the experiments and conducted the statistical analyses. AMS and MAK interpreted the results. All authors read and approved the final manuscript.
Author details
1 Cancer Genetics Research Unit, Reza Radiotherapy and Oncology Center,
Mashhad, Iran. 2 Department of Medical Genetic, Tabriz University of Medical
Sciences, Tabriz, Iran. 3 Department of Biology, Faculty of Science, University
of Guilan, Rasht, Iran. 4 Medical Genetics Research Center, Mashhad University
of Medical Sciences, Mashhad, Iran. 5 Department of Medical Genetics, Faculty
of Medicine, Mashhad University of Medical Sciences, Mashhad, Iran.
Acknowledgements
Our sincere thanks go to Reza Radiotherapy and Oncology Center (RROC) and also to Mr. Ebrahim Pouladin and Ms. Nafiseh Shalchi for their support in CRC research programs. We also give our special thanks to Ms. Maryam Yassi, Ms. Fatemeh Khadangi, Ms. Nosrat Nakhaie, and the staff of chemotherapy unit at RROC for their cooperation in this study.
Competing interests
The authors declare that they have no competing interests.
Availability of data and materials
Not applicable.
Consent for publication
Not applicable.
Ethics approval and consent to participate
All procedures performed in our studies involving human participants were in accordance with the ethical standards of the institutional and/or national research committee and has the approval from Mashhad University of Medical Sciences (Grant No. 961272). Informed consents were obtained written from all individual participants included in this study.
Funding
This research was conducted by the generous support of Reza Radiotherapy and oncology Center and financial support from Mashhad University of Medi-cal Sciences (Grant No. 961272).
Publisher’s Note
Springer Nature remains neutral with regard to jurisdictional claims in pub-lished maps and institutional affiliations.
Received: 15 September 2018 Accepted: 17 October 2018
References
1. van der Vaart M, Pretorius PJ. The origin of circulating free DNA. Clin Chem. 2007;53(12):2215. https ://doi.org/10.1373/clinc hem.2007.09273 4. 2. Qin Z, Ljubimov VA, Zhou C, Tong Y, Liang J. Cell-free circulating tumor
DNA in cancer. Chin J Cancer. 2016;35:36. https ://doi.org/10.1186/s4088 0-016-0092-4.
3. Babayan A, Pantel K. Advances in liquid biopsy approaches for early detection and monitoring of cancer. Genome Med. 2018;10:21. https :// doi.org/10.1186/s1307 3-018-0533-6.
4. Rossi G, Mu Z, Rademaker AW, Austin LK, Strickland KS, Costa RLB, et al. Cell-free DNA and circulating tumor cells: comprehensive liquid biopsy analysis in advanced breast cancer. Clin Cancer Res. 2018;24(3):560–8.
https ://doi.org/10.1158/1078-0432.ccr-17-2092.
5. Chan KC, Zhang J, Hui AB, Wong N, Lau TK, Leung TN, et al. Size dis-tributions of maternal and fetal DNA in maternal plasma. Clin Chem. 2004;50(1):88–92. https ://doi.org/10.1373/clinc hem.2003.02489 3. 6. Zou H, Harrington JJ, Shire AM, Rego RL, Wang L, Campbell ME, et al.
Highly methylated genes in colorectal neoplasia: implications for screen-ing. Cancer Epidemiol Biomarkers Prev. 2007;16(12):2686–96. https ://doi. org/10.1158/1055-9965.epi-07-0518.
7. Munson K, Clark J, Lamparska-Kupsik K, Smith SS. Recovery of bisulfite-converted genomic sequences in the methylation-sensitive QPCR. Nucleic Acids Res. 2007;35(9):2893–903. https ://doi.org/10.1093/nar/ gkm05 5.
8. Hamzehzadeh L, Khadangi F, Ghayoor Karimiani E, Pasdar A, Kerachian MA. Common KRAS and NRAS gene mutations in sporadic colorectal cancer in Northeastern Iranian patients. Curr Probl Cancer. 2018. https :// doi.org/10.1016/j.currp roblc ancer .2018.05.001.
9. El Messaoudi S, Rolet F, Mouliere F, Thierry AR. Circulating cell free DNA: preanalytical considerations. Clin Chim Acta. 2013;424:222–30. https :// doi.org/10.1016/j.cca.2013.05.022.
•fast, convenient online submission •
thorough peer review by experienced researchers in your field • rapid publication on acceptance
• support for research data, including large and complex data types •
gold Open Access which fosters wider collaboration and increased citations maximum visibility for your research: over 100M website views per year •
At BMC, research is always in progress.
Learn more biomedcentral.com/submissions
Ready to submit your research? Choose BMC and benefit from:
patients. Genes Genomics. 2018;40(4):423–8. https ://doi.org/10.1007/ s1325 8-017-0644-2.
11. Elshimali YI, Khaddour H, Sarkissyan M, Wu Y, Vadgama JV. The clinical utili-zation of circulating cell free DNA (CCFDNA) in blood of cancer patients. Int J Mol Sci. 2013;14(9):18925–58. https ://doi.org/10.3390/ijms1 40918 925.
12. Xue X, Teare MD, Holen I, Zhu YM, Woll PJ. Optimizing the yield and utility of circulating cell-free DNA from plasma and serum. Clin Chim Acta. 2009;404(2):100–4. https ://doi.org/10.1016/j.cca.2009.02.018.