using Grid-based PSEs
.
White Rose Research Online URL for this paper:
http://eprints.whiterose.ac.uk/7814/
Book Section:
Goodyer, C.E., Wood, J. and Berzins, M. (2008) Mathematical Modelling of Chemical
Diffusion through Skin using Grid-based PSEs. In: Bock, H.G., Kostina, E., Phu, H.X. and
Rannacher, R., (eds.) Modeling, Simulation and Optimization of Complex Processes.
Springer , Berlin Heidelberg , pp. 249-258. ISBN 978-3-540-79409-7
https://doi.org/10.1007/978-3-540-79409-7_16
[email protected] https://eprints.whiterose.ac.uk/ Reuse
See Attached
Takedown
If you consider content in White Rose Research Online to be in breach of UK law, please notify us by
Mathematical Modelling of Chemical Diffusion
through Skin using Grid-based PSEs
Christopher Goodyer1
, Jason Wood1
, and Martin Berzins2
1 School of Computing, University of Leeds, Leeds, UK, [email protected],[email protected]
2 SCI Institute, School of Computing, University of Utah, Salt Lake City, USA, [email protected]
Summary. A Problem Solving Environment (PSE) with connections to remote distributed Grid processes is developed. The Grid simulation is itself a parallel pro-cess and allows steering of individual or multiple runs of the core computation of chemical diffusion through the stratum corneum, the outer layer of the skin. The effectiveness of this Grid-based approach in improving the quality of the simulation is assessed.
1 INTRODUCTION
The use of Grid technologies [8] has enabled the automated use of remote distributed computers for many new applications. Many of the larger Grid projects around the world are not simply using high performance computers (HPC) but are making better use of the distributed networks of machines within their own companies and institutions. In many of these cases, the problems being tackled on these systems are not so large that parallel com-puting is being used for single cases, but instead, multiple production runs, sometimes within the context of a design optimization process, are run on a multiprocessor architecture, e.g. [11].
of the output, to changes to the inputs. A key element of PSEs is that they must be accessible for non-expert computer users, since the users are typically scientists more focused on their own fields rather than on the intricacies of using the Grid. PSEs are discussed in general in Sect. 3, together with the PSE developed in this work.
The application considered here is that of chemical diffusion through the skin. In this work we have simulated how the application of a chemical on the outside of the body gets through the outer layer into the body. The use of multiple simulations is very important for situations such as this, since each calculation represents only one particular case. For transient cases using the true full 3-d heterogeneous skin structure it can take hours or even days for solutions to fully converge. Through the use of multiple instances of the solver it is possible to reduce this to the maximum individual runtime, provided enough resources are available. Brief details of the solver, and the range of cases being considered are given in Sect. 2.
The interaction of the PSE with the remote processes is the most important part of this work. The software described here has allowed transparent use of the Grid. For example making the process of running a large parallel job on a remote resource as easy as running a small one locally is very important for non-expert users. We have used the gViz library [2, 22] to provide the Grid middleware to handle the communication between the user’s desktop and the remote Grid processes. How these components are joined together is discussed in Sect. 4 where the use of a directory service of running jobs is also described. The main advantages of using a PSE are the ability to visualise the output datasets and to steer the calculations; these are discussed in Sect. 5. The paper is summarised in Sect. 6 along with a summary of the advantages of the Grid-based approach described, and suggested necessary extensions for future work.
2 CHEMICAL DIFFUSION THROUGH SKIN
The motivating problem in this work is that of numerical modelling of chemical diffusion through the skin. Such a situation might arise either purposefully or accidentally. For example a person being accidentally exposed to a chemical at work may hope for minimal adsorption into the body, but application of a drug transdermally could have great therapeutic benefits.
Mathematical Modelling of Diffusion through Skin using Grid-based PSEs 3
corneocytes themselves are almost impermeable. The diffusion path through the lipid from surface to body is very tortuous due to the aspect ratio of the corneocytes.
The mathematical model of this Fickian diffusion process has been well understood for some time, although the modelling is often only done on 1-d homogeneous membranes. There has been some 2-1-d work on “brick an1-d mortar” shaped domains, notably that of Heisig et al. [13] and Frasch [9] but this work is the first to tackle the true three dimensional nature of the skin.
The model of Fickian diffusion is given in non-dimensional form by:
∂θ ∂τ = ∂ ∂X γ∂θ ∂X + ∂ ∂Y γ∂θ ∂Y + ∂ ∂Z γ∂θ ∂Z , (1)
where X,Y andZ are the coordinates,τ is the time,θ is the concentration, andγ the diffusion coefficient, with boundary conditions:
θ= 1, on Z=L θ= 0, onΓ :Z= 0,
and periodic boundary conditions between opposing faces perpendicular to theX-Y plane. In this work we are assuming that the corneocytes themselves are impermeable and hence on these boundaries we are assuming symmetry conditions perpendicular to the boundary. The domains have been meshed using unstructured tetrahedra, and discretised and solved using a Galerkin linear finite element solver, based on that originally developed by Walkley [19]. The quantities of interest are the concentration profile throughout the domain; the total flux out through the bottom face and thelag timea measure of the relative time taken to reach steady state. These are defined precisely as
Flux out,Fout=
1
AΓ
Z
Γ
∂θ
∂ZdΓ (2)
Cumulative mass out =
Z T
τ=0
Foutdτ , (3)
where the lag time is the X-intercept of the steady state rate of cumulative mass out, extrapolated backwards.
layers. Another case of great importance concerns the effect of the size of application patches to the skin. Since any patch spreads out sideways as well as down, even through homogeneous membranes, then the separation of patches compared to the depth of stratum corneum makes significant changes to both the mass of chemical getting into the body and the lag time.
3 PROBLEM SOLVING ENVIRONMENTS
PSEs allow a user to break away from the traditional batch mode of processing. Traditionally, the user of a scientific research code would set all the parameters inside the program, compile the software, run it with the results saved to disk. These results could then be loaded into a visualisation package, processed and rendered as a screen output. Only once this sequence had been completed would the user be able to decide if the original set of parameters needed alteration, and the whole process would begin again.
PSEs are typically built in or around visualisation packages. Some commer-cial visualisation products have added PSE capabilities during their develop-ment, such as IRIS Explorer [21] and AVS [18]. Other systems that were built around particular application areas have expanded into more general prod-ucts, such as SCIRun [16]. These all have the same key elements of modular environments where graphical blocks represent the tasks (modules), with wires joing the blocks representing dataflow from one task to another. The arrange-ments of modules and wires are variously referred to as workflow, dataflow networks and maps. With a PSE the simulation is presented as a pre-compiled module in the workflow, and all the variables that may be changed are made available to the user through a graphical user interface (GUI).
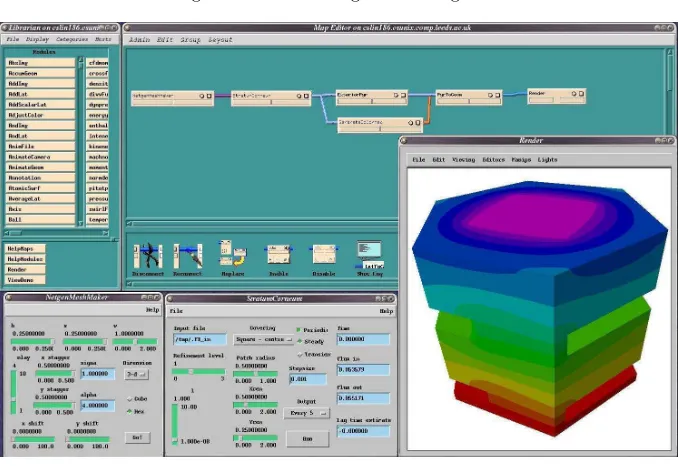
An example of the interface of the standard PSE for chemical diffusion through the skin, with the simulation running completely on the local ma-chine, is shown with IRIS Explorer in Fig. 1. The key parts of the environment are, clockwise from top left, the librarian (a repository of all available mod-ules), the map editor (a workspace for visually constructing maps), the output visualisation, and the input modules. IRIS Explorer has a visual programming interface where modules are dragged from the librarian into the map editor and then input and output ports are wired together between different modules to represent the flow of data through the pipeline, typically ending up with a rendered 3-d image. The inputs to the modules are all given through GUIs enabling parameter modification without the need to recompile.
Mathematical Modelling of Diffusion through Skin using Grid-based PSEs 5
Fig. 1.IRIS Explorer PSE for skin
be steady state or transient, and computational parameters such as the level of initial grid adaptation and the frequency of generation of output datasets.
4 REMOTE GRID SIMULATION
One of the drawbacks to using a PSE used to be that the simulation was part of the environment and therefore had to be run locally within the PSE. This assumption, however, is not necessarily true as was shown by the ‘Pollution Demonstrator’ of Walkley et al. [3, 20] which extended the approach to that of a remote simulation connected to a local (IRIS Explorer) PSE which still handled the steering and visualisation needs. This bespoke approach has been extended into a generic thread-based library, calledgViz[2] providing an inter-face to the remote simulation. The local PSE environment is now independent and hence no longer needs to be IRIS Explorer.
To launch the simulation onto a remote resource it is necessary to both select the desired machine and an appropriate job launching mechanism. The launching module can interrogate a GIIS service (part of the Globus toolkit [7]) to discover information about available resources. Once the simu-lation starts, the gViz thread opens a port to which connections can be made. The gViz library supports several communications methods between simu-lation and other processes. Here we are using a web service style directory service communication built around SOAP using the gSOAP library [6]. In this method, the simulation contacts the directory service at startup and de-posits its connection details. These can then be retrieved by the one or more PSEs when convenient to the user.
The ability to undertake collaborative work is provided at no extra cost through the use of the gViz library. Since the directory service can be adver-tised to collaborators as running in a consistent location they will all be able to connect to this to discover the location of all the running simulations. This also assists users who may wish only to visualise the output rather than steer. When multiple simulations are involved then there are additional job sub-mission considerations. Many providers of Grid resources are actively limiting the number of submissions per person able to be executed simultaneously, and hence running large numbers concurrently is often not possible on the chosen resource. In the work of Goodyer et al. [11] it was seen how the use of a parallel environment was beneficial for solution time of a previously serial optimisation application, through concurrent simulation of independent cases with similar parameter sets. Here we extend this idea to take the multiple independent simulations inside one large MPI job. This means that co-allocation of all runs is handled by the resource’s own job scheduler and reduces the number of submitted jobs to just one, thus avoiding any resource limits set. When the MPI job starts all simulations register separately with the directory ser-vice, with unique identifiers allowing each to communicate back to the PSE separately if required.
5 VISUALISATION AND STEERING
With multiple simulations being controlled by the same PSE there are issues concerning effective management of both input and output data, [4, 22]. In this section we address these in turn, relating to how they have been used for the skin cases solved to date. The cases discussed here are all concerned with assessing how the geometric makeup of the skin affects the calculated values of flux out and lag time. To that end we have already generated a large selection of 3-d meshes for the solver to use On start-up each parallel process uses standard MPI [15] commands to discover its unique rank in the simulation, and load the appropriate mesh.
Mathematical Modelling of Diffusion through Skin using Grid-based PSEs 7
as described in Sect. 2, and the viewables are output variables calculated by the simulation to which the module is currently attached, including the quantities of interest and the current time of the solver through a transient simulation.
Another difference between the PSE shown in Fig. 1 and the Grid en-abled version is that this steering module now has two location bars along the bottom, and the buttons ‘Connect’ and ‘Steer all’. The two location bars contain the connection information retrieved from the directory service: the first being an individual location, the second being a multiline list of simula-tions. The connections for steering updates can therefore be actually given to anywhere from one to all of the simulations simultaneously. In this manner it is possible to extend the experimentation approach, discussed in Sect. 3 to many simulations, rather than one specific case at a time. In addition to the ability to ‘Steer all’ it is similarly possible to retrieve all the current viewable parameters from the simulations currently running, and hence the ability to produce summary visualisations of all the cases.
The visualisation of remote gViz processes for both 2-d and 3-d datasets has been done in IRIS Explorer, SCIRun, VTK and Matlab [1, 2, 10, 20]. The data sent is generic to enable the client PSE end to convert it into a native format.
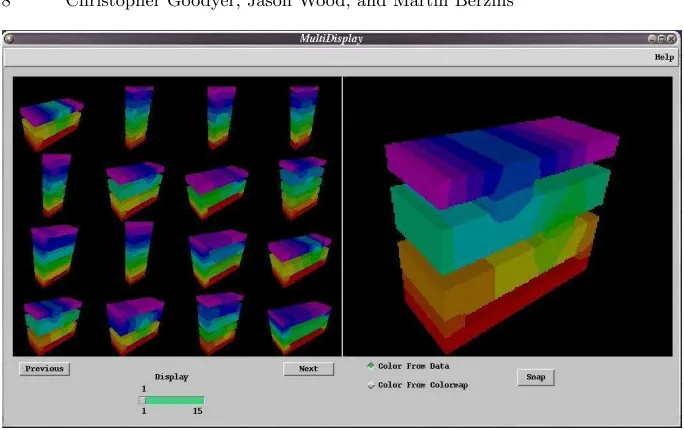
For concurrent simulations visualisation are conceptually no harder than for a single simulation, however the realities are slightly different. In the work of Handley et al. [1] this has been tackled for the first time. Here multiple datastreams from multiple simulations are combined, and the 2-d output is tiled across the display. In 3-d this is a significantly harder problem, because the quantities of data being returned by the simulation are potentially orders of magnitude more. To address this issue we have developed a ‘MultiDisplay’ module, as shown in Fig. 2. This module receives images rather than the usual 3-d data. The individual datastreams from the simulations are rendered off screen, with an appropriate colourmap and camera position to produce a 2-d image, and these images are fed into the MultiDisplay module. The image pane on the left shows tiles of 16 simulations at a time, and these may be enlarged into the right hand pane for closer inspection.
With multiple simulations connected to the PSE the quantity of data being received is the same, regardless of how it is visualised. It is just the quality of the rendering process to get the final images which can make a difference to the time and memory used.
6 CONCLUSIONS
Fig. 2.MultiDisplay visualising many output streams
running multiple simulations run through one large MPI job it is possible to have concurrent calculation of different cases, with the same set of steerable inputs, for example. Steering has been shown to be possible on both individual cases and sets of cases up to a ‘steer all’ capacity.
The output visualisations for these cases have been shown to be possible in a highly detailed manner, through the use of the visualisation environments processing power on individual cases, or in a group processing fashion to render the simultaneous cases all in the same window.
The use of the PSE has enabled two forms of steering to the skin scientist user. Firstly, the ability of the scientist to ask “What if...?” questions on individual cases has been seen to be very beneficial in getting quick answers to individual questions. Through the use of multiple concurrent simulations it has been possible to get more general answers over a wider range of cases than had been possible with just the single run.
geome-Mathematical Modelling of Diffusion through Skin using Grid-based PSEs 9
tries we have considered here the obvious first step would be to give the user the option of only retrieving the surface mesh. This would reduce the neces-sary transmission time from the simulation to the PSE, and also reduce the amount of work necessary locally to render the final image. By retaining the full dataset at the simulation end it would be possible to examine the data of an individual simulation in greater depth than would normally be done for multiple simulations. Another potential idea would be to actually do far more of the visualisation work remotely, hence reducing the local load even further. This could be done by using products such as the Grid-enabled version of IRIS Explorer discussed by Brodlie et al. [2] to put the visualisation process closer to the simulation than to the desktop, hence removing the need to the data to reach the local machine before the final rendering.
ACKNOWLEDGEMENTS
This work is funded through the EPSRC grant GR/S04871 and builds on the “gViz Grid Middleware” UK e-Science project. We also acknowledge Annette Bunge of the Colorado School of Mines for her collaboration and expertise.
References
1. Aslanidi, O.V., Brodlie, K.W., Clayton, R.H., Handley, J.W., Holden, A.V. and Wood, J.D., ‘Remote visualization and computational steering of cardiac virtual tissues using gViz’ In: Cox, S and Walker D. W., ed.: Proceedings of the 4th UK e-Science All Hands Meeting (AHM’05) EPSRC (2005).
2. Brodlie, K., Duce, D., Gallop, J., Sagar, M., Walton, J. and Wood, J. ‘Visual-ization in Grid Computing Environments.’ IEEE Visual‘Visual-ization (2004)
3. Brodlie, K.W., Mason, S., Thompson, M., Walkley, M.A., Wood, J.W.: ‘React-ing to a crisis: benefits of collaborative visualization and computational steer‘React-ing in a Grid environment’. In: Proceedings of the All Hands Meeting 2002. (2002) 4. Brooke, J.M., Coveney, P.V., Harting, J., Jha, S., Pickles, S.M., Pinning, R.L., Porter, A.R.: Computational steering in RealityGrid. In: Cox, S., ed.: Proceed-ings of the All Hands Meeting 2003, EPSRC (2003) 885–888.
5. Cussler E.L., Hughes S.E., Ward III, W.J. and Rutherford A. ‘Barrier Mem-branes’. Journal of Membrane Science, 38:161-174. (1988)
6. van Engelen, R.A. and Gallivan, K.A., ‘The gSOAP Toolkit for Web Services and Peer-To-Peer Computing Networks’. In: Proceedings of IEEE CCGrid. (2002)
7. Foster, I. and Kesselman, C.: Globus: A metacomputing infrastructure toolkit. International Journal of Supercomputer Applications11(1997) 115–128 8. Foster, I. and Kesselman, C.: ‘The Grid 2 : The Blueprint for a new computing
infrastructure.’ Elsevier (2004)
10. Goodyer, C.E. and Berzins, M. ‘Solving Computationally Intensive Engineer-ing Problems on the Grid usEngineer-ing Problem SolvEngineer-ing Environments.’ In: Cuhna, J.C. and Rana, O.F., ed.,Grid Computing: Software Environments and Tools. Springer Verlag (2006)
11. Goodyer, C.E., Berzins, M., Jimack, P.K., Scales, L.E.: A Grid-enabled Problem Solving Environment for Parallel Computational Engineering Design Advances in Engineering Software, 37(7):439–449 (2006)
12. Goodyer C.E. and Bunge A. ‘What If...? Mathematical Experiments on Skin’, In: Proceedings of the Perspectives in Percutaneous Penetration, La Grande Motte, France (2004)
13. Heisig M., Lieckfeldt R., Wittum G., Mazurkevich G. and Lee G. ‘Non steady-state descriptions of drug permeation through stratum corneum. I. the biphasic brick-and-mortar model.’ Pharmaceutical Research, Vol 13(3), 421–426, (1996). 14. Johnson M.E., Blankschtein D. and Langer R. ‘Evaluation of solute permeation through the stratum corneum: Lateral bilayer diffusion as the primary transport mechanism’. Journal of Pharmaceutical Sciences, 86:1162-1172. (1997) 15. Message Passing Interface Forum: MPI: A message-passing interface standard.
International Journal of Supercomputer Applications8(1994)
16. Parker, S.G., Johnson, C.R.: SCIRun: A scientific programming environment for computational steering. In: Meuer, H.W., ed.: Proceedings of Supercomputer ’95, New York, Springer-Verlag (1995)
17. Sch¨oberl J. ‘Netgen mesh generation package, version 4.4.’ http://www.hpfem.jku.at/netgen/, (2004).
18. Upson, C., Faulhaber, T., Kamins, D., Laidlaw, D,. Schlegel, D., Vroom, J., Gurwitz, R. and van Dam, A. ‘The application visualization system: A compu-tational environment for scientific visualization.’ IEEE Computer Graphics and Applications, 9(4):30–42, (1989).
19. Walkley M.A., Jimack P.K. and Berzins M. ‘Anisotropic adaptivity for finite element solutions of 3-d convection-dominated problems.’International Journal of Numerical Methods in Fluids, Vol 40, 551–559, (2002).
20. Walkley, M.A., Wood, J., Brodlie, K.W.: A distributed collaborative problem solving environment. In: Sloot, P.M.A., Tan, C.J.K., Dongarra, J.J., Hoekstra, A.G., eds.: Computational Science, ICCS 2002 Part I, Lecture Notes in Com-puter Science. Volume 2329., Springer (2002) 853–861
21. Walton, J.P.R.B.: Now you see it – interactive visualisation of large datasets. In: Brebbia, C.A., Power, H., eds.: Applications of Supercomputers in Engineering III. Computational Mechanics Publications / Elsevier Applied Science (1993) 22. Wood, J.W., Brodlie, K.W., Walton, J.P.R.: gViz: Visualization and