Il- à^
ISSN 1017-6004
eurostat
EXTERNAL TRADE
Monthly statistics
D 1994
k-W
eurostat
OFICINA ESTADÍSTICA DE LAS COMUNIDADES EUROPEAS
DE EUROPÆISKE FÆLLESSKABERS STATISTISKE KONTOR
STATISTISCHES AMT DER EUROPÄISCHEN GEMEINSCHAFTEN
ΣΤΑΤΙΣΤΙΚΗ ΥΠΗΡΕΣΙΑ ΤΩΝ
ΕΥΡΩΠΑΪΚΩΝ ΚΟΙΝΟΤΗΤΩΝ
STATISTICAL OFFICE OF THE EUROPEAN COMMUNITIES
OFFICE STATISTIQUE DES
COMMUNAUTÉS EUROPÉENNES
ISTITUTO STATISTICO DELLE COMUNITÀ EUROPEE
BUREAU VOOR DE STATISTIEK DER EUROPESE GEMEENSCHAPPEN
SERVIÇO DE ESTATÍSTICA DAS COMUNIDADES EUROPEIAS
L2920 Luxembourg Tél. 43 011 Télex COMEUR LU 3423
B1049 Bruxelles, rue de la Loi 200 Tél. 299 11 11
Las publicaciones de Eurostat están clasificadas por temas y por series. La clasificación se encuentra al final de
la obra. Para mayor información sobre las publicaciones, rogamos se pongan en contacto con Eurostat.
Para los pedidos, diríjanse a las oficinas de venta cuyas direcciones figuran en la página interior de la
contracubierta.
Eurostats publikationer er klassificeret efter emne og serie. En oversigt herover findes bag i hæftet. Yderligere
oplysninger om publikationerne kan fås ved henvendelse til Eurostat.
Bestilling kan afgives til de salgssteder, der er anført på omslagets side 3.
Die Veröffentlichungen von Eurostat sind nach Themenkreisen und Reihen gegliedert. Die Gliederung ist hinten in
jedem Band aufgeführt. Genauere Auskünfte über die Veröffentlichungen erteilt Eurostat.
Ihre Bestellungen richten Sie bitte an die Verkaufsbüros, deren Anschriften jeweils auf der dritten Umschlagseite
der Veröffentlichungen zu finden sind.
Οι
εκδόσεις της Eurostat ταξινομούνται κατά θέμα και κατά σειρά. Η ακριβής ταξινόμηση αναφέρεται στο
τέλος κάθε έκδοσης. Για λεπτομερέστερες πληροφορίες σχετικά με τις εκδόσεις, μπορείτε να
απευθύ-νεσθε στην Eurostat.
Για τις παραγγελίες μπορείτε να απευθύνεσθε στα γραφεία πώλησης, των οποίων οι διευθύνσεις
αναγράφονται στη σελίδα 3 TOU εξωφύλλου.
Eurostat's publications are classified according to themes and series. This classification is indicated at the end of
the publication. For more detailed information on publications, contact Eurostat.
Orders are obtainable from the sales offices mentioned on the inside back cover.
Les publications d'Eurostat sont
classées par thème et par série. Cette classification est précisée à la fin
de l'ouvrage. Pour des informations plus détaillées sur les publications, contactez Eurostat.
Pour les commandes, adressez-vous aux bureaux de vente dont les adresses sont indiquées à la page 3
de la couverture.
Le pubblicazioni dell'Eurostat sono classificate per tema e per serie. Tale classificazione è precisata alla fine
dell'opera. Per informazioni più dettagliate sulle pubblicazioni rivolgersi all'Eurostat.
Per eventuali ordinazioni rivolgersi a uno degli uffici di vendita i cui indirizzi figurano nella 3
apagina della
copertina.
De publikaties van Eurostat zijn ingedeeld naar onderwerp en serie. Deze indeling is achter in het boek
opgenomen. Voor nadere informatie over de publikaties kunt u sich wenden tot Eurostat.
EXTERNAL TRADE
Monthly statistics
Luxembourg: Office for Officiai Publications of the European Communities, 1994
Contents
Preface IV
Abbreviations
IX
Trends in European Union trade XI
Analysis of the preceding month
Table OA: Results of seasonal adjustment XII
Table OB: Global trends XIV
Trends in indices
Table OE: Indices of value, volume and unit value XVIII
Table OF: Cover rate, volumes ratio and terms of trade XX
Table OG: Development of indices of European Union trade XXII
World trade 1
Table 1A: Trends in world trade 3
Table IB: Comparison of trade patterns of EU, the USA, Japan and EFTA 6
Table 1C: Trends in the trade of the most important third countries 8
Table ID: Main trading partners of third countries 12
Table IE: Main trading partners of the EU 14
Trading partners 15
Table 2A: Development in EU trade 16
with the rest of the world, the USA, Japan and EFTA 17
Table 2B: Trends in the trade of goods with main trading partners - annual data 18
Table 2C: Trends in the trade of goods with main trading partners - monthly data 19
Table 2D: Pattern of trade with main trading partners, by product 24
Products traded 29
Table 3A: Main products traded - annual data 30
Table 3B: Main products traded - monthly data 31
Table 3C: Geographical pattern of trade, by main products 34
Table 3D: Trade in agricultural products (main categories of product) 42
Table 3E: EU trade in petroleum and petroleum derivatives 58
Member States' external trade 67
Table 4A: Trends in the EU's external trade, by Member State 69
Table 4B: Trends in Member States' trade, by geographical zone 70
Table 4C: Geographical pattern of trade of Member States 78
Table 4D: Pattern of trade of Member States by product 86
EU trade by mode of transport 95
Table 5: EU trade by mode of transport 96
Annexes
99
Table 6: Conversion rates 100
Standard International Trade Classification (SITC, Rev. 3) 101
Foreword
1. Introduction
The monthly bulletin on external trade, published by Eurostat in the Β series, Short-term trends, sets out to provide
within the shortest possible deadlines data on short-term trends in the European Union's external trade. In particular,
it contains data on the European Union's trade flows with its trading partners and the various economic areas and a
breakdown of this data by major product group. The bulletin also provides an overview, based on data from various
international sources, of the place occupied by the European Union in the external trade of its main trading partners
and of third countries. Trade flows between Member States are recorded under the Intrastat system and will be
published at a later date.
The European Union's external trade statistics at the most detailed classification level are published monthly on
CD-ROM (B series: Intra and extra-EU trade).
Trends in external trade since 1958 and a comparison with world trade are contained in the publication
"External
Trade Statistical Yearbook
(Series A)".
External trade statistics are also available on line via the Eurostat data banks (Comext).
The catalogue of Eurostat publications and a detailed methodological description can be found in
"External Trade
Statistics User's Guide"
published in all languages of the European Union .
2. Sources
Since 1978, the Member States have transmitted European Union external trade statistics according to a uniform
methodology laid down by Council Regulation (EEC) No 1736/75. This regulation was amended to take account of
the new developments in 1988, i.e. the introduction of the new external trade classification entitled "Combined
Nomenclature" (CN) and the new "Single Administrative Document".
The tables in this bulletin are compiled by Eurostat from the detailed data transmitted on magnetic tape by the
Member States; these data are broken down according to the eight-digit subheadings of the Combined
Nomenclature.
Eurostat wishes to take this opportunity of thanking the relevant departments in the Member States for their
cooperation, which enables it to compile these harmonized European Union statistics and to ensure their quality.
3. Coverage
The results of the European Union statistics relate to special trade. This comprises:
1 ) imports of goods placed in free circulation on their arrival at or on leaving warehouses, imports for inward
processing and imports after outward processing (customs procedures);
2) exports of European Union goods, exports after inward processing and exports for outward processing (customs
procedures).
Transit and warehousing traffic are not covered by European Union statistics.
4. Statistical territory
The statistical territory of the European Union comprises the customs territory of the European Union excluding the
French overseas departments. Thus Greenland, the Canary Islands and Ceuta and Melilla are not covered, while the
Azores and Madeira for Portugal and the Balearics for Spain are.
5. Goods classification
In this publication the results are broken down by the sections and divisions of the UN Standard International Trade
Classification (SITC Rev. 3 since 1988) by means of correspondence tables drawn up by Eurostat on the basis of the
Combined Nomenclature (CN).
6. Trading partners: countries and economic areas
The results of the European Union are broken down by country of origin, country of consigment and country of
destination in accordance with the "Country nomenclature for statistics on European Union external trade and trade
between its Member States", referred to as the Geonomenclature (Geonom).
When goods that originate in third countries and are not in free circulation in the European Union are imported, EU
statistics state the country of origin. When such goods are exported, the country of destination is specified.
7.
Units
Values
The statistical value of goods on import is equal to the customs valuation or to a value determined by reference to the
concept of customs valuation (in the case, for example, of imports from other Member States). It is the CIF value
(cost, insurance, and freight).
The statistical value of goods on export is equal to their value at the place and time at which they leave the statistical
territory of the exporting Member State. It is the FOB value (free on board).
The value is expressed in European units of account (ecus). The ecu is a "basket" currency unit based on the market
exchange rates of a certain quantity of each European Union currency according to a weighting system involving the
five-year average of each Member State's gross national product and intra-EU trade balance. The rates used in this
bulletin are averages of daily rates. The bulletin contains a table showing the conversion rates used.
Quantity
The statistics give the net weight of the goods.
8. Confidentiality
Most Member States take measures to guarantee the confidentiality of certain flows of goods. The relevant
legislation, the procedures for implementing it and the range of goods subject to secrecy vary from one Member State
to another.
This confidentiality applies to the most detailed level of the classification used for collecting the data; it may therefore
refer to all or only part of a subheading of the Combined Nomenclature. Similarly, confidentiality may apply to
imports only or to exports only and to only some of the variables recorded (value, statistical procedure, quantities,
country, partner, etc.).
Measures are taken during collection and during processing by Eurostat to minimise the effect of these headings on
the results for the European Union as a whole; in particular, trade data on these headings are included at higher levels
of aggregation and in the totals.
9. Corrections
Every month the Member States send Eurostat a magnetic tape containing the results for the current month.
Indices
/.
Introduction
Changes over time in the value of trade are influenced by variations in prices and the quantities marketed. Indices are
used to measure these two effects. In general, a system of indices is chosen so that the product of the volume index and
the price index expresses the value index. Several systems of indices meeting this requirement may be regularly used.
The results obtained by using one system will generally be different from those obtained by using another. For
various reasons the Member States do not use a common system, and the level of breakdown of their indices by
product group and by partner area also varies. Eurostat has therefore devised its own external trade indices which
enable it to calculate, for each Member State, European Union indices on a strictly comparable basis. These indices
may be consulted on the Trend database developed by Eurostat.
2.
Sources of data
There are basically two ways of obtaining information on prices: conducting price surveys by directly approaching
importers and exporters and using data collected by the customs authorities. At present only customs data are
available in all the Member States. Eurostat therefore calculates indices of unit values (values divided by quantities)
and uses them as price variation indicators. The computing programs contain a system for automatically identifying
extreme unit values pointing to unlikely price movements.
3. Extreme values
To avoid a number of restrictions involved in using customs data, Eurostat decided to adopt two basic principles in
calculating unit value indices: using the most detailed data possible and always bearing in mind that the object of the
exercise is to break down variations in value into a "price" component and a "volume" component. Two rules are
applied in order to exclude unlikely price movements. The first is that, given the general level of inflation, the price of
a product should not be very different from its level a year ago. Any variation of five or more points is regarded as
suspect. The second - more restrictive - rule is that the variation in the price of a product in relation to the most recent
month for which data are available should not be very different from the average price variation for similar products.
Applying these rules prevents extreme variations due to factors that are unconnected with prices and would otherwise
distort the unit value index. For products whose unit values are rejected, the variations are taken to be the same as
those for similar products.
4. Classification used
The United Nations Standard International Trade Classification (SITC), revised for the third time in 1988, was drawn
up on the basis of the Harmonized Commodity Description and Coding System (HS). Using tables of corcespondence
between the various classifications (Nimexe, Combined Nomenclature and SITC), Eurostat has been able to publish
an uninterrupted time series of external trade indices from 1979 to the present.
From 1994 onwards, external trade publications will give indices calculated from 1989 on the basis of the following
SITC Rev. 3 aggregates:
TOTAL: all commodities;
0+1 : foods, beverages and tobacco;
2+4: crude materials, except fuels;
3: fuels
5+6+7+8: manufactured goods.
By compiling other correspondence tables, Eurostat is able to supply complete time series based on other
classifications.
5.
Types of indices and rebasing
Eurostat calculates Fisher's "ideal" annual chain indices. Since the "basket of goods" marketed at international level
varies rapidly over time, the annual chain permits the updating of the index weightings. Each month the changes in
unit values in the product groups at detailed level are weighted in order to obtain the changes in unit values in the
various major product categories. Since these changes are based on the previous year, a chain of unit values is
obtained. The corresponding volume index chain is the ratio of the unit value variation to the variation in value for the
month in question compared with the monthly average for the previous year. The indices published each month are
calculated by multiplying the above-mentioned chains by the annual indices for the previous year, a fixed reference
period having been chosen (at present 1990). The annual unit value chains are obtained by weighting the monthly
chains by the volumes, while the annual volume chains are calculated by dividing the annual value variations by the
unit value chains.
6. General comments
- Only data on normal trade (statistical procedure 1 ) are used to calculate the unit value indices; however, data on
total trade (covering all the statistical procedures) are used to calculate the value indices from which the volume
indices are obtained.
The unit value indices are calculated on the basis of values expressed in ecus.
Symbols and abbreviations used
EU: Total of the EU member States
UEBL: Belgo-Luxembourg Economic Union (BLEU)
DK: Denmark
D: Federal Republic of Germany
GR: Greece
E: Spain
F: France
IRL: Ireland
I: Italy
NL: Netherlands
P: Portugal
UK: United Kingdom
USA: United States of America
0: Data less than half the unit used
Mio: Million
Mrd: 1000 millions
ECU: European currency unit
Eurostat: Statistical Office of the European Communities
SITC: Standard International Trade Classification
Data sources
European Union
B:
DK:
D:
GR:
E:
F:
IRL:
I:
NL:
P:
UK:
Belgique / Luxembourg
Danmark
Deutschland
Ελλάδα
España
France
Ireland
Italia
Nederland
Portugal
United Kingdom
Institut national de statistiques, Bruxelles
Danmarks Statistik, København
Statistisches Bundesamt, Wiesbaden
Εθνική Στατιστική Υπηρεσία Ελλάδας, Αθήνα
Dirección General de Aduanas e Impuestos Especiales, Madrid
Direction générale des douanes et droits indirects, Paris
Central Statistics Office, Dublin
Istituto centrale di statistica, Roma
Centraal Bureau voor de statistiek, Heerlen
Instituto Nacional de Estatistica, Lisboa
HM Customs and Excise, Statistical Office, Southend-on-Sea
Other countries
International Monetary Fund, Direction of Trade
Commentary and graphs
The commentary refers to the state of the COMEXT database on 07.10.1994
Available data in this issue
February 1994
March 1994
April 1994
May 1994
June 1994
EU
X
UEBL
X
X
DK
X
X
X
D
X
X
X
X
GR
Χ
Χ
Χ
Ε
Χ
Χ
Χ
Χ
Χ
F
Χ
IRL
Χ
Χ
Ι
Χ
Χ
Χ
Χ
Χ
NL
Χ
Χ
Χ
Χ
Ρ
χ
χ
χ
χ
χ
υκ
χ
χ
χ
χ
SEASONAL ADJUSTMENTS: RESULTS
In the absence of data on extra-Community
trade for France and the BLEU, it was not
possible to calculate the results for the
European Union for March 1994. The series
published are therefore identical to those
from the previous edition of the monthly
bulletin.
The virtually constant rise recorded since the
beginning of 1993 in European Union
exports to the rest of the world, adjusted for
seasonal variations, seems set to continue in
early 1994. The rate for the first two months
of 1994 was 18.3% up on that of the same
period of 1993.
In spite of the marked instability observed
since early 1993, seasonally-adjusted
imports into the European Union from the
rest of the world showed an upward trend in
the second half of 1993. This continued into
1994, particularly in January 1994 compared
with January 1993 (+14.8%). There is still
some uncertainty about whether this
increase will last, as shown by the result for
February 1994 (2.7% down on January
1994).
As a result of the improvement observed
since the third quarter of 1991, the Union's
seasonally-adjusted balance of trade for the
first two months of 1994 was in equilibrium at
ECU +0.1 bn, despite a slight deficit in
January.
Exports
Mrd. ECU
Imports
Mrd. ECU
1986 1907 1988 1989 1990 1991 1992 1993 1994
j i_
1987 1988 1989 1990 1991 1992 1993 1994
Trade Balance
Mrd. ECU
TABLE OA - EUR 12 EXPORTS, IMPORTS, TRADE BALANCE
Period
Jan-91 Feb-91 Mar-91 Apr-91 May-91 Jun-91 Jul-91 Aug-91 Sep-91 Oct-91 Nov-91 Dec-91 Jan-92 Feb-92 Mar-92 Apr-92 May-92 Jun-92 Jul-92 Aug-92
Sep-92
Oct-92 Nov-92 Dec-92 Jan-93 Feb-93 Mar-93 Apr-93 May-93 Jun-93 Jul-93 Aug-93 Sep-93 Oct-93 Nov-93 Dec-93 Jan-94 Feb-94
Seasonally Adjusted Series (1) ■
Exports Not Adjusted
32,6 31,7 34,4 34,5 34,4 34,7 38,6 32,1 34,3 40,0 37,5
38,4
32,7
34,2
38,3 37,1 34,0 35,9 39,4 30,1 35,7 39,8 36,6 40,9 31,1 35,1
40,4
38,7 37,7 42,4 41,9 35,3 40,7 44,2 44,1
48,6
37,5 40,5
Seasonally Adjusted
34,8 33,8 34,4 34,2 34,1 34,9 36,2 36,5
36,1
35,5 36,9 35,6 35,6 36,3
36,5
37,2
36,0 35,3
36,8 35,7 36,2 36,9 36,0 36,4 35,9
37,7 37,5
39,2 40,1 40,6 40,2 40,4 41,0 41,7 42,3 43,6 43,7 43,4
- Bio. ECU
Imports Not Adjusted
43,0
37,3
39,2 43,3 42,3 40,4 43,9
37,0
41,6 44,5 42,2
38,3
41,4 39,8 44,0 42,5 40,0 40,6 42,0
33,3 39,8
41,4 39,4 40,5 36,4
39,6
43,4 40,8
37,8
41,1
39,8
37,9 41,9 41,2 42,5 41,6 41,9 41,4
Seasonally Adjusted
41,8 39,4 39,5 40,6 40,7 42,0 42,1
41,8
42,3 40,4 42,3 40,0 40,8 41,6 41,2 41,3 41,5 39,4 40,6 39,2 39,0 39,7 39,5 40,8 38,4 41,3 39,4 39,4 39,0 39,8
39,5
42,3 41,0 40,9 40,8 42,1 44,1 42,9
Trade Balance Not Adjusted
-10,4 -5,6 -4,8 -8,8 -7,9 -5,7 -5,3 -4,9 -7,3 -4,5 -4,7 0,1 -8,7 -5,6 -5,7 -5,4 -6,0 -4,7 -2,6 -3,2 -4,1 -1,6 -2,8 0,4 -5,3 -4,5 -3,0 -2,1 -0,1 1,3 2,1 -2,6 -1,2 2,9 1,6
6,9
-A3 -0,8
Seasonally Adjusted
-7,0 -5,6 -5,2 -6,4 -6,6 -7,0 -5,9 -5,3 -6,2 -4,9 -5,4 -4,5 -5,2 -5,3 -4,8 -4,0 -5,5 -4,1 -3,9 -3,5 -2,8 -2,8 -3,5 -4,4 -2,5 -3,6 -1,8 -0,2 1,1
0,8 0,7
-1,9 -0,0
0,8
1,5 1,5 -0,4 0,5 (1) Seasonal Adjustment via X11/ARIMA procedure.
GLOBAL TRENDS IN EXTERNAL TRADE
EXTERNAL TRADE OF THE EUROPEAN UNION:Results for March 1994 (*).
The gap between the rates of change between exports and imports during the first three months
of 1994 was +2.5 points for the European Union, -4.3 points for the United States and -0.2 points
for Japan
The external trade deficit of the
European Union
(EU) (France excluded) went down from ECU 9.3
billion to ECU 7.6 billion between the two first quarters
of 1993 and 1994. This improvement of the extra-EU's
trade balance is mainly due to the increase of the
exports (14.4%); EU imports grew somewhat less
(11.9%).
The trade deficit of the
United States
went up from
ECU 21.8 billion in the first quarter of 1993 to ECU
29.6 billion in the same period of 1994. While US
imports increased by 16.1%, exports rose 11.8%
(both in ECU). In US dollar terms, the difference
between the percentage increase of both imports and
exports was 4 . 1 % on the import side.
The
Japanese
external trade surplus went up ECU
3.1 billion to ECU 27.9 billion between the two first
quarters of 1993 and 1994. Both imports and exports
increased roughly by the same amount in ECU
(12.8% and 12.6% respectively) and US dollars (6.6%
and 6.4% respectively). In terms of Yen, Japan's
imports went down 5.8%, while exports decreased by
6.3%.
(*) These figures should be regarded with caution, due to the introduction of the INTRASTAT
system in the
beginning of 1993. France was not included, due to the lack of data for March 1994.
GR.OB I- IMPORTS AND EXPORTS (CIF, FOB)
(Annual % change)
10-
•10-Ji
30
20
10
92
93 93 94 93 94
01-03
03
EUR12
■10
•20
30
20-1
10
■10-92
93 93 94 93 94
01-03
03
-20
92
93 93 94 93 94
01-03
03
USA
l!l
Imports
D
JAPAN
TABLE OB I - TRADE BALANCE, IMPORTS AND EXPORTS (1)
COUNTRIES
EUR-12 United Stales " Japan
BLEU Danmark Germany Greece Spain France Ireland Italy Netherlands Portugal United Kingdom
EUR-12 United States " Japan
BLEU Denmark Germany Greece Spain France Ireland Italy Netherlands Portugal United Kingdom
EUR-12 United States " Japan
BLEU Denmark Germany Greece Spain France Ireland Italy Netherlands Portugal United Kingdom
Memorandum Item 1USD = ...ECU 1 YEN = ...ECU (1) External Trade Statie (2)Bn=1000.000.000 ' Estimate.
" CIF component estima : Not available.
1992
-52,0 -80,9 82,2
-5,3
2,2
8,8
-4,1 -11,8
3,2
0,9
-1,5 -20,9 -2,7 -20,3
-1,3
4,2
-5,8
-4,8 -1,9 -0,1 -2,9
1,2
-4,5 -9,3 -4,1
3,1
3,6
0,0
2,9
1,5
3,2
2,2
5,7
1,6
2,5
6,5
5,7
13,0
4,0
4,1
9,3
-0,3
-4,5
1,4
1993
-3,4 -118,9 101,8
-0,6
2,6
20,1 -4,3 -4,8
5,4
1,2
11,0 -13,0 -2,6 -18,4
1993
IV
1994
I
1993 01-03
1994 01-03 TRADE BALANCE (Bn ECU) (2) 10,8
-32,7 26,7
0,3
0,7
8,2
-1,3 -0,8
4,1
0,5
5,1
-2,8 -0,8 -2,5
-29,6 27,9
-0,1
0,4
3,2
-0,8 -0,7
0,0
2,3
-4,8 -0,6 -6,5
-12,6 -21,8 24,8
-0,8
0,6
4,1
-0,8 -1,6 -3,3
0,0
-0,3 -3,9 -0,6 -ΐ,Ο IMPORTS
-29,6 27,9
-0,1
0,4
3,2
-0,8 -0,7
0,0
2,3
-4,8 -0,6 -6,5
1993
03
-3,0 -9,1
8,4
-0,1
0,3
1,9
-0,4 -0,5 -0,6
0,0
0,0
-1,4 -0,2 -1,9
%
change on the corresponding period of the previous year
-0,3
20,7 14,0
-0,5 -0,8
0,0
11,8 -14,5 -2,3 37,0 -5,0 -6,3 -5,2
9,6
4,2
20,6 16,2
15,2
5,5
2,0
11,8 -7,0 -4,5 43,6 -1,1
3,0
24,2 15,2
16,1 12,8
19,7 17,7 10,0
9,5
9,9
22,6
2,6
18,5
8,2
17,2
-4,8 16,3
5,8
-8,3 -7,0 -6,0 -8,0 -22,6 -3,6 41,3 -7,4 -5,2 -5.6
4,2
EXPORTS
16,1 12,8
19,7 17,7 10,0
9,5
9,9
22,6
2,6
18,5
8,2
17,2
-1,4 22,1 13,2
-4,0 -7,0 -2,8 50,4 -17,8 -7,0 33,5 -4,9
0,7
2,3
10,3
% change on the corresponding period of the previous year 10,8
14,6 17,1
19,7
1,9
7,4
23,6 15,3
0,9
37,1 16,5 19,1 -5,8 15,9
17,0 17,5 16,8
23,1 -2,9 12,4 23,1 19,4
Ψ
56,6 25,3 31,7 29,2 28,811,8 12,6
33,2 10,2
6,7
28,5 33,6
26,1 20,4 14,8
8,5
20,4
1,3
8,6
10,4
12,1
0,8
3,7
-5,4
0,5
-16,5 19,9
4,6
8,9
-ΐ,5
4,7
11,8 12,6
33,2 10,2
6,7
28,5 33,6
26,1 20,4 14,8
8,5
20,4
5,4
10,1 19,1
23,4
7,5
4,5
51,1 13,0 -16,3 28,2
5,5
18,9 13,6 15,7
% change on the corresponding period of the previous year 10,9
26,2
11,1 26,2 ics excluding intra flows (Imports CIF, Exports FOB).
ted.
5,8
18,9
6,1
12,8
5,8
18,9
4,4
18,6
1994
03
-9,6
8,7
-0,3
0,1
0,9
-0,3 -0,1
0,1
1,2
-1,8 -0,2 -1,9
11,2
9,5
21,0 21,1 15,9 -17,6
8,3
15,3
4,5
20,7 -2,8 11,5
12,8
7,7
18,0
6,0
6,4
-14,6 35,1
27,3 27,4 19,8 -1,3 14,9
3,2
14,9
GLOBAL TRENDS IN EXTERNAL TRADE
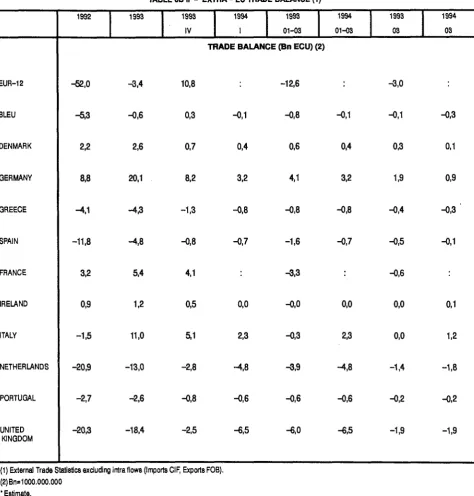
EXTERNAL TRADE BY EU MEMBER STATES: Results for March 1994 (*).
Germany and Italy have registered the largest surpluses among the EU countries during the first
three months of 1994 (ECU 3.2 billion and ECU 2.3 billion respectively), while the United Kingdom
and the Netherlands recorded the biggest deficits (ECU 6.5 billion and ECU 4.8 billion respectively).
The two EU countries with the most significant sur
pluses in the first three months of 1994 were Germany
and Italy.
Germany
decreased its extraEU trade
surplus from ECU 4.1 billion to ECU 3.2 billion be
tween the two first quarters of 1993 and 1994. While
imports increased by 10%, exports rose 6.7%.
Italy
registered also an important surplus in the first three
months of 1994 (ECU 2.3 billion, when for the same
period of 1993 it showed a deficit of ECU 0.3 billion).
This improvement is mainly due to the increase of
Italian extraEU exports (20.4%); imports increased
only by 2.6% between these two periods.
Denmark's
trade surplus went down ECU 0.2 billion
to ECU 0.4 billion between the first three months of
1993 and 1994. ExtraEU imports increased by
17.7%, while exports rose 10.2%.
Ireland's
trade was
balanced in the period JanuaryMarch 1994. Both
imports and exports increased strongly between the
two first quarters of 1993 and 1994 (22.6% and 26.1 %
respectively).
Both
Portugal
and
Greece
registered the same trade
deficits in the first quarter of 1994 and in the same
period of 1993 (ECU 0.6 billion and ECU 0.8 billion
respectively). While Portugal recorded a similar in
crease of both imports and exports between these two
periods (8.2% and 8.5% respectively), Greece regis
tered an increase of its exports of 28.5%, while im
ports went up 9.5%.
Both the
BLEU
and
Spain
experienced significant
decreases of their deficits between the first three
months of 1993 and 1994 (from ECU 0.8 billion to
ECU 0.1 billion in the case of the BLEU, and from ECU
1.6 billion to ECU 0.7 billion for Spain). These two
countries experienced large increases of their extra
EU exports (33.2% for the BLEU, 33.6% for Spain).
BLEU's imports went up 19.7% between the first two
quarters of 1993 and 1994, while Spain's imports
increased by 9.9%.
The two EU countries with the largest deficits in the
first quarter of 1994 were the
United Kingdom
(ECU
6.5 billion, up from ECU 6 billion in the same period
of 1993) and the
Netherlands
(ECU 4.8 billion, ECU
0.9 billion more than in the first quarter of 1993). While
for the Netherlands the increase of the imports was
slightly bigger than the rise of the exports (18.5% and
14.8%), for the United Kingdom it was the opposite
(3.2 percentage points on behalf of the exports).
(*) France has not been taken into account as no figures for March 1994 are available.
GR.0B II MEMBER STATE'S EXTRATRADE BALANCE
(BN ECU)
6 ι
BL
DK
D
GR
E
F
IRL
I
NL
Ρ
UK
EUR-12
BLEU
DENMARK
GERMANY
GREECE
SPAIN
FRANCE
IRELAND
ITALY
NETHERLANDS
PORTUGAL
UNITED
KINGDOM
1992
-52,0
-5,3
2,2
8,8
-4,1
-11,8
3,2
0,9
-1,5
-20,9
-2,7
[image:19.595.63.538.33.530.2]-20,3
TABLE OB II - EXTRA - EU TRADE BALANCE
(1)
1993
^3,4
-0,6
2,6
20,1
^ , 3
-4,8
5,4
1,2
11,0
-13,0
-2,6
-18,4
1993
IV
1994
I
1993
01-03
1994
01-03
TRADE BALANCE (Bn ECU) (2)
10,8
0,3
0,7
8,2
-1,3
-0,8
4,1
0,5
5,1
-2,8
-0,8
-2,5
-12,6
-0,1 -0,8
0,4 0,6
3,2 4,1
-0,8 -0,8
-0,7 -1,6
-3,3
0,0 -0,0
2,3 -0,3
•4,8 -3,9
-0,6 -0,6
-6,5
-6,0
-0,1
0,4
3,2
-0,8
-0,7
0,0
2,3
-4,8
-0,6
-6,5
1993
03
-3,0
-0,1
0,3
1,9
-0,4
-0,5
-0,6
0,0
0,0
-1,4
-0,2
-1,9
1994
03
-0,3
0,1
0,9
-0,3 '
-0,1
0,1
1,2
-1,8
-0,2
-1,9
(1) External Trade Statistics excluding intra flows (Imports CIF, Exports FOB).
(2) Bn=1000.000.000
* Estimate.
: Not available.
Ξ
INDICES
TRENDS IN EXTRA-EU TRADE
SITC Rev. 3
1990 = 100
Period
1990
1991
1992
1993
1992 Dec
1993 Jan
Feb
Mar
Apr
May
Jun
Jul
Aug
Sep
Oct
Nov
Dec
1990
1991
1992
1993
1992 Dec
1993 Jan
Feb
Mar
Apr
May
Jun
Jul
Aug
Sep
Oct
Nov
Dec
IMPORTS
0-9
100
107
106
104
105
94
102
117
105
97
105
102
98
106
106
109
107
100
107
107
101
105
92
99
113
101
95
103
98
93
102
102
105
103
0+1
100
107
108
107
116
93
98
123
107
97
104
105
95
105
110
124
125
100
104
108
103
117
91
95
118
104
97
106
103
92
100
105
117
117
2+4
100
92
90
85
85
71
87
99
86
79
92
82
69
86
83
90
93
100
98
100
95
96
81
99
112
99
92
106
92
76
94
91
100
104
3
100
103
93
89
100
89
82
99
92
87
86
89
96
83
91
90
91
100
110
110
108
117
107
97
113
106
101
101
106
115
104
113
114
121
5-8
EXPORTS
0-9
VALUE
100
110
112
114
109
102
114
129
115
105
116
111
107
119
117
120
116
100
102
104
115
118
87
101
121
111
108
122
121
102
116
127
126
139
VOLUME
100
107
107
103
102
93
103
116
104
96
106
99
95
106
104
106
102
100
100
100
106
112
81
93
111
102
100
113
111
93
107
117
116
128
0+1
100
103
111
126
116
102
115
139
122
115
128
114
114
137
140
141
151
100
105
111
123
117
99
113
135
117
110
122
112
111
134
139
137
145
2+4
100
105
108
123
110
109
114
143
122
113
119
113
111
131
134
129
142
100
107
113
128
116
114
118
147
127
117
124
118
115
136
142
135
145
3
100
95
95
122
108
90
109
122
119
128
129
119
117
122
147
121
132
100
95
103
132
114
97
117
126
124
132
137
124
125
134
166
138
154
5-8
100
102
105
120
121
89
105
125
116
112
127
128
105
119
131
131
146
100
99
100
108
114
81
95
113
105
102
116
Ξ
INDICES
TRENDS IN EXTRA-EU TRADE
SITC Rev. 3
1990 = 100
Period
1990
1991
1992
1993
1992 Dec
1993 Jan
Feb
Mar
Apr
May
Jun
Jul
Aug
Sep
Oct
Nov
Dec
IMPORTS
0-9
100
101
99
103
101
102
103
104
104
102
102
104
105
104
104
104
104
0+1
100
103
100
103
99
102
103
104
103
100
99
101
104
105
105
106
107
2+4
100
94
89
89
89
88
88
88
87
86
87
90
91
92
91
90
90
3
100
94
84
83
86
83
84
88
87
86
84
84
83
80
80
79
75
5-8
EXPORTS
0-9
UNIT VALUE
100
103
104
112
107
110
110
111
111
110
110
112
113
113
113
113
114
100
102
104
109
105
108
109
109
109
109
108
109
110
109
109
109
109
0+1
100
99
101
103
99
103
102
103
104
104
105
102
103
102
101
103
104
2+4
100
98
95
96
95
96
97
98
96
97
96
96
97
97
94
96
98
3
100
100
92
93
95
93
93
97
97
97
95
96
94
91
89
88
86
5-8
100
103
106
' 110
106
110
110
111
111
110
109
110
111
111
111
111
111
Ξ
INDICES
TRENDS IN EXTRA-EU TRADE ( ratios )
SITC Rev. 3
1990 = 100
Period
1990
1991
1992
1993
1992
1993
1990
1991
1992
1993
1992
1993
Dec
Jan
Feb
Mar
Apr
May
Jun
Jul
Aug
Sep
Oct
Nov
Dec
Dec
Jan
Feb
Mar
Apr
May
Jun
Jul
Aug
Sep
Oct
Nov
Dec
0-9
100
95
98
111
112
93
100
103
106
112
116
118
104
109
120
116
130
100
94
93
105
107
88
94
99
101
105
109
113
100
104
115
111
124
0+1
100
97
103
118
100
110
117
113
114
119
122
109
120
130
128
114
121
100
101
102
119
100
109
118
114
113
113
115
108
121
134
132
118
124
2+4
COVER RATE <
1>
100
114
121
146
129
154
130
145
142
143
128
137
160
154
162
144
152
3
100
92
102
137
108
101
133
123
130
148
151
134
123
147
162
135
145
l/OLUMES RATIO «)
100
109
113
135
121
141
118
131
129
128
118
129
151
145
155
134
140
100
87
93
123
98
91
121
112
117
131
135
117
108
129
147
122
127
5-8
100
92
94
105
111
88
92
97
101
107
110
116
99
100
113
110
126
100
93
93
106
112
87
92
98
101
107
110
117
100
102
114
112
130
Ξ
INDICES
TRENDS IN EXTRA-EU TRADE ( ratios
)
SITC Rev. 3
1990 = 100
Period
1990
1991
1992
1993
1992
1993
Dec
Jan
Feb
Mar
Apr
May
Jun
Jul
Aug
Sep
Oct
Nov
Dec
0-9
100
102
106
105
104
106
106
105
105
106
106
105
105
105
104
105
105
0+1
2+4
3
TERMS OF TRADE d)
100
96
101
100
100
101
99
99
101
105
106
101
99
97
97
97
98
100
104
107
108
107
109
110
111
110
112
109
106
106
106
104
107
109
100
107
109
112
111
112
110
110
111
113
112
115
113
114
110
111
114
5-8
100
100
101
99
99
100
100
99
100
100
100
98
99
98
98
98
97
{1 ) The indicator "terms of trade" is equal to the ratio of the unit value export index to the unit value import index.
Ξ
DEVELOPMENT OF INDICES OF EUROPEAN UNION TRADE
SITC Rev. 3
1990 = 100
Volume
Extra-EU Imports
Extra-EU Exports
1989 1990 1991 1992 1993
Unit Value
Extra-EU Imports
Extra-EU Exports
Exports / Imports
Terms of trade
Volume ratios
3
TRENDS IN WORLD TRADE
TRADE BALANCE
'alues in Mio ECU
Period
989 990
991 992
993
993
994 Feb
Mar Apr May Jun
Jul Aug Sep
Oct Nov Dec
Jan Feb
World (1) EU
-34 632 -46319
-69 330 -52019
-3 388
-3952
-2 846 -2 028 -116 1389
2159 -2 498 -790 3 078 1630 6 940
-4 326 -815
EFTA
-7 621 -3 467
386 6259
12 516
832 626 816
1654 1234
1735
19 777
1739 1354 319
1342 873
United States
-117 424 -97 908
-70 522 -81786
-118186
-6174
-8 338 -8 449 -6650 -11 544
-12 674
-11 966 -12 556 -12 277 -43 026 -5 962
-9 404 -10 541
Japan
58 387 40 958
62 775 82143
102 682
9 289
11625 8 764 6 653 B 372
10 396 6 614 10 641 9 393 6571 11470
5 448 9 761
Canada Hong
Kong China
VALUES
-8107 -3 364
-5112 -2 980
-6 527
-359
-696 -667 -114 -165
-673 -889 -811 -764 -1098 -829
. -423 -722
876 -263
-1368 -3 003
-2 918
-489
-662 -871 -599 -415
-92
-56 279
311 -109 -196
202
-746
-6174 8 952
6 529 1895
-10 421
-550
-573 -493 -1073 -360
-1001 -978 -614 -502 -527 •4 025
-806 -304
South Korea
260 -3 646
-9 415 -5101
-686
279
134 -1699 -1769 67
174 657 921 458 102
-Λ2
-222 -278
Switzer land
-6 067 -4 626
-4 023 -34
2 013
220
-10 2 337 192
174
-76 -21 518 430
-228
-173 83
Sweden
2 403 2 252
4 332 4 736
6154
542
478 543 527 555
1 144 -44 642 444 643 546
841 651
Singa -pore
-4 470 -6 441
-5 691 -6680
-9 651
-1092 -564
-649 -902 -916
-775 -885 -397 -1090 -607
-1001
-1433 -1385
Australia
-7239 -3209
-610 -1758
-3 666
-95
-689 -275
-88 -323
-292 -601 -232
-235 -558 -308
-357
-9
Ξ
TRENDS IN WORLD TRADE
IMPORTS
Values in Mio ECU
Period
1989
1990 1991 1992
1993
1993
1994
1989 1990 1991
1992 1993
Feb Mar Apr
May Jun
Jul Aug Sep Oct Nov
Dec
Jan
Feb
World (1)
2239479
2134 607 2 132 848
2178 666
100.0 100.0
100.0 100.0
0.0 EU
448 015
461 823 492 660
487 674 485 976
39 506 43 622 41020 37 891 41 142
39 900 37 900 41262 41103 42 491 41637
41825
41399
20.0 21.6
23.1 22.4
0.0 EFTA
177 642
180 586 174 325
168102 167 186
13 033 15179 14130 12 631 14191
12 700 12 857
14 590 14 707 14 992 15194
13 248
14 526 United States
447 475
406 469 410 717
426 393 515 075
36 797
44 640 40 473 39 226 44 140
43 872 44 419
44 817 47 714 78168 42 688
43 241 43 539
Japan
191 374
184413 191046
179 511 205525
14 958 18 003 16949 15 589 17 363
17 910 17 972
17 637 17 565 18 604 17 561
17 859 16 689
Canada Hong Kong
VALUES
117 095
102 677 106 926
105 781 127 010
9 627
11761 10 705 10 388 11 192
9 775 10 825
10747 11362 11779 10428
9 909 10 271
65486
64 793 80921
95 086 118 409
9 061
9 529 9 922 9 645 9 742
11 178 10 590
10 087 10 400 10 601 11017
9 340 9179
China
52 930
41475 51547
66 045 88 730
5 472
6 428 6137 6 993 6 220
7 692 7 712
8108 7414 8 445 15 996
5118 5 334
South Korea
54 649
54 866 67 799
62 710 72 022
5 404 6 278
6 404 5 964 6 261
6 377 6 003
6 000 6 261 4 793 6 946
6 517 6 540
Switzer land
52 858
54 732 53 677
50 630 51945
4 084 4 716 4 461 3 868 4 672
4 256 3 738 4 701 4 561 4518 4 897
4 326
4 583 Sweden
44 426
42 857 40180
38 418 36 424
2 757 3 334 2 974 2 849 3149
2167 3 007
3 221 3 420 3 322 3 255
2 990
3 281
PERCENTAGE SHARE OF WORLD TRADE (EXCLUDING INTRA-EU)
7.9 8.5
8.2 7.7
0.0
20.0 19.0
19.3 19.6 0.0
8.5 8.6
9.0 8.2 0.0
5.2 4.8 5.0
4.9 0.0
2.9 3.0 3.8 4.4
0.0
2.4
1.9 2.4
3.0 0.0
2.4 2.6
3.2 2.9 0.0
2.4 2.6
2.5 2.3 0.0
2.0 2.0
1.9 1.8 0.0
Singa -pore
45104
47 874 53 481
55 605 72 933
5 464
5 966 5 850 5 825 6139
6428 6 218 6402 6 529 6 409 6959
5 965 6 212
2.0 2.2
2.5 2.6 0.0
Australia
40876
33 813 34 402
34 531 39 994
2 810 3 729 3 087 3 041 3 247
3 522
3 722 3 272 3 536 3 843 3 610
3 341 3107
1.8 1.6 1.6
1.6 0.0
3
TRENDS IN WORLD TRADE
EXPORTS
'alues in Mio ECU
Period
989
990
991
992
993
993
I994 Feb
Mar
Apr
May
Jun
Jul
Aug
Sep
Oct
Nov
Dec
Jan
Feb
World (1)
2130488
2 018 857
2 060645
2107 392 EU
413 383
415 504
423 330
435 655
482 588
35 554
40 776
38 992
37 775
42 531
42 059
35 402
40 471
44180
44121
48 577
37 499
40 584 EFTA
170 021
177120
174 711
174 360
179 702
13 864
15 805
14 945
14 285
15426
14 435
12 876
15 367
16446
16345
15513
14 590
15 398 United States
330 051
308 561
340194
344 606
396 889
30 624
36302
32 024
32 576
32 596
31 198
32 453
32 261
35 437
35142
36 726
33 837
32 998 Japan
249 761
225 371
253 821
261 654
308207
24 247
29 628
25 713
22 242
25 734
28 306
24 586
28278
26 958
25175
29 031
23 307
26451
Canada Hong
Kong China
VALUES
108 987
99 314
101 813
102 802
120 483
9 268
11065
10 039
10 273
11027
9103
9 937
9 936
10 598
10 682
9 599
. 9 486
9 549
66 361
64 530
79 553
92 083
115 492
8 572
8 866
9 051
9 046
9 328
11086
10 533
10 366
10711
10492
10 821
9 543
8 433
46 756
50 427
58076
67 940
78 309
4 922
5 855
5 645
5 920
5 859
6 690
6 734
7 495
6 912
7 918
11971
4 312
5 030 South Korea
54 909
51221
58385
57 608
71336
5 683
6 412
4 705
4195
6 328
6 551
6 661
6 921
6719
4 895
6 904
6 295
6 263
Switzer-land
46 791
50107
49654
50596
53 958
4 305
4 706
4 463
4 205
4 864
4 430
3 662
4 680
5 079
4 948
4 669
4153
4 666 Sweden
46 829
45109
44 512
43155
42 578
3 300
3812
3 516
3 376
3 704
3 311
2 964
3 863
3 863
3 966
3 801
3 830
3 932
Singa-pore
40 634
41433
47 789 '
48 926
63 282
4 372
5 402
5 201
4 923
5 223
5 653
5 333
6 006
5 439
5 802
5 958
4 532
4 827 Australia
33 637
30 604
33792
32 773
36 328
2 715
3 040
2 812
2 953
2 925
3 230
3120
3 040
3 301
3285
3 302
2 984
3 098
1989
1990
1991
1992
1993
100.0
100.0
100.0
100.0
0.0
19.4
20.6
20.5
20.7
0.0
PERCENTAGE SHARE OF WORLD TRADE (EXCLUDING INTRA-EU)
8.0
8.8
8.5
8.3
0.0
15.5
15.3
16.5
16.4
0.0
11.7
11.2
12.3
12.4
0.0
5.1 3.1
4.9 3.2
4.9 3.9
4.9 4.4
0.0 0.0 2.2
2.5
2.8
3.2
0.0
2.6
2.5
2.8
2.7
0.0
2.2
2.5
2.4
2.4
0.0
2.2
2.2
2.2
2.0
0.0
1.9
2.1
2.3
2.3
0.0
1.6
1.5
1.6
1.6
0.0
Ξ
COMPARISON OF TRADE PATTERNS :
EU, UNITED STATES, JAPAN AND EFTA
1993
IMPORTS
Values in 1000 ECU
List of products
0 - Food
1 - Beverages and tobacco
2 - Crude materials
3 - Energy
4 - Oils
5 - Chemicals
6 - Manufactured goods
7 - Transport equipment
8 - Misc. manuf. articles
9 - Others
TOTAL
EU
Value
33 343 662
3 430 414
29 917 315
61 686 124
1 757 119
34 150 224
70 469 594
149 108 433
85 078 945
17 034 176
485 976 006
%
6,9
0,7
6,2
12,7
0,4
7,0
14,5
30,7
17,5
3,5
100,0
United States
Value
21 350 836
4 999 630
14 282 202
50 590 029
916 397
26 046 838
59 372 163
226 824 462
93 436 847
17 255 712
515 075 116
%
4,1
1,0
2,8
9,8
0,2
5,1
11,5
44,0
18,1
3,4
100,0
Japan
Value
30151 145
3 345 015
24 236 804
42 131 706
402 395
15 085 332
22 601 169
34 943 563
28 423 040
4 204 970
205 525 137
%
14,7
1,6
11,8
20,5
0,2
7,3
11,0
17,0
13,8
2,0
100,0
EFTA
Value
9 197 834
1 482 968
6 637 029
10 232 921
327 304
19 643 919
29 820 500
57 756 722
31 305 448
781 186
167 185 833
%
5,5
0,9
4,0
6,1
0,2
11,7
17,8
34,5
18,7
0,5
100,0
SITC Sections