A New Phytochemical Screening Programme
used for Crops grown with Organic and
Conventional Methods
Screening process
Sample preparation ↓
Application on stationary phase ↓
Development in mobile phase ↓
Derivatization with chemical reagent ↓
Detection of phytochemical differences ↓
Evaluation and documentation of phytochemical differences
Helle Weber Ravn1, Charlotte V. Kristensen1, Trine F. Christensen1, Brigitte Diedrichsen1 & Kirsten Brandt2
Resumé
Et bredt screeningsprogram, til detektion af de mest generelle fytokemiske stoffer, blev
udarbejdet ved hjælp af tyndtlagskromatografi (TLC). I alt blev 46 TLC systemer, bestående af 26 derivatiseringsreagenser, 3 stationære faser og 4 mobile faser, medtaget i
screeningsprogrammet. TLC systemerne blev inddelt i grupper alt efter hvilke fytokemiske stoffer, de detekterede: alkoholer og fenoler, sukkerstoffer, N-holdige stoffer, organiske syrer og lipider, P-holdige stoffer, S-holdige stoffer og terpenoider. En sidste gruppe af TLC systemer detekterede stoffer fra flere af de ovennævnte grupper.
Kartofler (S. tuberosum L.), ærter (P. sativum L.), grønkål (B. oleracea L.), gulerødder (D. carota L.) og æbler (M. domestica Borkh.) dyrket med kombinationer af økologiske og
konventionelle metoder til plantebeskyttelse og næringstilførsel, blev screenet for fytokemiske forskelle (biomarkører) ved hjælp af det udarbejdede screeningsprogram.
Karakteristiske fytokemiske forskelle blev fundet mellem afgrøder dyrket med forskellige metoder. I prøver fra ærter og gulerod blev der fundet én biomarkør. I ærter kunne biomarkøren relateres til jordbehandlingen, mens biomarkøren i gulerødder kunne relateres til brug af
sprøjtemidler. I kartoffel blev der fundet to biomarkører relateret til brugen af sprøjtemidler. Tre biomarkører blev fundet i grønkål. To af disse kunne relateres til brugen af pesticider, mens den sidste kunne relateres til enten brug af kunstgødning eller jordbehandling. En række biomarkører blev fundet i æbler, men relationen til dyrkningsmetoderne var ikke umiddelbar klar. Tre af biomarkørerne i æbler kunne relateres til enten brugen af pesticider eller kunstgødning, mens der ikke kunne drages nogen konklusion for de øvrige.
Resultaterne fra screeningen af afgrøderne danner basis for udviklingen af en simpel og billig test til at detektere, hvorvidt afgrøder er økologisk eller konventionelt dyrkede. Endvidere danner resultaterne, sammen med andre resulter fra projektet ”Økologisk kost og sundhed – et
Abstract
A broad screening programme, covering the most general phytochemical groups of compounds, was developed on the basis of Thin Layer Chromatography (TLC). A total of 46 TLC systems, comprising 26 derivatization reagents, 3 stationary phases, and 4 mobile phases, were included. The TLC systems were classified according to the groups of phytochemical compounds detected: Alcohols and phenolic compounds; Carbohydrates; N-containing compounds; Organic acids and lipids; P-containing compounds; S-containing compounds, and Terpenoids. Furthermore, one group of TLC systems detected compounds from several of the mentioned groups.
The screening programme was applied in the screening of potatoes (S. tuberosum L.), peas (P. sativum L.), kale (B. oleracea L.), carrots (D. carota L.), and apples (M. domestica Borkh.), cultivated with combinations of organic and conventional methods for plant protection and nutrient supply, for phytochemical differences (biomarkers).
Distinctive phytochemical differences were found between the differently cultivated samples of these crops. In peas and carrots only one biomarker was found. In peas the biomarker was related to the soil conditions, while the biomarker in carrots was related to the use of pesticides. In potato, two biomarkers related to the use of pesticides were found. Three biomarkers were found in kale. Two of these could be related to the use of pesticide, while the last was related to either fertiliser or soil conditions. Several biomarkers were found apples, but a relation to the
cultivation methods was not clear. Three of the biomarkers in apples could be related to either the use of pesticides or fertiliser, while no conclusions could be drawn from the other biomarkers found.
Table of contents
Resumé...ii
Abstract ...iii
Table of contents ... iv
1 Goal and introduction... 1
1.1 Goal... 1
1.2 Introduction ... 1
1.2.1 Conventional- versus organic farming and health ... 3
1.2.2 Assay method and kit for testing biological material for exposure to stress using biomarkers ... 4
1.2.3 The project “Organic food and health – a multigenerational animal experiment” ... 5
1.2.4 Organic- and conventional cultivation methods ... 6
1.2.5 Phytochemical differences between organically and conventionally cultivated food ... 8
1.2.6 Biomarkers and plant stress... 9
1.2.7 Effect studies of crops exposed to plant stress... 10
1.2.8 Thin Layer Chromatography ... 14
2 Experimental ... 15
2.1 Apparatus ... 15
2.2 Materials... 16
2.2.1 TLC plates ... 16
2.2.2 Reagents ... 16
2.2.3 Plant material... 17
2.3 Method ... 20
2.3.1 Sample preparation... 20
2.3.2 Screening procedure ... 21
2.3.3 Preparation of TLC plates... 22
2.3.4 Application on TLC plates ... 22
2.3.5 Preparation of mobile phases... 22
2.3.6 Development and drying of TLC plates ... 23
2.3.7 Preparation of derivatisation reagents... 23
2.3.8 Derivatisation by spraying... 26
2.3.9 Derivatisation by dipping ... 26
2.3.10 Post-treatment of derivatized TLC plates ... 26
2.3.11 Video documentation... 26
2.3.12 Video evaluation... 26
2.3.13 Evaluation of the results ... 27
2.3.14 Presentation of the results... 27
3 Results and discussion ... 29
3.1.1 Screening programme... 29
3.1.2 Prospects for the screening programme... 32
3.1.3 Presentation of the screening programme... 32
3.2 Results and discussion of the screening of crops ... 33
3.2.1 Performed cultivation comparisons ... 33
3.2.2 Screening results... 34
3.2.4 Discussion of the experimental conditions ... 37
3.2.5 Discussion of screening results... 38
3.2.6 Discussion of conventional versus organic farming and health... 40
3.2.7 Future development of a kit to determine whether crops are organically or conventionally cultivated using biomarkers ... 42
4 Conclusion ... 43
5 References... 44
1 Goal and introduction
1.1 Goal
The aim of this project is to,
- develop a screening programme covering the most general groups of phytochemical compounds using Thin Layer Chromatography as technique and
- perform a screening of crops grown under selected organic and conventional conditions (potatoes (Solanum tuberosum L.), kale (Brassica oleracea L.), carrots (Daucus carota L.), peas (Pisum sativum L.), and apples (Malus domestica Borkh.)) in order to detect possible phytochemical differences between organically and conventionally cultivated crops.
The results of the screening will form the basis for a potential development of a kit to determine whether crops are organically or conventionally cultivated. Furthermore, the results, from this part and other parts of the project “Organic food and health – a multigenerational animal experiment”, will provide basis for the selection of which secondary compounds to quantify by specific chemical analysis, isolate, and/or structure elucidate.
A poster presenting the programme was presented at Natur- og Miljøforskningskonferencen in Copenhagen 22-23 August 2002.
1.2 Introduction
The introductory chapter presents the background for this project. The first section is about the effect on health of conventionally- and organically cultivated plant food. This section is followed by a description of a new assay method and kit for testing biological material for exposure to stress using biomarkers. The following section presents the project “Organic food and health – a multigenerational animal experiment” from which the plant material for this project was
1.2.1 Conventional- versus organic farming and health
In the resent years there has been increasing focus on problems of food quality and considerable attention is being paid to organic farming.
Proponents of organic farming often claim that organically cultivated plant foods benefit more to health than conventionally cultivated plant foods. Others claim the opposite, and many doubt that there is any difference at all. The argument often used is that when plants are grown with
fertilisers and pesticides, they are supposed to loose their natural defence mechanism. This is thought to result in reduced disease resistance and a diluted content of minerals, vitamins, and defence related secondary metabolites, of which the last are indiscriminately considered beneficial for human health. Opponents almost use the same argument to arrive at the opposite conclusion. Owing to inadequate nutrition of plants and lack of protection against diseases, organic products are supposed to contain less of protein, sugars, and vitamins and have increased levels of defence related secondary metabolites, which are in this case considered harmful for human health.
To solve this disagreement, knowledge about whether organically cultivated plant foods contain more or less of certain nutrients, minerals, vitamins, and secondary metabolites compared with conventionally cultivated plant foods, has to be obtained. Furthermore, it has to be investigated to what extent the above mentioned plant components are beneficial or harmful to health (Brandt & Mølgaard, 2001).
Many different investigations have shown that the greater the daily intake of vegetables and fruit, the smaller the risk of major deadly diseases as cancer (Gandini et al., 2000) and cardiovascular diseases (Ness & Powles, 1997). Vegetables and fruit are not major sources of vitamins,
minerals, proteins, and carbohydrates in the average diet. In contrast, secondary metabolites are unique to these types of foods, and these compounds thus comprise the most likely candidates for this general health-promoting effect (Brandt & Mølgaard, 2001).
When plants are stressed from insect or fungal attack, they characteristically respond with a rapid increase in defence related secondary metabolites. Many of these compounds may cause
mutagenicity, carcinogenity, teratogenity or neurotoxicity in laboratory tests. Since increases in toxic defence related secondary metabolites are stress mediated, the prevention of insect or fungal attack can reduce the levels of the toxic defence related secondary metabolites in our food supply. Pesticides used in conventional farming are used to reduce plant stress and there may be a possible benefit of decreased risk of toxic defence related secondary metabolites (Mattsson, 2000).
This project will only determine whether or not the phytochemical composition of organically and conventionally cultivated crops differs. To assess whether the differences are beneficial or harmful to health, the biological activity of the components must be determined, at the relevant concentrations.
1.2.2 Assay method and kit for testing biological material for exposure to stress using biomarkers
A new method for detection of biomarkers in biological material has been developed at the National Environmental Research Institute and sought patented internationally. The method is used to test whether a living organism has been exposed to stress, such as pesticides. The method is based on detection of a reproducible biomarker pattern, consisting of at least two biomarkers, in exposed living organisms compared with non-exposed living organisms. The biomarker pattern in living organisms exposed to stress is related to and depends on the applied stress. An object of the present invention is to provide an assay kit for the determination of whether material from a living organism has been exposed to stress. The assay kit is to be used as a field test or as laboratory test, in both cases with Thin Layer Chromatography as technique. An assay kit could be directly applicable in many fields. It could be used as an early warning system, where the phytochemical response to small amounts of herbicides appears before visual effects. Farmers could use the system to reduce the amount of pesticide necessary to obtain a given effect on plants. Furthermore, an assay kit could be used in food quality control, such as control of whether organic crops have been exposed to stress, such as pesticides (Ravn, 2001).
representing nine families. The plants were exposed to four herbicides (metsulfuron methyl, glyphosate, pendimethalin and bromoxynil) with different modes of action and screened for phytochemical differences. A biomarker pattern was present in the most sensitive plant species, only 4 days after exposure with as low as 1% of recommended field dose of the herbicide, without visual effect on the exposed plants. A different biomarker pattern was present for each herbicide, and the biomarker pattern depended on the mode of action of the herbicide. Different species showed a different pattern of biomarkers, but a simpler common biomarker pattern was identified for all the species treated with the same herbicide. Furthermore, it was found that the different plant species had different sensitivity and that the response was delayed when plants were exposed to lower concentrations of herbicide. Besides, it was found that a biomarker pattern could be identified in a time period after exposure and until the death of the plant (Ravn & Løkke, 2002).
The phytochemical screening performed in this project will form an essential part in the process of developing a kit to determine whether crops are organically or conventionally cultivated.
1.2.3 The project “Organic food and health – a multigenerational animal experiment”
The overall objective of the project “Organic food and health – a multigenerational animal experiment” is to determine if a controlled animal feeding experiment comparing conventional and organic food products shows differences in animal physiology of a type and magnitude that indicates that such products can affect humans differently. The Danish Institute of Agricultural Science, The Royal Veterinary and Agricultural University, Risø National Laboratory, Technical University of Denmark, University of Southern Denmark and National Environmental Research Institute collaborate on the project.
Basically, the project consists of cultivation experiments. Seven crops (potato (Solanum tuberosum L.), pea (Pisum sativum L.), kale (Brassica oleracea L.), carrot (Daucus carota L.), apple (Malus domestica Borkh.), wheat (Triticum aestivum L.), and rape (Brassica napus L.)) are produced in three different models of cultivation systems,
- an organic cultivation system, without synthetic fertilisers and pesticides,
- a conventional cultivation system, using synthetic fertiliser and as much pesticides as allowed, and
The picture-developing properties of the fresh plant material and feed mixtures are examined by the use of biocrystallization. Furthermore, characteristic secondary metabolites are measured in selected plant material from each cultivation system. The major nutrients in the plants are determined and the biological value of major protein sources of the plants will be assessed. Based on these results, 3 feed mixtures are prepared, corresponding to the 3 model systems. The concentration of approximately 20 elements and 150 pesticides are measured by analysis of the feed mixtures. Rats are fed with the feed mixtures and reproductive characteristics and weight gain is recorded. A screening for phytochemical differences in the plant material are performed. The data from the above mentioned experiments are assembled and analysed (FØJO, 2000, pp. 59-60).
The results of the screening for phytochemical differences are described in this report. These and results from other parts of the project will provide basis for selection of which secondary
compounds to quantify by specific chemical analysis, isolate, and/or structure elucidate.
1.2.4 Organic- and conventional cultivation methods
In Denmark, the public interest in organic farming is fairly new and only few farms have
followed the regulations for organic farming for more than a decade. The idea of organic farming goes back to the beginning of the 1900-century when fertiliserfertilisers first were introduced in agriculture. At that time, some farmers and scientists were concerned that this would lead to crops and soil of poor quality. Organic farming did not gain footing for many years since the benefits by using fertilisers and pesticides were obvious (Fog & Nørfelt, 2001, pp. 7). In the 1970s, attention was paid on the environmental impact of intensive agriculture, in particular problems with the use of pesticides and commercial fertilisers, was the major driving force (Thamsborg, 2001).
A fundamental principle in organic farming is to minimise environmental impacts as much as possible while sustaining an economically viable level of production. The key aspects of organic farming thus aim,
• to increase or at least maintain soil fertility over the long term, • to avoid the use of mineral and synthetic fertilisers, and • to avoid the use of synthetic pesticides.
the main distinction between organic and conventional farming is the use of synthetic fertilisers in conventional farming as compared to only animal manure and crop residues in organic farming. The supply of nutrients is one of the most limiting factors in organic farming. Nitrogen self sufficiency is secured through the use of legumes crops which are capable of obtaining nitrogen directly from the air through bacterial nodules on their roots. Furthermore, nitrogen supply is secured through an effective recycling of organic materials, including crop residues and animal manure (Thamsborg, 2001). Microorganisms (bacteria and fungi) play a central role in maintaining the fertility of the soil, and are therefore crucial to organic farming. Within the soil, the decomposition of organic matter, releasing plant available N, is primarily due to microbial activity. Earthworms are key species of the macro-fauna, and are very important for soil fertility, being the first link in the decomposition of plant constituents. With regard to soil biology, due to its versatile crop rotations, reduced applications of nutrients, and the ban on pesticides, organic farming is usually associated with a significantly higher level of biological activity (Hansen et al, 2001).
Since the use of synthetic pesticides is banned in organic farming, weed, diseases and pests are kept under control by rotating crops to change the field ecology. Weeds are controlled through crop rotation, mechanical tillage, and hand weeding, as well as through flame weeding and other management methods (Fog & Nørfelt, 2001).
Synthetic pesticides, used in conventional farming, are deliberately used for the purpose of killing different forms of life. The ideal situation, of course, is that pesticides are highly
selective, destroying target organisms while leaving non-target organisms unharmed (Hodgson & Levi, 1987, pp. 66). Pesticides are a general term, which includes chemicals used to control insects (insecticides), weeds (herbicides), plant diseases (fungicides) etc. Herbicides are substances used to eliminate unwanted plants in agriculture (Duffus, 1980, pp. 58). Herbicides represent an extremely broad array of chemical classes and, in turn, act at a large number of sites of metabolic function and energy transfer in plant cells. Despite a growing body of knowledge, the exact molecular sites of action of many herbicides are unknown (Duke, 1990).
Metribuzin is a selective systemic herbicide used in the control of many annual broad-leaved and grass weeds in e.g. potatoes (Tomlin, 2001). The selectivity in potatoes is the result of partly low absorption, due to treatment with metribuzin before germination of the potatoes, partly
inactivation of metribuzin in the potatoes (Kristensen et al., 2000).
Bentazone is a selective contact herbicide used in the control of many annual broad-leaved weeds in e.g. peas (Tomlin, 2001).
Linuron is a selective systemic herbicide. Linuron is used in the pre- and post-emergence control of annual grass and broad-leaved weeds, and some seedling perennial weeds in e.g. carrots (Tomlin, 2001). The selectivity in carrots is a result of inactivation of linuron in the roots (Kristensen et al., 2000).
The above mentioned herbicides all act as photosynthetic inhibitors. They all bind to the D-1, quinone-binding protein of photosynthetic electron transport and thereby block photosynthetic electron transport (Duke, 1990).
Glufosinate-ammonium is a non-selective contact herbicide with some systemic action, used as a desiccant in e.g. potatoes. The herbicide is an irreversible inhibitor that competitively inhibits binding of glutamate to glutamine synthetase (GS). The inhibition of GS in plants that are reducing nitrate to ammonia leads to accumulation of toxic levels of ammonia and rapid cellular collapse (Duke, 1990).
Pendimethalinis a selective herbicide used in the control of most annual grasses and many annual broad-leaved weeds in e.g. peas (Tomlin, 2001). The herbicide directly disrupts cell division by attacking a molecular site that is specific for cell division. The herbicide binds tubulin, the protein from which microtubules are composed. Microtubules are required for cell division and cell wall formation (Duke, 1990).
In this project, potential phytochemical differences between organically and conventionally cultivated crops will, when possible, be related to either soil conditions, fertiliser or to the use of pesticides. The mode of action of the herbicides used will be included in the discussion of the phytochemical differences related to pesticides.
1.2.5 Phytochemical differences between organically and conventionally cultivated food
Two recent reviews (Woese et al., 1997 and Williams, 2002) covering more than 150
fewer N-containing compounds, and higher vitamin C (ascorbic acid) levels were found in organically cultivated plant food compared with conventionally cultivated plant food. An
experiment was conducted for three years with five replicates of two treatments, one organic and one conventional, for potatoes (S. tuberosum L.)(Warman & Havard, 1998), carrots (D. carota L.), and kale (B. oleracea L.)(Warman & Havard, 1997). Given the number of factors analysed for carrots, kale, and potatoes, there were relatively few and small differences in the yield and in the vitamin and mineral content using the two different cultivation systems. The study found that the vitamin C (ascorbic acid) level in potatoes, carrots, and kale was not affected by the different cultivation methods.
In most studies, only nutrients, vitamins, and minerals were analysed. The secondary metabolites, which are the compounds, which both pro and cons expect to differ between organically and conventionally cultivated plant food, were not analysed.
In this project, a broad range of phytochemical compounds organically will be investigated in crops grown in three models of organic and conventional cultivation systems. Screening for N-containing compounds and organic acids will indicate whether some of the above-described relations apply to the crops tested.
1.2.6 Biomarkers and plant stress
A biomarker is defined as: “A biological response to an environmental chemical which gives a measure of exposure, and sometimes also of toxic effect. The biological response may be at the molecular, cellular or whole organism level” (Walker, 1995).
Figure 1: List of some different natural- and anthropogenic stress factors.
Figure modified according to Lichtenthaler (1996).
Some of the anthropogenic stress factors mentioned in Figure 1, UV-light, nutrients, and ozone, can also be considered as natural stress factors.
In this project, a biomarker refers to a phytochemical compound that increases or decreases in concentration as a response to an exposure to anthropogenic chemical stress. The phytochemical compound increases or decreases at least 50% in concentration, in relation to a control, in both replicates, before it is considered a biomarker. A biomarker pattern is the overall phytochemical differences assembled and consists of at least 2 biomarkers.
The anthropogenic chemical stress factors in this project include pesticides and fertilisers.
1.2.7 Effect studies of crops exposed to plant stress
A literature study has been performed in order to illustrate different aspects of stress exposure in crops. Different natural- and anthropogenic stress factors, as well as different crops, relevant to this project, have been included.
The following two examples illustrate the influence of climatic conditions (Rosa et al., 2001) and turnip root fly damage (Hopkins et al., 1995) on the level of carbohydrates in kale (B. oleracea L.).
The first study investigated the influence of climatic conditions on glucose, fructose, and sucrose levels in kale (B. oleracea L.) grown in spring/summer and summer/winter. The kale was grown in the same field and harvested at commercial maturity stage. The leaves were freeze dried and extracted with ethanol before the carbohydrates were measured spectrophotometrically. The
Natural stress
factors
Drought/wet
Temperature (cold/warm)
Wind
Herbivores
Plant phatogens
Plant compounds from other plants
P
L A N T
B I O M A R K E R
Anthropogenic stress factors
Pesticides
Ozone
Acid rain
Chemicals
UV-light
level of glucose was higher in spring/summer than in summer/winter season while the exact opposite was found for fructose levels. Only a slight increase in sucrose was seen in
spring/summer compared to summer/winter (Rosa et al., 2001).
The content of fructose, glucose, sucrose, and total sugars was measured in kale (B. oleracea L.) inoculated with eggs of the turnip root fly, Delia floralis. Freeze-dried root material was
extracted with ethanol and the carbohydrates were separated and quantified by HPLC (High Performance Liquid Chromatography). The fructose concentration rose while the glucose, sucrose, and total sugar concentration fell after inoculation (Hopkins et al., 1995). The decrease in total root carbohydrate concentration may be explained in two ways. Carbohydrate production may be limited by the root damage caused by larval feeding. Secondly, it is possible that the parts of the root higher in carbohydrate concentration will be consumed first, resulting in a decrease in total root carbohydrate concentration.
The two above-mentioned examples indicate that the carbohydrate level in kale changes in response to several stress factors.
Examples covering drought stress in the literature are numerous. The following example illustrates how different varieties of the same species respond phytochemically different to the same stress factor.
Three different varieties of S. tuberosum L. grown under drought stress, with and without irrigation, were analysed for their content of glycoalkaloids. The whole potato was freeze dried, extracted and quantified by the use of HPLC. A significant increase in the concentration of glycoalkaloids was observed under drought stress conditions in S. tuberosum var. andigena (Malcacho) and S. tuberosum var. tuberosum (Desiree) while only a small increase in the concentration of glycoalkaloids was observed in S. tuberosum var. andigena (Sani Imilla) (Bejarano et al., 2000). Since the potatoes were freeze dried the differences seen in the glycoalkaloid content cannot be explained in terms of varying water content in the potatoes. Therefore, the conclusion must be that different varieties react differently upon the same stress factor, S. tuberosum var. andigena (Sani Imilla) being the most tolerant to drought stress.
In a study peformed by Merzlyak & Chivkunova (2000), it was investigated if anthocyanins were also involved in the defence against visible radiation. The amount of anthocyanins in fruits of apples (M. domestica Borkh.) grown in sunlight and shade was measured using reflectance spectroscopy. Information on how the plant material was grown, and how the samples were prepared is missing. The results showed that apples grown in sunlight accumulated large amounts of anthocyanins while apples grown in shade did not accumulate anthocyanins. Furthermore, the sunlit side of the apples was pink or dark red while the shaded side was pale green. The change of apple colour to dark red was accompanied by a rise of cyanidin-3-galactosid, which was the main anthocyanin in the apple skin.
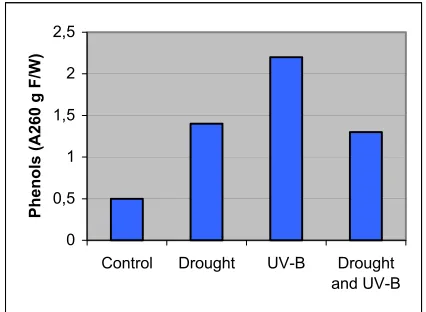
The aspect of inter-relationships between two different stress factors is covered by investigations performed by Alexieva et al. (2001). The stress responses and interaction of drought and
[image:16.595.66.279.368.524.2]ultraviolet-B radiation in peas (P. sativum L.) were examined.
Figure 2: Changes in the content of phenols in peas (P. sativum L.) subjected to drought and UV-B stresses (Alexieva et al., 2001).
The peas were in the age of 10 days exposed to drought stress for 7 days. The plants were harvested and the leaves together with water were shaken for 24 hours. The amount of phenols was measured spectrophotometrically.
Among the results was found that the amount of phenols was affected by the application of drought and UV-B radiation stress in pea, see Figure 2. A stronger increase in the concentration of phenols was observed after application of UV-B radiation compared to the application of drought stress. Furthermore, the two stress factors acted synergistically on the amount of phenols
0 0,5 1 1,5 2 2,5
Control Drought UV-B Drought
and UV-B
to induce protective mechanisms in that pre-application of either stress reduced the damage caused by subsequent application of the other stress.
The protective interaction between UV-B radiation and drought stresses may be that the control of water loss constitutes an UV-B radiation positive effect on drought stressed pea plants. Another experiment investigated the effects of water-deficit stress on the content of carbon and nitrogen in P. sativum L. nodules. 4-week-old nodules were exposed to mild and intense water-deficit stress for 7 and 14 days respectively. Information on sample preparation and on how the carbon and nitrogen content was measured is missing. A drastic increase in the nodules content of sucrose was found while glucose and fructose did not show any response to any of the
imposed water-deficits. Nodule total free amino acids increased throughout the mild and intense water stress period. Amino acid levels fell to control values at the end of the intense water stress period (Gonzáles et al., 1998). The ability to metabolise sucrose may be impaired in water-deficit stressed pea nodules. The increase in amino acid level may be due to less water for the transport of N-products away from the nodules. This, however, does not explain why the amino acid level fell to control values at the end of the intense water stress period.
Only one or two phytochemical groups of compounds have been described, in response to a given stress factor, in the above-mentioned studies. In this project, a broad range of
phytochemical compounds will be investigated.
1.2.8 Thin Layer Chromatography
Thin Layer Chromatography (TLC) is a relatively new discipline. Chromatography historians usually date the advent of modern TLC to 1958. Early development in TLC was done by Izmailov and Schraiber in 1938. They succeeded in separating medicinal plants on unbound alumina spread on glass plates. They applied drops of solvents to the plate containing the sorbent layer and sample, as a result several circles of substances were seen in UV-light. In 1949
[image:18.595.71.491.460.607.2]Meinhard and Hall used a binder to adhere alumina to microscope slides. These layers were used in the separation of inorganic ions. In the early 1950s Kirchner developed TLC as we know it today. He was the first to separate mixtures by adsorption chromatography on filter paper and, later, on glass fibre paper impregnated with silica and alumina. Stahl introduced the term “Thin Layer Chromatography” in the late 1950s. His major contributions were standardisation of materials, procedures, and description of selective solvent systems for resolution of important compound classes (Sherma & Fried, 1996, pp. 4-5; Kreuzig, 1998; Scott, 1995, pp. 349-351).
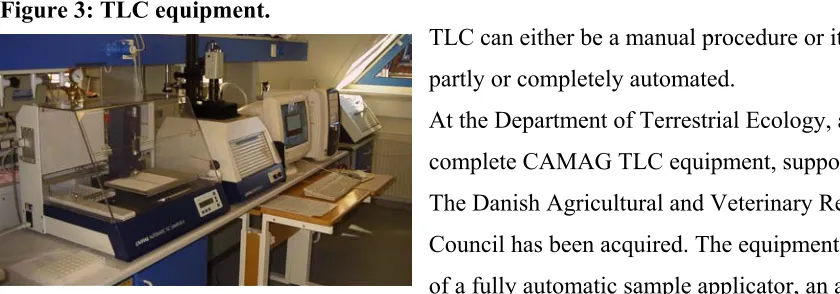
Figure 3: TLC equipment.
TLC can either be a manual procedure or it can be partly or completely automated.
At the Department of Terrestrial Ecology, a complete CAMAG TLC equipment, supported by The Danish Agricultural and Veterinary Research Council has been acquired. The equipment consists of a fully automatic sample applicator, an automatic developing chamber, and an automatic immersion (dipping) devise. Another part of the
equipment is an image documentation system, VideoStore, which allows imaging and archiving of chromatograms while VideoScan allows evaluation of the images captured with VideoStore. Finally, a scanner is available allowing densitometric evaluation of chromatograms.
Modern TLC is an extremely simple, flexible, reliable, and cost efficient method (Fried &
in many different fields e.g. medicine, pharmacy, environment, food, and chemistry (Hahn-Deinstrop, 2000, pp. 3).
TLC is the technique used in this project. The described equipment will be applied in the screening of crops.
2 Experimental
2.1 Apparatus
Dip tanks (Duran glass) for plates 20 x 20 cm (22.6629), CAMAG, Muttenz, Switzerland Lid for dip tanks 20 x 20 cm (22.6622), CAMAG, Muttenz, Switzerland
Disposable Micropipettes (2 and 5 µl) and pipetting aids, BLAUBRAND ® intraEND, Brand Elgastat Maxima Analytical, Holm & Halby, Allerød, Denmark
Flat Bottom Chamber for 10 x 10 cm plates, with stainless steel lid (022.5150), CAMAG, Muttenz, Switzerland
Hand press, SUSI, Zyliss, U.S.Pat. 5.513.562, Switzerland
Micro Centrifuger, Capsule, 6.400 rpm/min, Tomy Seiko CO. Ltd., Tokyo, Japan Moulinex LUXE Coffee Mill, type 843
Plastic Bottles, polyethylene, 100 ml, Apodan, Copenhagen, Denmark
Screw caps with dosing hole and protective lids, Apodan, Copenhagen, Denmark Reagent Spray (atomizer) and spray head, CAMAG, Muttenz, Switzerland
Refrigerating centrifuger type 154.RF, Ole Dich Instrumentmakers ApS, Hvidovre, Denmark Reprostar 3 with cabinet cover, mounted digital camera, and camera UV blocking filter typ. 2A,
CAMAG, Muttenz, Switzerland
TLC Plate Heater III, CAMAG, Muttenz, Switzerland TLC Spray Cabinet, CAMAG, Muttenz, Switzerland
Ultrasonic Bath, Branson 5510E-MT, Bransonic, Danbury, USA
UV Lamp dual wavelength, 254/366 nm in combination with Viewing Box 3, CAMAG, Muttenz, Switzerland
2.2 Materials
The materials listed in this part of the report are included in the screening programme. Materials only used in the development of the screening programme are presented in Appendix 1.
2.2.1 TLC plates
Silica gel 60, HPTLC aluminium sheets 20 x 20 cm, Merck Ord. No. 1.05547 Silica gel 60 F254, HPTLC aluminium sheets 20 x 20 cm, Merck Ord. No. 1.05548 Cellulose, TLC aluminium sheets 20 x 20 cm, Merck Ord. No. 1.05552
2.2.2 Reagents
Acetic acid 100%, GR for analysis, ACS, ISO, Merck Ord. No. 1.00063 o-Anisaldehyde 98%, Acros Organics Ord. No. 14922
Ammonia solution 24,5%, Borup Kemi
Ammonia solution 25%, GR for analysis, Merck Ord. No. 1.05432
Ammonium molybdate, GR for analysis, ACS, ISO, Merck Ord. No. 1.01182 Bismuth(III)nitrate, BDH Laboratory Supplies Prod. No. 27388
Bromocresol green, indicator pH 3.8-5.4, Fluka® Prod. No. 17470 Bromophenol blue, indicator pH 3.0-4.6, ACS, Merck Ord. No. 1.08122 1-Butanol, GR for analysis, ACS, ISO, Merck Ord. No. 1.01990
Cobalt(II)chloride hexahydrate, GR for analysis, ACS, Merck Ord. No. 1.02539 Copper(II)nitrate, GR for analysis, Merck Ord. No. 1.02753
2’,7’-Dichlorofluorescein, fluorescence indicator, Merck Ord. No. 1.09676 Diphenylboric acid 2-aminoethylester, Sigma® D 9754
Ethanol 96%, Ph. Eur., Danisco Distillers Ethanol 99,9%, Ph. Eur., Danisco Distillers Fluorescein, Aldrich® Prod. No. F245-6
Formic acid 98-100%, GR for analysis, ACS, Merck Ord. No. 1.00264 Hydrochloric acid 25%, GR for analysis, Merck Ord. No. 1.00316
Hydrochloric acid min. 37%, Analytical Reagent, Reag. ISO, Reag. Ph. Eur., Riedel-deHaën® Prod. No. 30721
Methanol, GR for analysis, ACS, ISO, Merck Ord. No. 1.06009 Methylene blue, Reag. Ph. Eur., Merck Ord. No. 1.59270
Molybdatophosphoric acid, GR for analysis, ACS, Merck Ord. No. 1.00532
β-Naphthol, Sigma® N 1250
Naphthoresorcinol, Fluka® Prod. No. 70650
Ninhydrin, GR for analysis, Merck Ord. No. 1.06762
Nitric acid 65%, GR for analysis, ISO, Merck Ord. No. 1.00456
Palladium(II)chloride (59%Pd) anhydrous, for syntesis, Merck Ord. No. 8.07110 Phosphoric acid 85%, “Baker Analyzed”, ACS, J.T.Baker® Prod. No. 6024 Polyethylene glycol 4000 for synthesis, Merck Ord. No. 8.07490
Potassium iodide, GR for analysis, ISO, Merck Ord. No. 1.05043
Potassium permanganate “Baker Analyzed”, ACS, J.T.Baker® Prod. No. 0237 1-Propanol, GR for analysis, Merck Ord. No. 1.00997
2-Propanol, GR for analysis, ACS, ISO, Merck Ord. No. 1.09634 Rhodamine 6 G, Sigma® R 4127
Rhodamine B, Sigma® R 6626
Silver nitrate, GR for analysis, ACS, ISO, Merck Ord. No. 1.01512
Sodium carbonate anhydrous, GR for analysis, ISO, Merck Ord. No. 1.06392 Sodium nitrite, GR for analysis, ACS, Merck Ord. No. 1.06549
Sulfuric acid 95-97%, GR for analysis, ISO, Merck Ord. No. 1.00731 Thymol, Fluka® Prod. No. 89330
Tin(II)chloride, GR for analysis, ACS, Merck Ord. No. 1.07815 Vanillin, Ph. Eur., BP, NF, Merck Ord. No. 1.08510
Water, ELGA, ion exchanged water (Elgastat Maxima Analytical) Zinc chloride, GR for analysis, ACS, ISO, Merck Ord. No. 1.08816
2.2.3 Plant material
Plant material included in this project:
- Apple, Malus domestica Borkh. (Otava) (Malaceae)
Potatoes (S. tuberosum L.) were produced in Foulum. Carrots (D. carota L.), kale (B. oleracea L.), apples (M. domestica Borkh.), and peas (P. sativum L.) were produced in Årslev. The plots with pesticide treated crops and untreated crops respectively were placed in the same or
[image:22.595.67.545.349.476.2]immediately adjacent fields to ensure comparable soil conditions. In all cases the pesticide treated plots were placed with concern for the risk of contamination, an appropriate separation was defined between the plots, and spraying was done with appropriate equipment, only under suitable weather conditions. The cultivation methods for the individual crops are shown in Table 1-5 below.
Table 1: Cultivation method, potato.
Crop:Solanum tuberosum L., Cultivation locality: Foulum, Time of planting: 24/4-2001, Time of harvesting: 27-28/9-2001,
Storage temperature: 6°C
Parcel 1 ” Pseudo conventional”3 Parcel 2 Parcel 3 “Organic”
Soil OrganicOrganic2 OrganicOrganic2 OrganicOrganic2
Fertiliser High
(NPK, 135 kg N/ha, 19 kg P/ha, 65 kg K/ha)
Low
(Animal manure, 63 kg N/ha, 24 kg P/ha, 40 kg K/ha) Pesticide
Date Pesticide - active ingredient
Kg. pr. ha. Type of pesticide
Pesticide -1 3/7-2001 -1 -1 Metribuzin Mancozeb Cypermethrin Glufosinat-ammonium 0.35 2 0.2 3 Herbicide Fungicide Insecticide Herbicide No pesticide
1 Information about date not available; 2 Soil cultivated organically for at least 5 years; 3 No real conventional cultivation method since
organicorganic soil is used.
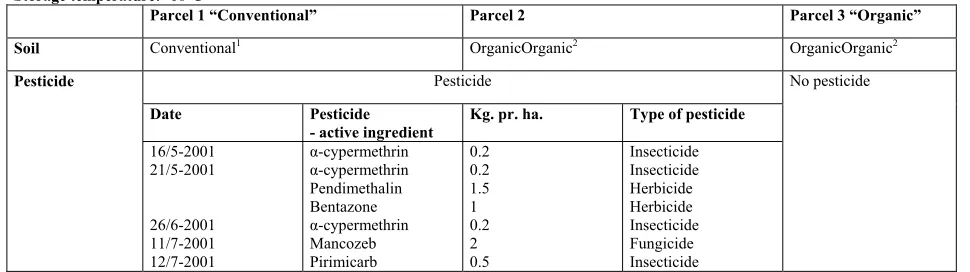
Table 2: Cultivation method, pea.
Crop:Pisum sativum L., Cultivation locality: Årslev, Time of sowing: 2/5-2001, Time of harvesting: 23/8-2001 (sundried),
Storage temperature: -18°C
Parcel 1 “Conventional” Parcel 2 Parcel 3 “Organic”
Soil Conventional1 OrganicOrganic2 OrganicOrganic2
Pesticide
Date Pesticide - active ingredient
Kg. pr. ha. Type of pesticide
Pesticide 16/5-2001 21/5-2001 26/6-2001 11/7-2001 12/7-2001 α-cypermethrin α-cypermethrin Pendimethalin Bentazone α-cypermethrin Mancozeb Pirimicarb 0.2 0.2 1.5 1 0.2 2 0.5 Insecticide Insecticide Herbicide Herbicide Insecticide Fungicide Insecticide No pesticide
[image:22.595.64.549.547.683.2]Table 3: Cultivation method, kale.
Crop:Brassica oleracea L., Cultivation locality: Årslev, Time of sowing: 3/5-2001, Time of planting out: 30/5-2001,
Time of harvesting: 30/10-2001, Storage temperature: -18°C
Parcel 1 Parcel 2 “Conventional” Parcel 3 Parcel 4 “Organic”
Soil Conventional5 Conventional5 OrganicOrganic6 OrganicOrganic6
Fertiliser Low (NPK1) High (NPK1) Low (Binadan2) Low (Binadan2)
Pesticide
Date Pesticide - active ingredient
Kg. pr. ha. Type of pesticide
Pesticide -3 28/5-2001 13/6-2001 13/7-2001 16/7-2001 26/7-2001 10/8-2001 15/8-2001 27/8-2001 29/8-2001 11/9-2001 Thiram Chlorfenvinphos Dimethoate Pirimicarb Biobit Biobit Biobit Mancozeb Pirimicarb Biobit Mancozeb
Steeping of seeds -4 2 0.5 1 1 1 2 0.5 1 2 Fungicide Insecticide Insecticide Insecticide Insecticide Insecticide Insecticide Fungicide Insecticide Insecticide Fungicide No pesticide
1Information about the composition of NPK not available; 2 Organic pellets of poultry manure; 3 Information about date not available;
4 Information about amount of chlorfenvinphos not available; 5 Soil cultivated conventionally for at least 5 years; 6 Soil cultivated organically for
at least 5 years.
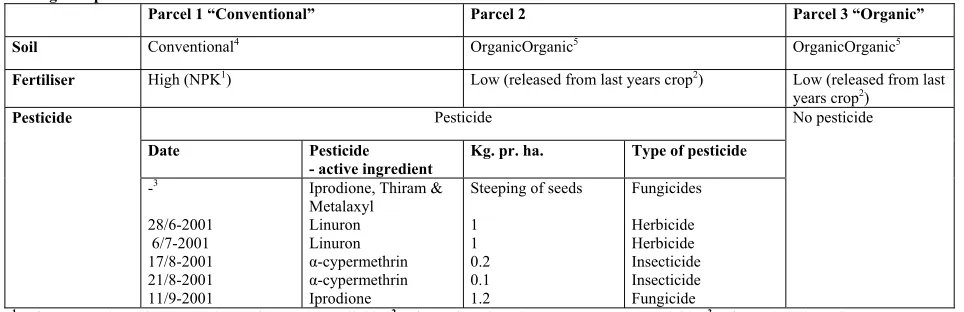
Table 4: Cultivation method, carrot.
Crop:Daucus carota L., Cultivation locality: Årslev, Time of sowing: 23/5-2001, Time of harvesting: 17/10-2001,
Storage temperature: -18°C
Parcel 1 “Conventional” Parcel 2 Parcel 3 “Organic”
Soil Conventional4 OrganicOrganic5 OrganicOrganic5
Fertiliser High (NPK1) Low (released from last years crop2) Low (released from last
years crop2) Pesticide
Date Pesticide
- active ingredient Kg. pr. ha. Type of pesticide
Pesticide -3 28/6-2001 6/7-2001 17/8-2001 21/8-2001 11/9-2001
Iprodione, Thiram & Metalaxyl Linuron Linuron α-cypermethrin α-cypermethrin Iprodione
Steeping of seeds
1 1 0.2 0.1 1.2 Fungicides Herbicide Herbicide Insecticide Insecticide Fungicide No pesticide
1 Information about the composition of NPK not available; 2 Information about last years crop not available; 3 Information about date not
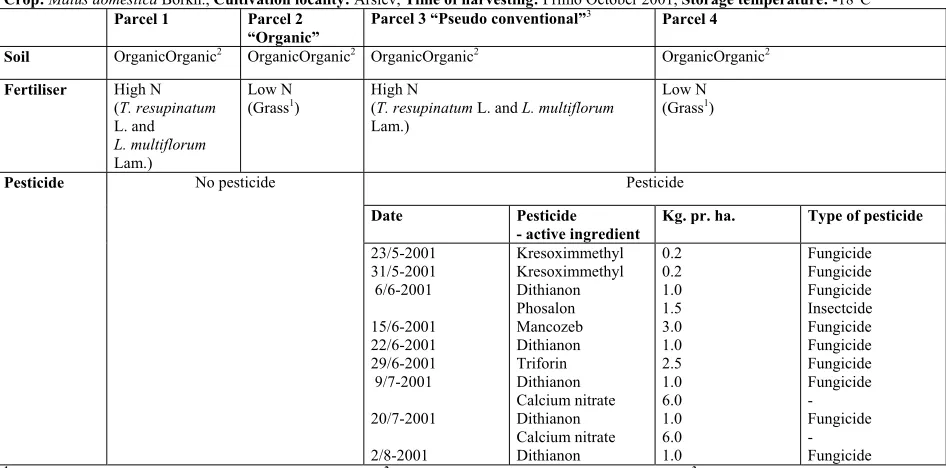
[image:23.595.65.547.395.551.2]Table 5: Cultivation method, apple.
Crop:Malus domestica Borkh., Cultivation locality: Årslev, Time of harvesting: Primo October 2001, Storage temperature: -18°C
Parcel 1 Parcel 2
“Organic”
Parcel 3 “Pseudo conventional”3 Parcel 4
Soil OrganicOrganic2 OrganicOrganic2 OrganicOrganic2 OrganicOrganic2
Fertiliser High N
(T. resupinatum L. and L. multiflorum Lam.)
Low N
(Grass1) High N (T. resupinatum L.and L. multiflorum Lam.)
Low N (Grass1)
Pesticide
Date Pesticide - active ingredient
Kg. pr. ha. Type of pesticide
Pesticide No pesticide
23/5-2001 31/5-2001 6/6-2001 15/6-2001 22/6-2001 29/6-2001 9/7-2001 20/7-2001 2/8-2001 Kresoximmethyl Kresoximmethyl Dithianon Phosalon Mancozeb Dithianon Triforin Dithianon Calcium nitrate Dithianon Calcium nitrate Dithianon 0.2 0.2 1.0 1.5 3.0 1.0 2.5 1.0 6.0 1.0 6.0 1.0 Fungicide Fungicide Fungicide Insectcide Fungicide Fungicide Fungicide Fungicide - Fungicide - Fungicide
1 Information about the composition of grass not available; 2 Soil cultivated organically for at least 5 years; 3 No real conventional cultivation
since organicorganic soil is applied.
2.3 Method
2.3.1 Sample preparation
2.3.1.1 Potato (S. tuberosum L.)
Five fresh potatoes were rinsed with water and separated into peel and core respectively. Juice from peel and core respectively was prepared in a juice separator. The juice was transferred to micro tubes and centrifuged (6.400 rpm) for 3 minutes. The supernatant was centrifuged for additionally 3 minutes in new micro tubes. The supernatant was immediately used for phytochemical analysis.
2.3.1.2 Pea(P. sativum L.)
2.3.1.3 Kale(B. oleracea L.)
10 g defrosted kale was separated from stems and pressed for plant sap using a hand press. The first ml was discarded. The remaining sap was transferred to micro tubes and centrifuged (6.400 rpm) for 3 minutes. The supernatant was centrifuged for additionally 3 minutes in new micro tubes. The supernatant was immediately used for phytochemical analysis.
2.3.1.4 Carrot(D. carota L.)
Three frozen carrots were defrosted and rinsed with water. The first cm of the top of the root was discarded and of the remaining only the 5 cm top of the root was used. This was performed to obtain a homogeneous root tissue. Juice was prepared in a juice separator. The juice was transferred to micro tubes and centrifuged (6.400 rpm) for 3 minutes. The supernatant was centrifuged for additionally 3 minutes in new micro tubes. The supernatant was immediately used for phytochemical analysis.
2.3.1.5 Apple(M. domestica Borkh.)
Five frozen apples were defrosted and freed from most of the core only leaving about 1 cm of the core together with the peel. Juice was prepared in a juice separator. The juice was transferred to micro tubes and centrifuged (64.000 rpm) for 10 minutes. The supernatant was centrifuged for additionally 10 minutes in new micro tubes. The supernatant was immediately used for
phytochemical analysis.
2.3.2 Screening procedure
The screening programme, presented in Table 6, was run for each crop. Replicate experiments were carried out for each crop with different representative samples to ensure reliability of the results.
Table 6: Screening programme. TLC systems classified according to the group of phytochemical compounds detected.
Alcohols and phenolic compounds
Carbohydrates N-containing compounds Organic acids and lipids P-containing compounds S-containing compounds Terpenoids
Several of the mentioned groups
V (52,8) AA (47,1) AA (47,8) ADβ (47,8)
AI (47,8) AL (48,8) C (47,8) C (52,2) C (52,8) E (47,1) E (47,8) AN (47,1) AN (47,8) AN ( 52,1) AV (47,8) AX (52,1) AX (52,2) AX (52,3) AY (52,8) G (47,1) G (47,8) G (52,8) N (52,1) N (52,8) BH (47,1) BH (47,8) BI (47,8) AÅ (47,1) AÅ (47,8) AÅ (52,1) BG (52,1) BG (52,8) BB (47,1) BB (47,8) YB (47,8) Z (47,8) Z (52,8) A (47;8) B (47,1) B (47,8) BC (47,1) F (47,1) F (47,8) I (47,1) I (47,8) R (47,8)
Capital letter: Indicates the derivatisation reagent, see Table 16; Numbers in brackets: Indicate the stationary- and mobile phase; 47: Silica gel 60, HPTLC aluminium sheets; 48: Silica gel 60 F254, HPTLC aluminium sheets; 52: Cellulose, TLC aluminium sheets; 1: 1-butanol:acetic acid:water (4:1:5), upper phase; 2: 1-butanol:50% formic acid (2:1); 3: 2-propanol:acetic acid (2:1); 8: 1-propanol:25% ammonia (11:9).
2.3.3 Preparation of TLC plates
The TLC plates used for the screening were 6.67 x 10 cm plates for carrot (D. carota L.) and pea (P. sativum L.) and 10 x 10 cm plates for potato (S. tuberosum L.), apple (M. domestica Borkh.), and kale (B. oleracea L.). The starting line was marked at a distance of 1.5 cm from the bottom edge of the plate and the distance to be reached by the solvent front was marked at a distance of 9.5 cm from the bottom edge of the plate. The marks were made with a soft pencil.
2.3.4 Application on TLC plates
The extracts were applied pointwise using 2 and 5 µl micropipettes. Extracts of potato (S. tuberosum L.), apple (M. domestica Borkh.), carrot (D. carota L.), and kale (B. oleracea L.) were applied in the amounts of 5 µl on Silica gel 60, HPTLC aluminium sheets and Silica gel 60 F254, HPTLC aluminium sheets and 2 µl on Cellulose, TLC aluminium sheets. Silica gel 60, HPTLC aluminium sheets used in combination with the following derivatisation reagents: R (silver nitrate - ammonia), AI (thymol - sulfuric acid), ADβ(β-naphthol - sulfuric acid), and AA
(naphthoresorcinol - sulfuric acid) were applied the amount of 2 µl of extract. Extracts from pea (P. sativum L.) were applied in the amount of 5 µl on all plate types.
2.3.5 Preparation of mobile phases
The mobile phase was prepared by mixing 1-butanol, acetic acid and water in the proportion of 4 to 1 to 5 in a separatory funnel and shaking manually for 10 minutes. The two phases separated and the upper phase was used as mobile phase. Previous stability studies showed that the mobile phase was stable for minimum 7 days.
Mobile phase no. 2: 1-butanol:50% formic acid (2:1). Mobile phase no. 3: 2-propanol:acetic acid (2:1). Mobile phase no. 8: 1-propanol:25% ammonia (11:9).
2.3.6 Development and drying of TLC plates
To saturate the chamber, 22.5 ml mobile phase was placed in each flat-bottomed TLC chamber for 10 x 10 cm plates 30 minutes before the development of the TLC plate. The chamber was sealed with parafilm and covered with a steel lid. The plates were developed over a path of 8 cm. The TLC plates were air-dried at room-temperature for minimum 1 hour before derivatisation.
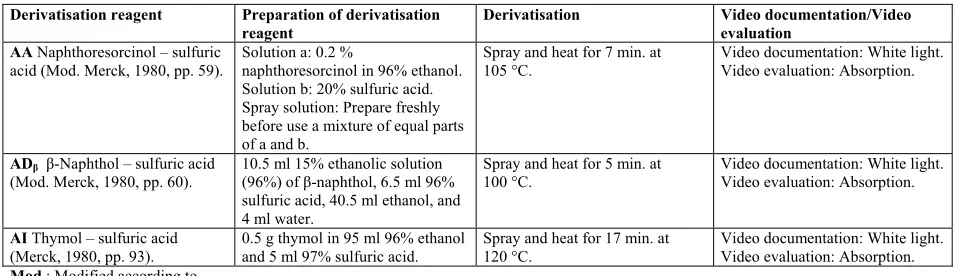
2.3.7 Preparation of derivatisation reagents
The preparation of the derivatisation reagents is described in Table 7-14.
Table7: Derivatisation reagents for detection of carbohydrates.
Derivatisation reagent Preparation of derivatisation
reagent
Derivatisation Video documentation/Video
evaluation AA Naphthoresorcinol – sulfuric
acid (Mod. Merck, 1980, pp. 59).
Solution a: 0.2 %
naphthoresorcinol in 96% ethanol. Solution b: 20% sulfuric acid. Spray solution: Prepare freshly before use a mixture of equal parts of a and b.
Spray and heat for 7 min. at 105 °C.
Video documentation: White light. Video evaluation: Absorption.
ADβ β-Naphthol – sulfuric acid
(Mod. Merck, 1980, pp. 60).
10.5 ml 15% ethanolic solution (96%) of β-naphthol, 6.5 ml 96% sulfuric acid, 40.5 ml ethanol, and 4 ml water.
Spray and heat for 5 min. at 100 °C.
Video documentation: White light. Video evaluation: Absorption.
AI Thymol – sulfuric acid (Merck, 1980, pp. 93).
0.5 g thymol in 95 ml 96% ethanol and 5 ml 97% sulfuric acid.
Spray and heat for 17 min. at 120 °C.
Video documentation: White light. Video evaluation: Absorption.
[image:27.595.66.544.466.604.2]Mod.: Modified according to.
Table 8: Derivatisation reagents for detection of P-containing compounds.
Derivatisation reagent Preparation of derivatisation
reagent Derivatisation Video evaluation documentation/Video
BH Ammonium molybdate - tin(II)chloride (Mod. Merck, 1980, pp. 5).
Solution a: 1% ammonium molybdate in water.
Solution b: 1% tin(II)chloride in 10% hydrochloric acid.
Spray with a and wait for 5 min. before spraying with b.
Video documentation: White light. Video evaluation: Fluorescence.
BI Cobalt(II)chloride (Mod. Merck, 1980, pp. 21).
1% cobalt(II)chloride in 96% ethanol.
Table 9: Derivatisation reagents for detection of N-containing compounds.
Derivatisation reagent Preparation of derivatisation
reagent
Derivatisation Video documentation/Video
evaluation AL Fluorescein – ammonia
(Merck, 1980, pp. 41).
0.005% fluorescein in 0.5 N ammonia solution.
Spray. Video documentation: UV-254 and UV-366 light.
Video evaluation:
Absorption with UV-254 light and fluorescence with UV-366 light.
C Ninhydrin (Mod. Merck, 1980, pp. 61).
Dip solution: 0.5% ninhydrin and 3% glacial acetic acid in 96% ethanol.
Stab. solution: 1 ml saturated aqueous copper(II)nitrate solution in 0.2 ml 10% nitric acid and 100 ml abs. ethanol.
Dip and heat for 2 min. at 110 °C. Dip into stab. solution.
Video documentation: White light. Video evaluation: Absorption.
E Bismuth(III)nitrate – potassium iodide (Mod. Merck, 1980, pp. 39; Wagner et al., 1984, pp. 301).
Solution a: 0.85 g bismuth (III)nitrate in 10 ml glacial acetic acid and 40 ml water.
Solution b: 8 g potassium iodide in 20 ml water.
Stock solution: Mix equal parts of a and b.
Spray solution: Mix freshly 1 ml stock solution with 2 ml glacial acetic acid and 10 ml water before use.
Stab. solution: 5% sodium nitrite in water.
Spray with spray solution, wait for 5 min. and spray with stab. solution.
Video documentation: White light, immediately after derivatisation. Video evaluation: Absorption.
[image:28.595.67.542.389.649.2]Mod.: Modified according to.
Table 10: Derivatisation reagents for detection of organic acids and lipids.
Derivatisation reagent Preparation of derivatisation
reagent
Derivatisation Video documentation/Video
evaluation AN Bromocresol green
-bromophenol blue – potassium permanganate (Mod. Merck, 1980, pp. 12).
Solution a: 0.075% bromocresol green and 0.025% bromophenol blue in 96% ethanol.
Solution b: 0.25% potassium permanganate and 0.5 % sodium carbonate in water.
Spray solution: Prepare immediately before use a mixture of 9 parts of a and 1 part of b. The solution is stable for 5-10 min. only.
Spray. Video documentation: White light. Video evaluation: Absorption.
AV 2’,7’-Dichlorofluorescein (Mod. Merck, 1980, pp. 26).
0.2 % 2’,7’-dichlorofluorescein in 96% ethanol.
Spray. Video documentation: UV-366 light.
Video evaluation : Fluorescence.
AX Fluorescein (Mod. Merck, 1980, pp. 41).
0.01% fluorescein in 96% ethanol. Spray. Video documentation: UV-366 light.
Video evaluation: Fluorescence.
AY Rhodamine 6 G (Mod. Merck, 1980, pp. 77).
0.001% rhodamine 6 G in 96% ethanol.
Spray. Video documentation: UV-366 light.
Video evaluation: Fluorescence.
G Rhodamine B (Mod. Merck, 1980, pp. 77).
0.1% rhodamine B in 96% ethanol. Spray. Video documentation: UV-366 light.
Video evaluation: Fluorescence.
N Bromocresol green (Merck, 1980, pp. 12).
0.05% bromocresol green in 96% ethanol.
Spray. Video documentation: White light. Video evaluation: Absorption.
Mod.: Modified according to.
Table 11: Derivatisation reagents for detection of alcohols and phenolic compounds.
Derivatisation reagent Preparation of derivatisation
reagent
Derivatisation Video documentation/Video
evaluation V Iron(III)chloride (Merck, 1980,
pp. 50).
5% iron(III)chloride in 0.5 mol/L hydrochloric acid.
Spray. Video documentation: White light. Video evaluation: Absorption.
[image:28.595.64.546.680.725.2]Table 12: Derivatisation reagents for detection of S-containing compounds.
Derivatisation reagent Preparation of derivatisation
reagent
Derivatisation Video documentation/Video
evaluation AÅ Methylene blue (Mod. Merck,
1980, pp. 56).
Solution a: 0.025% methylene blue in 0.025 mol/L sulfuric acid. Spray solution: Mix equal parts of a and 96% ethanol.
Spray. Video documentation: UV-366 light.
Video evaluation: Fluorescence.
BG Palladium(II)chloride (Merck, 1980, pp. 60).
0.5% palladium(II)chloride in water containing a few drops 25% hydrochloric acid.
Spray. Video documentation: UV-366 light.
Video evaluation: Fluorescence.
[image:29.595.68.547.218.347.2]Mod.: Modified according to.
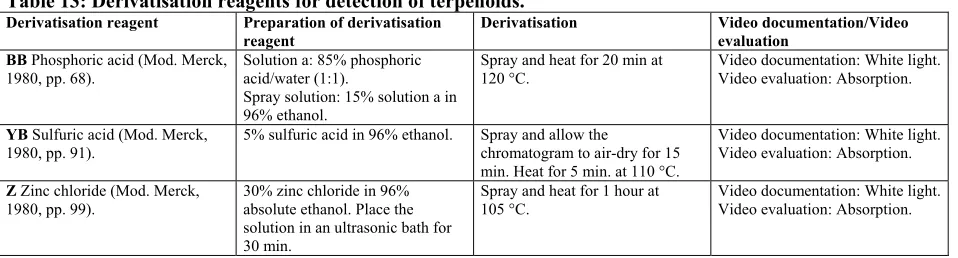
Table 13: Derivatisation reagents for detection of terpenoids.
Derivatisation reagent Preparation of derivatisation
reagent
Derivatisation Video documentation/Video
evaluation BB Phosphoric acid (Mod. Merck,
1980, pp. 68).
Solution a: 85% phosphoric acid/water (1:1).
Spray solution: 15% solution a in 96% ethanol.
Spray and heat for 20 min at 120 °C.
Video documentation: White light. Video evaluation: Absorption.
YB Sulfuric acid (Mod. Merck, 1980, pp. 91).
5% sulfuric acid in 96% ethanol. Spray and allow the
chromatogram to air-dry for 15 min. Heat for 5 min. at 110 °C.
Video documentation: White light. Video evaluation: Absorption.
Z Zinc chloride (Mod. Merck, 1980, pp. 99).
30% zinc chloride in 96% absolute ethanol. Place the solution in an ultrasonic bath for 30 min.
Spray and heat for 1 hour at 105 °C.
Video documentation: White light. Video evaluation: Absorption.
Mod.: Modified according to.
Table 14: Derivatisation reagents for detection of several groups of compounds.
Derivatisation reagent Preparation of derivatisation
reagent Derivatisation Video evaluation documentation/Video
A Vanillin – sulfuric acid (Mod. Merck, 1980, pp. 98).
Solution a: 50% sulfuric acid in 96% ethanol.
Solution b: 2% vanillin in 96% ethanol.
Spray solution: Prepare freshly before use a mixture of 1 part of a to 10 parts of b.
Dip and heat for 3 min. at 120 °C. Video documentation: White light.
Video evaluation: Absorption.
B Diphenylboric acid
2-amino ethylester (Mod. Merck, 1980, pp. 36).
1% diphenylboric acid 2-amino ethylester in 5% polyethyleneglycol 4000 in 96% ethanol.
Spray. Video documentation: UV-366 light.
Video evaluation: Fluorescence.
BC Iodine – potassium iodide (Merck, 1980, pp. 49).
0.2 % iodine and 0.4% potassium iodide in water.
Spray. Video documentation: White light, immediately after derivatisation.
Video evaluation: Absorption.
F Molybdatophosphoric acid (Mod. Merck, 1980, pp. 57).
10% molybdatophosphoric acid in 96% ethanol.
Dip and heat for 3 min. at 120 °C. Treat with ammonia vapour for 3 min.
Video documentation: White light.
Video evaluation: Absorption.
I Anisaldehyde – sulfuric acid (Mod. Merck, 1980, pp. 6).
0.5 ml anisaldehyde in 10 ml glacial acetic acid, 85 ml abs. ethanol, and 5 ml 97% sulfuric acid.
Dip and heat for 5 min. at 100 °C. Video documentation: White light.
Video evaluation: Absorption.
R Silver nitrate – ammonia (Mod. Merck, 1980, pp. 78).
2.08% silver nitrate in 96% ethanol.
Treat with ammonia vapour for 5 min. before dipping. Dip and heat for 7 min. at 105 °C.
Video documentation: White light.
Video evaluation: Absorption.
Mod.: Modified according to.
[image:29.595.68.542.393.649.2]2.3.8 Derivatisation by spraying
The derivatisation reagents were transferred to either plastic bottles with screw caps with dosing holes or glass sprayers attached to a compressed air line and sprayed onto the TLC plate.
2.3.9 Derivatisation by dipping
The derivatisation reagents were poured into glass dipping chambers for 20 x 20 cm TLC plates and the TLC plates were dipped into the reagent for 2 sec.
2.3.10 Post-treatment of derivatized TLC plates
Several of the derivatisation reagents need heating to obtain a colour reaction. Therefore, the TLC plates were placed on a TLC plate heater. The heating times and temperatures are presented in Table 7-14.
2.3.11 Video documentation
The TLC plates were air-dried for 30 minutes before they were photographed and stored digitally. TLC plates treated with derivatisation reagent E (Bismuth(III)nitrate - potassium iodide) and BC (Iodine - potassium iodide) respectively, had to be photographed immediately after derivatisation because single spots or all the zones underwent very rapid colour change. On the Reprostar 3, the desired illumination, UV-254, UV-366 or white light was chosen. Regarding illumination, see Table 7-14. When using UV-366 for fluorescence, the camera UV blocking filter was inserted to produce true colours of the image. The TLC plate was displayed on the monitor as a “live” image. All the adjustments were made until the optimum was reached. The image was then photographed and stored.
2.3.12 Video evaluation
The digital images of the chromatograms were evaluated with the program CAMAG VideoScan. The desired image file was opened and a number of plate properties were selected. The type of image, fluorescence or absorption, was chosen depending on the colour of the TLC plate and the colour of the spots. Image types are presented in Table 7-14. The number of tracks to be
The selected individual track was transformed into its corresponding analog curve with belonging peak properties (Rf value, peak height and/or peak area) and computed.
2.3.13 Evaluation of the results
The captured image was subjected to a visual inspection on the computer screen. Differences in concentration of a compounds found in the different cultivation methods were evaluated to be 25%, 50%, 75% or 100%, and this was noted as +, ++, +++ and ++++, where each + signify a difference of 25%.
2.3.14 Presentation of the results
2.3.15 Illustration of the screening process
[image:32.595.128.555.150.719.2]The different steps in the screening process are presented in Figure 4 below.
Figure 4: The screening process.
Plant material, apples Preparation of juice, apples Centrifuging of juice, apples
Preparation of TLC plates Preparation of mobile phases
Application on TLC plates
Development of TLC plates Drying of TLC plates
Derivatization by spraying Derivatization by dipping Post-treatment, heating
Video documentation
Video evaluation
Sample preparation
Preparation of TLC plates and mobile
phases
Sample application
Development and drying of TLC plates
Derivatization
Video documentation
3 Results and discussion
The presentation of this is divided in two parts. First the screening programme will be presented. Secondly, the results of the screening of the individual crops will be presentedand discussed.
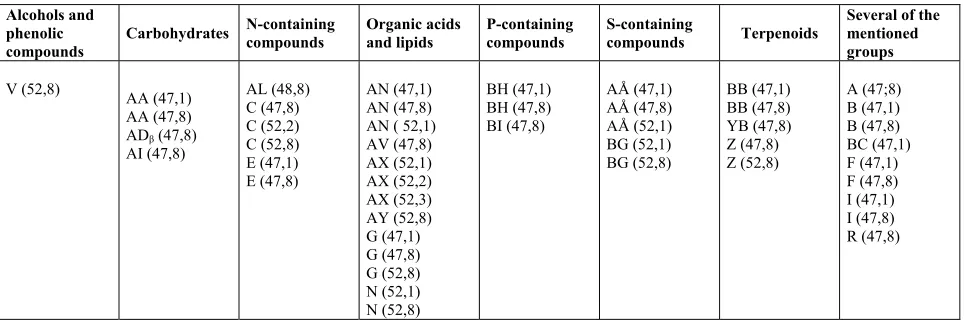
3.1.1 Screening programme
[image:33.595.66.560.295.407.2]The screening programme, developed on the basis of potatoes (S. tuberosum L.), is presented in Table 15.
Table 15: Screening programme.
Alcohols and phenolic compounds
Carbohydrates N-containing compounds Organic acids and lipids P-containing compounds S-containing compounds Terpenoids
Several of the mentioned
groups
V (52,8) AA (47,1) AA (47,8) ADβ (47,8)
AI (47,8) C (47,8) C (52,2) C (52,8) E (47,1) E (47,8) AN (47,1) AN (47,8) AN ( 52,1) AX (52,1) AX (52,2) G (47,1) G (47,8) G (52,8) N (52,1) BH (47,1) BH (47,8) BI (47,8) AÅ (47,1) AÅ (47,8) BG (52,1) BG (52,8) BB (47,1) BB (47,8) YB (47,8) A (47;8) B (47,1) B (47,8) F (47,1) F (47,8) I (47,1) I (47,8)
Capital letter: Indicates the derivatisation reagent, see table 16; Numbers in brackets: Indicate the stationary- and mobile phase; 1
:1-butanol:acetic acid:water (4:1:5), upper phase; 2:1-butanol: 50% formic acid (2:1); 8:1-propanol: 25%ammonia (11:9); 47: Silica gel 60, HPTLC aluminium sheets; 48: Silica gel 60 F254, HPTLC aluminium sheets; 52: Cellulose, TLC aluminium sheets.
3.1.1.1 Modification of the derivatisation reagents
Many of the derivatisation reagents were modified in relation to the literature. These
modifications were done primarily since the solvents were toxic and easily could be replaced by less toxic solvents. As an example, methanol, being poisonous (Arbejdspladsbrugsanvisning, 1998), was replaced by 96% ethanol in derivatisation reagent BB (phosphoric acid).
3.1.1.2 Classification and specificity of the derivatisation reagents
Table 16: Classification of phytochemical compounds.
Alcohols and phenolic compounds
Carbohydrates N-containing
compounds Organic acids and lipids P-containing compounds S-containing compounds Terpenoids
- alcohols, phenols, phenolic acids and phenolic ketones
- phenylpropanoids and derivatives - flavonoids and others
- mono-, oligo- and polysaccarides - sugar alcohols and others
- amino acids, amines, amino sugars - alkaloids - purines and pyrimidines, and other N-containing compounds
- mono-, di- and tricarboxylacids etc.
- triglycerides, phospholipids, and glycolipids - unsaturated and saturated derivatives and others
- phospholipids and other P-containing compounds - S-containing amino acids - sulfonamides - thiophosphate esters
- sulfate esters of steroids and other S-containing compounds - Monoterpenes, diterpenes, triterpenes, and sesquiterpenes - steroids - carotenoids and others
A literature search was carried out with the aim to identify the groups of phytochemical compounds detected by the individual derivatisation reagents, see Table 17. This was accomplished on the basis of the following literature:
- 1. CBS Camag Bibliography Service Planar Chromatography (CAMAG, 2000) - 2. Dyeing reagents for Thin Layer and Paper Chromatography (Merck, 1980) - 3. Thin Layer Chromatography (Stahl, 1969), and
- 4. Plant Drug Analysis (Wagner et al., 1984).
The literature search revealed that only few derivatisation reagents were specific, see Table 17. The majority of the derivatisation reagents detected many different groups of phytochemical compounds. Nevertheless, the derivatisation reagents were tried classified according to the group of phytochemical compounds predominantly detected, according to the literature, see Table 18. As an example, derivatisation reagent AX (fluorescein) detected organic acids and lipids and was therefore placed in this group, see Table 18. When a derivatisation reagent detects more than one phytochemical group and only one of the mentioned references described the detection of each phytochemical group, the derivatisation reagent was placed in the group “Several of the
mentioned groups”.
Derivatisation reagent F (molybdatophosphoric acid) detected organic acids and lipids according to CBS (CAMAG, 2000), Merck (Merck, 1980, pp. 57), and Stahl (Stahl, 1969, pp. 887), as well as terpenoids according to Merck (Merck, 1980, pp. 57), Stahl (Stahl, 1969, pp. 887), and
Table 17: Derivatisation reagents used to detect different groups of phytochemical compounds.
Derivatisation reagent Alcohols and
phenolic compounds
Carbo-
hydrates N-containing
compounds
Organic acids and lipids
P-containing
compounds S-containing compounds Terpenoids
A: Vanillin – sulfuric acid X1,2,3,4 X1 X1,2,3,4
AA: Naphthoresorcinol – sulfuric acid
X2,3
AÅ: Methylene blue X2,3
ADβ: β-Naphthol – sulfuric acid X2,3
AI: Thymol – sulfuric acid X 1 X1,2,3
AL: Fluorescein – ammonia X2,3
AN: Bromocresol green – bromophenol blue – potassium permanganate
X2,3
AV: 2,7-Dichlorofluorescein X1 X1,2,3 X1
AX: Fluorescein X1,2,3
AY: Rhodamine 6 G X1,2,3 X1
B: Diphenylboric acid 2-aminoethylester
X 1,2,3 X1,2,3,4
BB: Phosphoric acid X1 X1 X1,2,3
BC: Iodine – potassium iodide X3 X1
BH: Ammonium molybdate – tin(II)chloride
X2
BI: Cobalt(II)chloride X1 X2,3
BG: Palladium(II)chloride X2,3
C: Ninhydrin X1 X1,2,3,4 X 1 X1
E: Bismuth(III)nitrate – potassium iodide
X1,2,3,4 X1 X1
F: Molybdatophosphoric acid X1,2,3 X2,3,4
G: Rhodamine B X1,2,3
I: Anisaldehyde – sulfuric acid X1,2,3 X1 X1,2,3,4
N: Bromocresol green X1 X2 X1,2
R: Silver nitrate – ammonia X1 X1 X3 X1 X3
V: Iron(III)chloride X1,2,3,4 X1
YB: Sulfuric acid X1 X1 X1 X 1,2,3,4
Z: Zinc chloride X 2,3
1: CAMAG, 2000; 2: Merck, 1980; 3: Stahl, 1969; 4: Wagner et al., 1984.