This paper is a postprint of a paper submitted to and accepted for publication in IET Intelligent Transport Systems and is subject to Institution of Engineering and Technology Copyright. The copy of record is available at IET Digital Library.
Official URL: http://dx.doi.org/10.1049/iet-its:20060059
The full citation for this paper is:
Hounsell, N. B., Shrestha, B. P., McLeod, F. N., Palmer, S., Bowen, T. and Head, J.R. (2007) Using global positioning system for bus priority in London: traffic signals close to bus stops. IET Intelligent Transport Systems, 1, (2), 131-137.
USING GPS FOR BUS PRIORITY IN LONDON: TRAFFIC
SIGNALS CLOSE TO BUS STOPS
N. B. Hounsell*, B. P. Shrestha*, F. N. McLeod*, S. Palmer^, T. Bowen^, J. R. Head+
*Transportation Research Group, University of Southampton Southampton, United Kingdom
Email: [email protected]
Tel: +44 (0) 2380593705; Fax +44(0)2380593152 ^Bus Priority Team, Surface Transport, Transport for London
London, United Kingdom +
Consultant to Bus Priority Team, Transport for London London, United Kingdom
Abstract
London's bus network is one of the largest and most comprehensive urban transport systems in the world. The contribution of buses is recognised by implementing a series of initiatives including bus priority at traffic signals. London has a long history of the implementation of bus priority at traffic signals. It has kept pace with the development of new technologies by updating its bus priority system. Now, London is moving towards a bus management system based on GPS (Global Positioning System) which will also be used to provide bus priority at traffic signals. This paper describes theoretical work carried out by TRG on behalf of Transport for London Bus Priority Team to tackle the challenge posed by locational error associated with GPS where a traffic signal is close to a bus stop.
Keywords
Bus priority, Traffic signal, Selective Vehicle Detection (SVD)
1 Background
London's bus network is one of the largest and most comprehensive urban transport systems in the world. Every weekday over 6,800 scheduled buses carry around six million passengers on over 700 different routes [1]. The contribution of buses is recognised by implementing a series of initiatives to help them, which include: modern buses (e.g. ‘bendy buses’); improved ticketing, improved enforcement of parking restrictions and bus lanes; congestion charging; automatic vehicle location system and bus priority at traffic signals. Among these initiatives, bus priority at traffic signals plays a valuable role in reducing delays.
information at bus stops. The beacon system solved some of the drawbacks of loop detectors (e.g. vulnerability of the loop to damage) [3], but is still a rigid system with costly installation, maintenance and repositioning (if needed).
With the availability of vehicle location systems based on GPS, Transport for London is now investing in a new system for fleet management, passenger information, and bus priority based on GPS and supporting technologies for bus location. The new system is known as iBUS and is being supplied by Siemens VDO. The result of eliminating on-street hardware for detecting buses is that the incremental cost of installing bus priority at signals is much lower than with previous systems. It now becomes economic to fit bus priority at junctions where benefits are small in absolute terms. It is anticipated that all but a few signals on London will be fitted, leading to a major improvement to bus priority at traffic signals.
Since the use of GPS removes the need of field installation of a detector, it provides more flexibility and opportunity for using bus detectors. That makes it now feasible to use more than one detector per approach, if required. Such extra detectors can be used as an exit detector to curtail green after a bus crosses the stopline and/or a secondary detector to review the bus priority decision near to the stopline. The use of a secondary detector improves the estimation of the bus arrival time at the stopline and makes the bus priority system more efficient [9]. Such application can be very useful where there is more variability in the bus travel time on the link. Similarly, the use of an exit detector removes the green extension time which remains after a bus crosses the stopline. Such an application improves the efficiency of the junction and reduces the burden on traffic in the non-priority stage. The application of an exit detector can be further extended to hold a green extension until the bus crosses the stopline. The issue of exit detection is further discussed later in this paper.
Despite its advantages, bus location based on GPS is inevitably less accurate than location based on fixed infrastructure (inductive loops or beacons) Whilst an accuracy of typically +/- 10 metres may be sufficient for most functions, it could become critical for bus priority at traffic signals, where greater precision may be required [4]. For example, a locational error could result in some buses being incorrectly located further away from the junction than they actually are, so that they may miss the given priority action, particularly green extensions. This problem is critical at places with a bus stop close to the traffic signal where priority may be triggered incorrectly (due to locational error) while a bus is still stopped at the bus stop.
To minimise the adverse effects of locational error, additional detection techniques can be used. This paper explores the possibility of using some additional techniques to aid bus priority where the traffic signal is close to a bus stop. With the iBUS system, many traffic signal approaches will have bus priority fitted where there is a bus stop close to the stopline. Under these circumstances, any improvements which can be obtained in the method of detecting buses would be worthwhile.
2 GPS based bus priority system
field. This form of detection is known as “virtual detection”. The predefined virtual detector locations are compared with the location of the bus obtained from GPS to trigger detection and to activate priority.
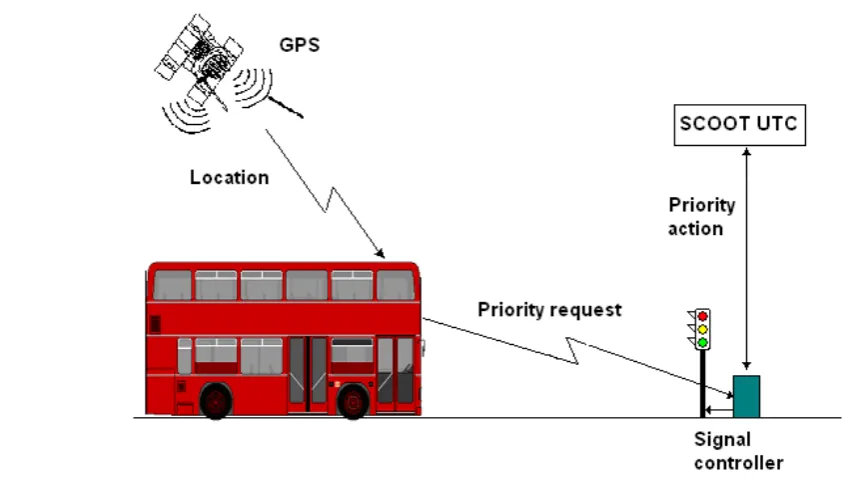
[image:4.595.67.496.215.464.2]Various bus priority architectures and ways in which GPS can be used have been described and discussed in earlier literature [5]. In its simplest set up, a bus is detected using its GPS location software and the priority is activated. This simple representation of GPS use in bus priority at traffic signals controlled by SCOOT UTC [6] is shown in Figure 1.
Figure 1 - A simple representation of bus priority at traffic signals using GPS
In this setup, the role of GPS is to detect buses at a predefined location on the approach to a traffic signal. Here, a bus regularly gets its location (e.g. every second) from a GPS receiver (which sometimes may be aided with additional equipment to supplement it). The GPS location is compared with the pre-defined location of the next detection point (virtual detector) stored in the on-board computer. Once a bus is found at the pre-defined virtual detector location, a priority request is sent to the traffic controller.
fact that journey time variability is catered for whether or not GPS error is there. The added variability due to GPS locational error is lesser where there is already bigger journey time variability. Building on this research, further research was undertaken to study the effect of locational error in the case when there is a bus stop close to the traffic signals. This paper concentrates particularly on this situation.
3 Bus priority at traffic signals close to bus stops
In the present system of bus priority operated in London, detectors are always placed downstream of bus stops, as otherwise it would be difficult to estimate the bus travel time from detector to traffic signal stopline accurately due to variability of bus dwell times at the bus stop. If detection was based purely on GPS-based location and placed just downstream of the bus stop, the GPS error may result in detecting buses which are stopped at the bus stop and triggering priority too soon. It is therefore necessary to place the virtual detector at a safe distance downstream of the bus stop to avoid detecting buses stopped at the bus stop. However, this requirement reduces the detector distance to the traffic signal, which reduces priority benefits. This becomes most critical when a bus stop is very close to the traffic signal and the locational error is large.
[image:5.595.75.512.479.621.2]To minimise the adverse effects of locational error, additional detection techniques can be used. One such possibility is the use of a bus stop zone concept with door-closing sensor technology on the bus (such as is available with iBUS). The bus stop zone ensures that buses are in the pre-defined range and the door-closing sensor indicates that the bus is probably about to leave the stop. This combination allows buses to be detected close to the bus stop and as soon as they start moving from the stop. A typical definition of a bus stop zone used in this study is shown in Figure 2. Here, “flag” refers to the location of the bus stop pole on the street which is generally the point at which the front door of the buses would be opened. Each stop has a zone defined around the flag, where buses stop to allow passengers to get on or off the bus.
Figure 2 - Definition of stop zone for bus stops near traffic signals
4 Methodology of the study
The study of the impacts of GPS for bus location for bus priority purposes, summarised in this paper, was based on simulation modelling using TRG’s microscopic simulation model, SIMBOL [8]. SIMBOL has been designed specifically to model alternative bus priority strategies at traffic signals, including a simple representation of general traffic. The model provides options to investigate the impact of bus priority on general traffic and vice-versa in detail without the influence of the randomness associated with general traffic behaviour. This model has been used in TRG for various bus priority studies (e.g. [9] and [10]) in the last few years.
This study was based on the modelling of a signalised junction with two conflicting approach roads: a main road and a side road, with buses on the main road only. The traffic signal modelled here was a fixed time signal with 2-stage signal operation, a cycle time of 80 seconds, inter-green periods of 10 seconds and effective green durations of 40 seconds and 20 seconds for the two stages. Priority was given to buses in the form of “extensions” and “recalls” for individually detected buses, based on the estimated arrival time of the bus at the traffic signal. These facilities, and the controlling parameters, were those used currently for bus priority in the SCOOT UTC system. The maximum extension allowed (known as bauth)
was set to 20 seconds. Typically the actual degree of saturation was 80% and a target saturation parameter of 110% was used for recalls, resulting in a maximum amount of time gained for the bus of 5 seconds through recalls. Cars were generated on both approaches to the junction at regular intervals with flow values of 1440 vehicles/hour on the main road and 720 vehicles/hour on the side road.
The priority needed was calculated from the estimated arrival time of a bus at the traffic signal. This estimation of arrival time at the traffic signal from the detection point was based on two SCOOT parameters [6]: average bus journey time (bjyt) and busvary. Bjyt is the average free-flow bus journey time between the detection point and the signal stopline.
Busvary is the amount of time added to bjyt as a safety margin to allow for bus journey time variability on the link. Typically, busvary is specified as a few seconds depending on the distance between a bus detector and the stopline.
4.1 Bus stopping locations at a bus stop
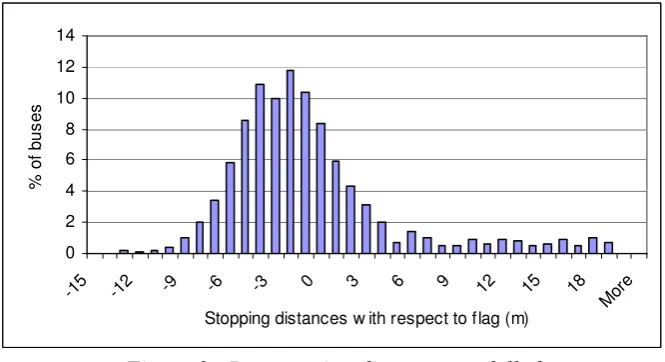
To take account of the buses not stopping exactly at the flag post of a bus stop zone, buses were stopped at different places within a zone. The stopping distances with respect to the flag location were sampled from a bus stopping profile (Figure 3) based on data obtained from field surveys [13].
0 2 4 6 8 10 12 14
-15 -12 -9 -6 -3 0 3 6 9 12 15 18
Mor e
Stopping distances w ith respect to flag (m)
%
o
f
b
u
s
e
[image:7.595.131.464.166.347.2]s
Figure 3 - Bus stopping distances modelled
[Note:Negative values are downstream of the flag, positive values are upstream.]
4.2 Bus journey time downstream of bus stop
When a bus starts moving away from the bus stop it has to accelerate to reach its running speed. As a result, the average bus speed downstream of the bus stop will be lower for a bus that has stopped at the bus stop than for a bus which has not stopped. Since SIMBOL uses average speed to model the journey time of a bus, the average speed will be lower for the short distance between the detector downstream of the bus stop and the stopline. This was taken into account by reducing the average link speed to 5 metres/second (18 km/hr) for the distance downstream of a bus stop instead of the default value of 10 m/s (36km/hr), used upstream of the bus stop. This reduced speed was obtained from field data collected in July 2005 [13]. The variation of bus journey time was modelled by sampling from a Normal distribution (mean = average journey time and standard deviation = 30% of average journey time). These values were again based on the journey time data collected. The busvary needed to estimate bus arrival time at the stopline was calculated as 1.6 times the standard deviation of the journey time. This ensured that around 95% of buses arrived at the traffic signal within the estimated time.
4.3 Bus stop zone
5 Detection methods
To explore the effect of locational error and to find ways of improving performance in such conditions, different methods of triggering bus priority were modelled and compared in this study. These methods, summarised below, were:
• Beacon detection
• Virtual detector downstream of a bus stop (VD) • Door-closing sensor (DS)
• Virtual detector aided with door-closing sensor (VD+DS)
5.1 Beacon detection
This was the modelling of the existing method of detection, using beacons, and was considered to be the base case for comparison with other detection methods. A beacon was placed 6m downstream of the flag, which was consistent with existing typical practice in London. A bus is detected once it reaches the beacon position and a priority request is then triggered. It is noted that since buses stopped at various locations within a bus stop zone, some buses may have been detected by a beacon while being at a bus stop.
5.2 Virtual detection downstream of a bus stop
This applies to GPS-based systems where buses are detected using virtual detectors (VD). The detection is based on the GPS locations of buses rather than their actual locations. Virtual detectors were modelled for two separate locations to explore the effects of GPS error on their performance. These two different positions of a detector downstream of a bus stop were: − the same position as the beacon (6m downstream of flag)
− two standard deviations of GPS error further downstream of the beacon location.
These two separate positions of a virtual detector were modelled to compare and confirm the necessity of moving the virtual detector further downstream when used without the aid of door-closing information. This was assumed to be necessary to ensure that most buses are not detected while being at the bus stop. In the simulations of this case, a virtual detector was placed at 16m downstream of the flag position for a GPS error standard deviation of 5m.
5.3 Door-closing sensor
This is the modelling of additional technology to assist the GPS system at bus stops. GPS is used to confirm that the bus has stopped within the bus stop zone and a priority request is then triggered one second after the bus starts to move away from the bus stop. This is to try to ensure that the bus has actually moved away and does not stop again. Since the priority is triggered just after a bus moves from a bus stop, the distance between the trigger point and the stopline differs from one bus to another, depending on their stopping locations. Even though the bus priority is triggered from various locations, the bus journey time to the stopline (bjyt) was estimated based on the fixed distance between the flag and the stopline. This created extra variability in the journey time of buses to the stopline which needed to be accounted for in the busvary value used. The busvary value was increased by 2s here to cover an extra 20m upstream of the flag position (i.e. up to the upstream end of the bus stop zone).
5.4 Door-closing sensor and virtual detector combination
placed at the beacon location (6m downstream of the flag); however, priority is only triggered if the door-closing sensor has already been triggered to ensure that the bus had moved away from the bus stop. The potential benefits of this method are:
• The virtual detector can be sited close to the bus stop without having the problem of detecting buses which are stationary at the bus stop; and
• This avoids the need of a bigger busvary value to take account of the buses stopping much further upstream of the flag.
6 Simulation results
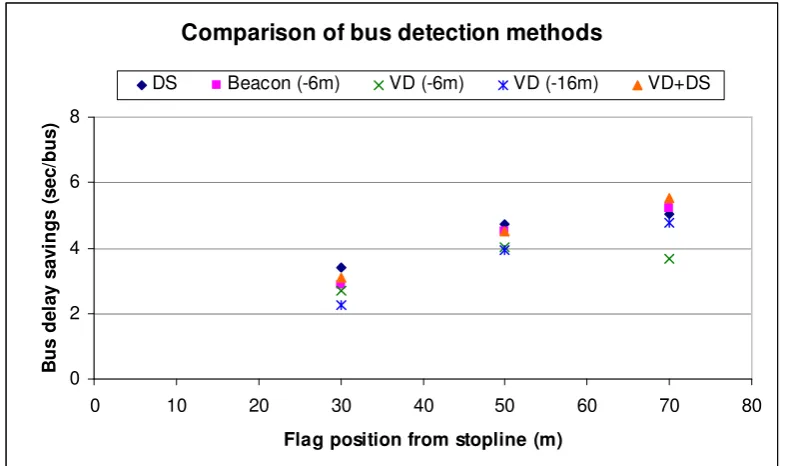
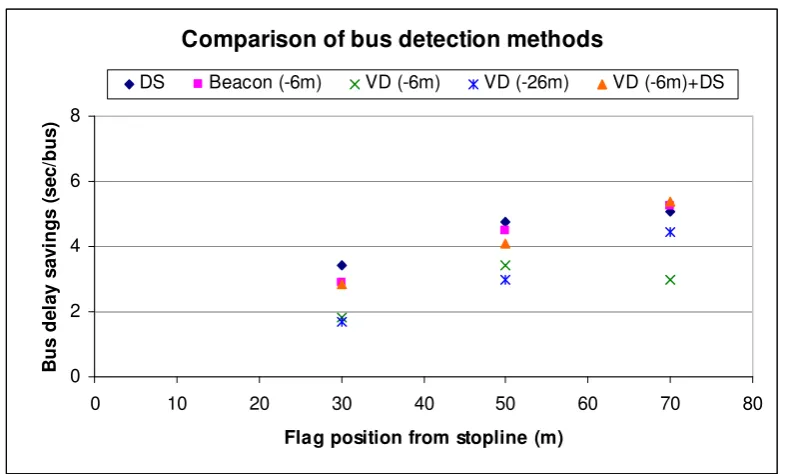
Simulations were carried out for the various detection methods described above and for different flag positions relative to the downstream traffic signal. Results in this paper are for a bus flow of 40 buses per hour generated according to a shifted negative exponential distribution with a mean bus headway of 90 seconds, a minimum headway of 45 seconds and a standard deviation of 45 seconds. This arrival distribution was chosen to ensure that buses would arrive at a random time within the signal cycle and to disallow bus bunching, to simplify understanding of the control strategy effects at this stage. Sample results for different methods of triggering priority for different locations of bus stop flag are shown in Figure 4a (GPS error standard deviation (SD) = 5m) and Figure 4b (GPS error SD = 10m).
Comparison of bus detection methods
0 2 4 6 8
0 10 20 30 40 50 60 70 80
Flag position from stopline (m)
B
u
s
d
e
la
y
s
a
v
in
g
s
(
s
e
c
/b
u
s
)
DS Beacon (-6m) VD (-6m) VD (-16m) VD+DS
Figure 4a - Bus delay savings from different methods of detection (GPS error SD=5m)
Key: DS = door-closing sensor, VD= virtual detector
Detectors either 6m or 16m downstream of flag position as indicated
The level of average bus delay savings seen here is consistent with those recorded in the field across a number of trials in London. However, the main interest here is in the relative effects between the different detection methods and flag positions. With this emphasis, it can be seen in Figure 4a that:
[image:9.595.101.496.344.577.2]• The virtual detector at two standard deviations downstream of the beacon gave smaller benefits, especially at shorter flag distances. This reduction was expected, as the detector distance was reduced by 10m.
• The virtual detector at the same place as the beacon (6m downstream of the flag) also gave lesser benefit as some of the buses were detected and triggered priority whilst still at the bus stop and could not take advantage of the priority given. The delay savings for this method reduced with the increase in the detector distance. This may be due to the increased priority extension activity which suffers more with inaccurate journey time estimation.
• The door-closing sensor-based priority performed well for 30m and 50m flag positions but not so well for the 70m flag position relative to the other methods. The improved performance was due to the fact that buses which stopped upstream of the flag positions had an earlier opportunity to request priority (depending on their stoppage position) with the DS method than with DS+VD. This is similar to an increased detector distance for those buses which stopped upstream of the flag, provided that the sum of bjyt (10s) and
busvary (7s) was within the value of bauth (20s). However, this was not true for the case of 70m, where the sum of bjyt (14s) and busvary (9s) exceeded the value of bauth (20s) (bjyt, busvary and bauth are defined in the “Methodology” section). This meant that some desired extensions would not have been allowed and hence the delay savings is lower than VD+DS.
• The combination of door-closing sensor and virtual detector priority performed strongly for all the flag positions due to:
- the removal of the chance of buses being detected while being at bus stop using the door-closing sensor; and
- the use of a smaller busvary, as buses were detected at a pre-defined position rather than anywhere within the bus stop zone.
Comparison of bus detection methods
0 2 4 6 8
0 10 20 30 40 50 60 70 80
Flag position from stopline (m)
B
u
s
d
e
la
y
s
a
v
in
g
s
(
s
e
c
/b
u
s
)
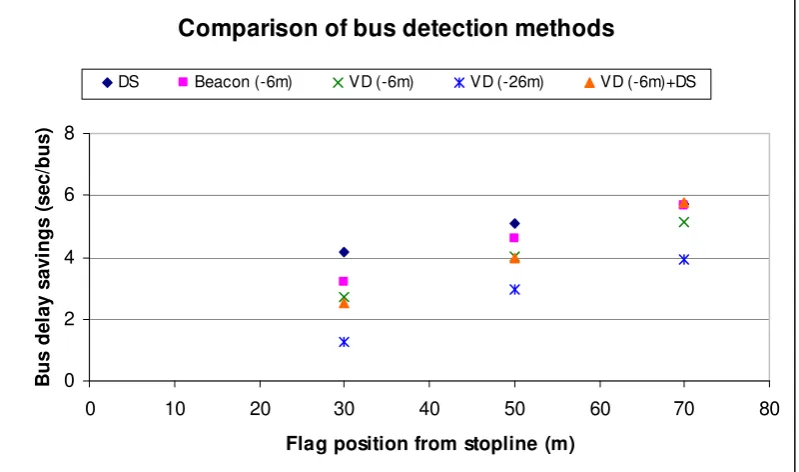
[image:10.595.101.494.483.720.2]DS Beacon (-6m) VD (-6m) VD (-26m) VD (-6m)+DS
The only change in Figure 4b in comparison to Figure 4a is the performance of the detection methods using a virtual detector. Figure 4b shows that:
• The priority benefits from the virtual detector at the position of a beacon (-6m) reduced (in comparison to Figure 4a) with the increase in the GPS locational error. This is due to the increase in the number of buses detected by the virtual detector while still being at the bus stop.
• The performance of the virtual detector at two standard deviations downstream of the beacon (26m downstream of the flag) deteriorated in comparison to Figure 4a with the increase in GPS error. The reduction was mainly due to the reduction in the detection distance.
• The performance the VD+DS detection method reduced slightly, as the GPS error influenced the virtual detection part of this combination method.
Further simulations were carried out for two more bus stopping profiles. These profiles were generated to reflect bus stop situations where bus flow is lower (18 buses/hour) and higher (60 buses/hour) than the situation modelled above. The main difference in these profiles is the percentage of buses stopping upstream of the flag. As the bus flow increased, there were more occasions with more than one bus at the bus stop at the same time, forcing the second bus to stop further back. The different stopping positions of the buses increases the variability of the bus journey time of buses to the stopline. Using these stopping profiles, simulations were undertaken for different methods of triggering priority and for different flag positions relative to the downstream traffic signal. Simulation results showed a similar trend of bus priority benefits from various detection methods. For both of these stopping profiles, the virtual detector alone gave the least bus priority benefits. The door sensor based detection triggering methods (DS and DS+VD) gave the best results, as earlier. The bus delay savings from these triggering methods were slightly better than the beacon-based system. The consistent results from 3 different scenarios showed that the use of additional detection technology does help buses.
6.1 Alternative bus stopping profiles
0 2 4 6 8 10 12 14
-15 -12 -9 -6 -3 0 3 6 9 12 15 18 21 24 27 30
Stopping distances with respect to flag (m)
[image:12.595.105.493.75.244.2]% o f b u s e s
Figure 5: Bus stopping profile shifted by 12m upstream
(Negative values are downstream of the flag, positive values are upstream)
Simulations were carried out using this bus stopping profile for different methods of triggering priority and for different flag positions relative to the downstream traffic signal. As earlier, two levels of GPS locational error were modelled using standard deviations of 5m and 10m. The scenarios were modelled for a bus flow of 40 buses per hour The simulation results for different methods of triggering priority for different locations of bus stop flag are shown in Figure 6a (GPS error SD = 5m) and Figure 6b (GPS error SD = 10m).
Comparison of bus detection methods
0 2 4 6 8
0 10 20 30 40 50 60 70 80
Flag position from stopline (m)
B u s d e la y s a v in g s ( s e c /b u s )
DS Beacon (-6m) VD (-6m) VD (-16m) VD+DS
Figure 6a - Bus delay savings from different methods of detection for shifted profile (GPS error SD=5m)
[image:12.595.105.493.385.618.2]shifted bus stopping profile. In the case of the combined method (VD+DS), there was no improvement because the virtual detector was in the same place as before. An improvement could have been obtained by moving the virtual detector further upstream but this was not modelled here.
Comparison of bus detection methods
0 2 4 6 8
0 10 20 30 40 50 60 70 80
Flag position from stopline (m)
B
u
s
d
e
la
y
s
a
v
in
g
s
(
s
e
c
/b
u
s
)
[image:13.595.99.499.152.388.2]DS Beacon (-6m) VD (-6m) VD (-26m) VD (-6m)+DS
Figure 6b - Bus delay savings from different methods of detection for shifted profile (GPS error SD=10m)
An increase in GPS locational error caused the performance of the detection methods using a virtual detector to deteriorate (Figure 6b). The deterioration was worst for the virtual detector placed at 26m downstream of the flag. This method gave the least bus priority benefit among all the detection methods. This was again due to the reduction in detection distance and corresponding priority extensions. This showed that the effect of the locational error is more severe for the ‘virtual detector only’ method even in the case of shifted profile.
7 Discussion
The simulation results have shown that the detection methods using a door-closing sensor should produce greater bus delay savings than the methods using only beacons or virtual detectors, where a bus stop is close to the traffic signal. The additional cost of such door-closing sensor, supplementing the GPS based system, is minimal when compared to the overall cost of the bus priority system. The overall cost of the bus priority system per junction based on GPS supplemented with door-closing sensor has been estimated as less than half of the cost of a beacon-based system. (Note that the cost per junction is relative to the number of traffic signals and buses).
forward but its progress may be impeded. This kind of behaviour was not modelled here. In other cases, a bus may not stop at a bus stop, and detection based on the door-closing sensor alone would then be ineffective. In practice, therefore, it is suggested that the default method of detection should be the combination of door-close sensor and virtual detector(s).
One advantage of this combined method is that a lower busvary value may be used than for the door-closing sensor method alone. Lower busvary values are of benefit, in general, where the bauth value constrains priority. This consideration resulted in the combined method performing slightly better than the door-closing sensor method alone for the 70m flag position. The combined detection method has the potential advantage of being able to cope with failure of the door-closing sensor by defaulting to using the virtual detector alone. This would prevent buses from not getting any priority at all in the event of door-closing sensor failure. However, the combined method has the potential disadvantage that most buses would send priority requests later than if they used the door-closing method only. This may be why the door-closing sensor method alone gives better results where the bus stop is close to stopline (30m and 50m).
7.1 Further application of virtual detector
Since one of the main advantages of GPS being the provision of extra ‘virtual’ detection points as required (at little cost), additional detectors can be used to make bus priority more efficient. One such detector could be used near the stopline to curtail (cancel) a priority action once the bus has passed through the signals, to avoid any further delay to non-priority traffic. In principle the exit detector could also be used to hold a priority green extension until the bus reaches the exit detector, subject to other constraints (e.g. bauth not exceeded). This second application would be useful for buses which take longer than anticipated to reach the signals.
Simulation results from an earlier study [14] carried out to test the use of an exit detector to hold priority extensions in addition to its existing task of curtailing the extension when a bus is detected are shown in Figure 7. This additional functionality was tested for a case with no GPS error.
Use of exit detector in bus priority at traffic signals
0 2 4 6 8
0 20 40 60 80 100 120 140 160
Primary detector distance (m)
B
u
s
d
e
la
y
s
a
v
in
g
s
(
s
e
c
/b
u
s
)
[image:14.595.94.500.504.745.2]No exit detector Exit detector w ith holding
Figure 7 shows that bus delay savings increased slightly when the exit detector was used to hold extensions for buses. The increase in bus delay savings comes from a reduction in the number of buses missing extensions as a result of the holding actions. The increase in delay savings is greatest at longer detector distances, where there were more buses missing extensions earlier. The impact was minimal at shorter detector distances where there were very few buses missing extensions due to the lower journey time variability. This shows that the use of an exit detector to hold the extension, in addition to curtailing the extension, improves bus delay savings, although it may tend to increase side road delays.
It should be noted that these results apply to the situation where the traffic queue always clears in the green period. Greater benefits for buses might be expected from the use of an exit detector where buses are delayed by other traffic at the end of green.
The position of the exit detector is an important consideration when using GPS technology (Note: exit detector location should also take account of latencies in the traffic control system which is unaffected by GPS locational error and hence not modelled here). Due to GPS locational error there is a danger that if the exit detector is placed at the traffic signal stopline then an extension might be shut down prematurely if the detected bus has not actually passed through the signals. Simulations results showed that the bus delay savings tend to be reduced when the exit detector is placed at the stopline for this reason. This problem can be countered by placing the exit detector downstream of the signals by a distance up to the maximum detection error anticipated.
8 Conclusions
Bus priority has been operating successfully across London for many years, but the technology is ageing. The new GPS-based bus location system just procured for London (iBUS) gives opportunities for improved priority operations, but introduces challenges related to the potential bus locational accuracy. This is especially critical when a bus stop is close to the traffic signals. This study has illustrated how additional technologies can assist the GPS system. In particular, it has been shown that:
• The effect of GPS locational error can be minimised and the performance can be enhanced, even where a bus stop exists close to a junction, by using door-close sensors to assist the GPS system. Bus delay savings higher than the existing beacon-based system could be achieved with this approach.
• As expected, the triggering methods just based on a single virtual detection alone were found to perform less well and were degraded by increasing bus location error.
• Triggering based on using a door-closing sensor was found to give slightly greater bus priority benefits than the other methods. The performance of this method was further improved when buses stopped further upstream of the flag position. This method, which is based on the precise detection of bus movement, however, is susceptible to unpredictable bus behaviour, particularly for high bus flows or in congested traffic conditions.
Overall, considering the complexity of bus behaviour in the field, along with the performance of the various detection methods, the combination of using door-closing sensors and virtual detectors appears to be the most promising method where a bus stop is close to the traffic signals. Combining these results with the earlier research for links without a bus stop close to the traffic signals [6], GPS can be effectively used to detect buses for priority purposes. The small disbenefits from locational errors can be more than offset by increased flexibility and multi-purpose use.
It was also discussed that the opportunity for using extra (‘virtual’) detectors offered by the GPS detection in bus priority can be exploited to improve bus priority performance. One such example of using an extra detector is the exit detector which can cancel unused green extensions and hold green extensions until the bus crosses the stopline. Further work is now underway to explore how other potential benefits from the flexibility of GPS-based bus location can be exploited. These include the use of multiple virtual detectors to monitor buses upstream, approaching and exiting signal controlled junctions, so that priority can better match the actual movement of a bus from further upstream as it approaches each traffic signal.
9 Acknowledgements
This paper is based on a study carried out by TRG for the Bus Priority Team of Transport for London. The authors would also like to acknowledge the suggestions provided by Julian Lake of PA Consulting Group.
10 References
1 ‘About London Buses’: available at http://www.tfl.gov.uk/buses/cib_about.asp, accessed November 2006
2 Hounsell, N.B., McLeod, F.N.: ‘Automatic Vehicle Location and Bus Priority: The London System’. Selected proceedings of 8th World Conference on Transport Research, Belgium, July 1998, Vol 2, pp 279 - 292
3 Hounsell, N.B. and Landles, J.R.: ‘Public Transport Priority at Traffic Signals in London: Progress, Performance and Opportunities’. Proceedings of 2nd World Congress on Intelligent Transport Systems, Yokohama, 1995, Vol 1, pp. 273-278
4 Ibrahim, D.: ‘Improving Accuracy for GPS Vehicle Navigation Systems in London’, Traffic Engineering and Control, 2000, vol. 41, (6), pp. 228-232
5 Hounsell, N.B., Shrestha, B.P.: ‘AVL based Bus priority architectures: A review of London example’, European Journal of Transportation and Infrastructure Research, 2005, vol. 5, (3), pp. 13-29
6 Bowen, G.T.: ‘Bus Priority in SCOOT’, TRL Report 255, Transport Research Laboratory, Crowthorne, UK, 1997
7 Hounsell, N.B., Shrestha, B. P., McLeod, F.N., Gardner, K., Palmer, P. and Bowen, T.: ‘Selective Vehicle Detection (SVD) – Bus Priority and GPS Technology’. Proceedings of 25th AET European Transport Conference, Strasbourg, October 2005
9 Hounsell, N.B., McLeod, F.N. and Shrestha, B.P.: ‘Bus Priority at Traffic Signals: Investigating the Options’. Proceedings of 12th International Conference on Road Traffic Information and Control, IEE London, April 2004
10 Shrestha, B.P., Hounsell, N.B. and McLeod, F.N.: ‘Simulating Advanced Bus Priority Strategies at Traffic Signals’. Proceedings of 10th World Conference on Transport Research, Istanbul, July 2004
11 Gillam, W.J., Wright, D.A.: ‘An Innovative Approach to Real-Time Bus Information and Signal Priority’. Proceedings of 10th International Conference on Road Traffic Information and Control, IEE London, 2000
12 Kontaratos, M., Balis, V., Liapakis, C.: ‘GPS-based AVL System: A Tool for Supporting the Public Transport Operation in the Urban Area’. Proceedings of the 3rd World Congress on Intelligent Transport Systems, Orlando, 1996
13 ‘Selective Vehicle Detection Traffic Monitoring’, Draft Report, September 2005, prepared by Hyder Consulting for Transport for London Bus Priority Team