University of Southern Queensland
Faculty of Engineering and Surveying
SPATIAL ANALYSIS OF WOODY VEGETATION
LAND COVER CHANGE IN
CROWS NEST SHIRE, QLD
A dissertation submitted by
John Ernest Dunwoody W0039152
In fulfillment of the requirements of
Courses ENG4111 and ENG4112 Research Project
Towards the degree of
Graduate Diploma in Geomatics
2
ABSTRACT
Landsat 5 imagery for 1991, 1997 and 2005 was used to prepare a supervised classification of six land cover classes for Crows Nest Shire, Queensland Australia using ERDAS Imagine 9.1 software. The results exhibited good Overall Classification Accuracy. A Combinatorial AND operation using ArcGIS Spatial Analysis Tools was used to compute the temporal interaction matrices for the six land cover classes for the two time periods.
The results showed considerable exchange of land use between all classes from 1991 to 1997 however, the net amounts of Woody Natural Vegetation and Non-woody Natural Vegetation remained approximately the same in 1997 as they were in 1991. The area under water, and Cropland and Built-up areas increased from 1991 to 1997. The area under Plantations remained effectively constant. From 1997 to 2005 the Woody Natural Vegetation area
increased by 13 % and the Non-woody Natural Vegetation decreased by 15%. The Plantation area remained steady, while the area under Cropland and Water Bodies decreased. The Built-up area continued to increase.
The effect of the increase in Woody Natural land cover on Vegetation Management Classes and Ecosystem biodiversity was further investigated using Queensland Herbarium Regional Ecosystem data for 2003. It was found that the increase in Woody Natural vegetation was likely to be due to an increase in woody weed species rather than enlargement or densification of remnant Woody Natural Vegetation. It was also found to be accompanied by a decrease in Endangered remnant ecosystems and an increase in the area of Of Concern and Not Of Concern remnant ecosystems.
University of Southern Queensland
Faculty of Engineering and Surveying
ENG4111 and ENG4112 Research Project
Limitations of Use
The Council of the University of Southern Queensland, its Faculty of Engineering and Surveying, and the staff of the University of Southern Queensland, do not accept any responsibility for the truth, accuracy or completeness of material contained within or associated with this dissertation.
Persons using all or any part of this material do so at their own risk, and not at the risk of the Council of the University of Southern Queensland, its Faculty of Engineering and Surveying or the staff of the University of Southern Queensland.
This dissertation reports an educational exercise and has no purpose or validity beyond this exercise. The sole purpose of the course pair entitled “Research Project” is to contribute to the overall education within the students chosen degree program. This document, the associated hardware, software, drawings and other material set out in the associated appendices should not be used for any other purpose: if they are so used it is entirely at the risk of the user.
Prof R Smith Dean
4
Certification
I certify that the ideas, designs and experimental work, results, analyses and conclusions set out in this dissertation are entirely my own effort, except where otherwise indicated and acknowledged.
I further certify that the work is original and has not been previously submitted for assessment in any other course or institution, except where specifically stated.
John Ernest Dunwoody W0039152
Acknowledgements
6
TABLE OF CONTENTS
ABSTRACT --- ii
DISCLAIMER --- iii
CERTIFICATION---iv
ACKNOWLEDGEMENTS---v
1. INTRODUCTION--- 7
2. BACKGROUND--- 7
2.1. WOODY THICKENING--- 7
2.2. LEGISLATIVE RESPONSE--- 9
2.3. ENVIRONMENTAL EFFECTS---10
2.4. LAND COVER CHANGE---11
2.5. CROWS NEST SHIRE---13
3. STUDY OBJECTIVES--- 18
4. METHODOLOGY--- 18
5. RESULTS--- 24
6. DISCUSSION--- 45
6.1. ACCURACY---45
6.2. LAND COVER---45
6.3. REMNANT THICKENING---48
6.4. EFFECTS ON VEGETATION MANAGEMENT CATEGORIES---50
6.5. EFFECTS ON ECOSYSTEMS---50
6.6. RECOMMENDATIONS---51
7. CONCLUSION--- 52
8. REFERENCES--- 53 APPENDIX B Appreciation Report
1. INTRODUCTION
Global climate change is focusing the public’s attention on how their actions affect the environment. It can no longer can be passed off as an academic or scientific curiosity. Woody vegetation is a key variable in increased global warming, decreased biodiversity, reduced ecosystem services, drought, dryland salinity and general public amenity. National and state programs initiated to reduce tree clearing and encourage revegetation lack systematic landscape scale evaluation. The project outlined in this report may assist in the development of procedures that could be used to measure the effectiveness of national and state vegetation programs
2. BACKGROUND
Vegetation clearing with its accompanying habitat reduction and losses in ecosystem functionality is recognized as a major environmental problem in many areas of the world including Australia (Saunders et al. 1991, Kirkpatrick 1994, McAlpine et al. 2002 and Woinarski and Fisher 2003). Individual and often small actions of many people in removing vegetation have a large cumulative impact on the environmental Commons (Hardin 1968 and Feeney et al. 1990). The full effects of tree removal and land clearing may not show up for many years (Ford et al. 2001).
The Queensland State of the Environment Report for 2003 documents continuing detioration of land and water quality and loss of biodiversity (QEPA 2003, p/4-2, p.5-9, p.7-3). It
highlights the role of vegetation removal as a major contributing cause of this detioration.
2.1. Woody Thickening
Historical evidence indicates many areas of Queensland and New South Wales may have denser woody vegetation in some areas now than before European settlement (Burrows undated, Turner et al. 1996). Evidence from sedimentary pollen records (Sim et al. 2004) and soil organic carbon profiles (Krull et al 2005) supports the view that there was less woody vegetation and more grass in pre-European woodlands in many areas of Queensland. Woody vegetation thickening, largely as a result of less mortality of young trees by fire, has been documented in Queensland (Fensham et al. 2006) and in western New South Wales (Gardiner et al. 1998). Fensham et al. (2003) measured an increase in wood density in uncleared areas of Acacias and Eucalypts changing from 56 t/ha in 1953 to 67 t/ha in 1991. Removal of
8
(Scanlan 1994). The advent of chemical treatment and large mechanized land clearing equipment has allowed clearing far beyond just the thickened woodlands.
Fensham et al. (2003) also documented a decrease in woody biomass across the whole of Queensland from 58 t/ha in 1953 to 41 t/ha in 1991. The Statewide Landcover and Trees Study (SLATS) ( DNR and M 2005) has gathered woody vegetation cover data for
[image:8.595.66.529.357.541.2]Queensland from 1988 to 2007 at approximately two yearly intervals. Table 1 summarizes the amount of land clearing by type of tenure over the period 1995 – 2003 (QDNR and M 2005, p.19). The non-remnant category is land that has previously been heavily disturbed (cleared) while the remnant category is land that substantially approximates its pre-European condition. It includes land that has substantially recovered from clearing and land that has experienced woody thickening.
Table 1. Area cleared of remnant and non-remnant woody vegetation by type of tenure for the period 1995 – 2003 (QDNR and M 2005)
Clearing Rate (103ha/yr)
Period Woody
vegetation type
Freehold Lease-hold
Other tenures
Other reserves
Total Combined total
1995-1997 Remnant 125.2 95.9 2.6 3.5 227.2
Non-remnant 72.8 38.1 0.5 1.7 113.1
340.3
1997-1999 Remnant 168.2 113.6 2.6 1.9 286.3
Non-remnant 86.1 47.8 0.4 4.6 138.9
425.2
1999-2000 Remnant 322.63 179.9 0.73 1.5 504.76
Non-remnant 174.66 74.11 0.05 4.21 253.03
757.79
2000-2001 Remnant 76.21 134.13 0.71 1.96 213.01
Non-remnant 93.74 68.52 0.03 4.86 167.15
380.16
2001-2002 Remnant 121.07 152.86 0.01 1.54 275.48
Non-remnant 126.12 91.51 0.11 4.69 222.43
1033.43
2002-2003 Remnant 181.15 183.41 0.21 1.14 365.91
Non-remnant 142.35 40.61 0.07 4.97 188
553.91
The apparently contradictory evidence of woody vegetation thickening on the one hand and extensive tree clearing on the other hand may be resolved by considering the landscape context of the processes. Functional ecosystems require appropriate spatial distribution and species heterogeneity for a balanced functioning of the components of the matrix in
equilibrium with the exploitation of the system (Dovers and Norton 1994, and Bell et al. 1997). Neither excessive woody thickening nor extensive broad scale clearing achieves this. Efforts to preserve habitats and biological diversity must be focused at the ecosystem level. This can only be done by addressing landscape level issues such as ecosystem composition and integrity, connectivity and fragmentation, border effects, species composition and spatial
2.2. Legislative Response
The Environment Protection and Biodiversity Conservation Act 1999 (EPBCA) (C’wlth.) was implemented to address the loss of vegetation and biodiversity at a national scale.
Subdivision C of EPBCA requires the Minister to approve any action with a significant impact on listed threatened species or threatened ecological communities. In Queensland the Vegetation Management Act (VMA) 1999, Vegetation Management and other Legislation Act (VMOLA) 2004 and amendments to the Land Act 1995 (Qld) phased out broad scale tree clearing on both leasehold and freehold tenure land by 31 December 2006. Clearing of
remnant vegetation continues to be permitted subject only to the limitations imposed by the Regional Vegetation Management Codes (VMOLA, Division 3).
Desirable vegetation thresholds for each ecosystem type in Queensland were established by the Vegetation Management Act 1999 (Qld) as follows (Accad et al. 2006, p. 12.):
d) Endangered Regional Ecosystems (End RE)
• Less than 10% of its pre-clearing extent, or
• 10% - 30% of its pre-clearing extent remains and the remnant vegetation is less
than 10,000 ha.
e) Of Concern Regional Ecosystems (OC RE)
• 10% - 30% of its pre-clearing extent remains, or
• More than 30% of its pre-clearing extent remains and the remnant vegetation is
less than 10,000 ha.
c) Not of Concern Regional Ecosystems (NOC RE)
• More than 30% of its pre-clearing extent remaining, and • The remnant vegetation comprises more than 10,000 ha.
d) Declared Areas are areas declared by the Minister as being of high nature conservation value or as being vulnerable to land degradation
These thresholds apply across the board to all land types, vegetation types and soil types. Lindenmayer and Luck (2005) and Lindenmayer et al. (2005) caution strongly against the use of blanket threshold unless they are set conservatively. Based on semi-arid region investigations, McAlpine et al. (2002) consider the Queensland legislative thresholds
10
– 100 years to show up. By the time it shows up the opportunity to correct it will have been lost. They propose three alternative guidelines as a basis for conserving biodiversity in Queensland; (i) a regional native vegetation threshold of 50%, (ii) regional ecosystem thresholds of 30%, and (iii) special attention to protecting large remnants of 2,000 ha or greater.
Although eighty-two percent of the state remained covered by remnant vegetation in 2003 (Wilson et al. 2002) such guidelines would stop most further clearing in the already heavily cleared bioregions. These include the New England Tableland with 70% cleared, the
Brigalow Belt with 60% cleared, South East Queensland with 42% cleared and the Central Queensland Coast with 42% cleared (Wilson et al 2002, p.12). The most extensively cleared local government areas are Jondaryn Shire which has only 8.3% of its remnant vegetation remaining and Pittsworth Shire with 9.6% remaining. Within urban areas, the amount of remnant vegetation is often lower: For example Dalby 3.2% and Bundaberg 3.3% (Accad et al. 2003).
2.3. Environmental Effects
The continuing loss of woody and remnant vegetation throughout Queensland is symptomatic of a deeper problem. Vegetation loss increases fragmentation of the remaining habitat leading to an increase in disjunct relictal areas (Saunders et al. 1991). This leads to species isolation and a decrease in species richness and diversity. (Meffe and Carrol 1997). Loss of woody vegetation decreases deep drainage, increases surface runoff and predisposes areas to dryland salinity development (Eldridge and Freudenberger 2005, NLWRA 2000). Trees increase terrestrial biodiversity, restore landscape function, improve water quality (Tongway and Ludwig 1997, pp. 49-61) and reduce atmospheric carbon dioxide concentration (Danaher et al 1998). Native species of local provenance in naturally occurring associations are considered the most effective at restoring ecosystems.
emphasis on revegetation in their programs (QEPA 2004). Whether the combined effects of the legislative restrictions on land clearing and the inducements for revegetation are resulting in more or less woody vegetation and the type of that woody vegetation is unknown.
2.4. Land Cover Change
It is important to measure the effects of revegetation and devegetation programs at the landscape scale (Wilson et al. 2002, p.7). NRM Bodies routinely report the results of tree planting programs in terms of numbers of trees or area planted. The SLATS survey’s
document the status of woody tree cover in Queensland and the Herbarium reassess the status of remnant ecosystems biannually. Their results report net changes in areas of woody
vegetation and remnant and non-remnant ecosystems at state, regional and local levels (Wilson et al. 2002. p. 8).
[image:11.595.65.536.518.674.2]The remnant vegetation category (woody and non-woody) is of most interest for ecosystem function in Queensland. The Queensland Herbarium estimates that its rate of clearing has been much higher than clearing of woody remnant vegetation (Table 2). This is because DNR and M use a higher Folia Protective Cover (FPC) level to estimate woody vegetation than QEPA use to estimate all vegetation (Accad et al. 2006). The figures show a convergence of estimates with time.
Table 2. Queensland Herbarium estimates of remnant vegetation clearing compared to SLATS estimates of woody vegetation clearing during 1997 – 2003 (103 ha) (Accad et al. 2006, p. 11)
Increase in remnant vegetation clearing over
woody remnant vegetation clearing SLATS Estimates Period Qld. Herbarium estimate of remnant vegetation
clearing Area %
Total woody vegetation clearing Remnant woody vegetation clearing Non-remnant woody vegetation clearing
1997-1999 412.0 128.7 45.4% 425.0 283.3 141.7
1999-2000 632.0 117.1 22.7% 757.9 514.9 243.0
2000-2001 249.0 23.8 10.6% 379.9 225.2 154.7
2001-2003 362.0 -4.0 -1.1% 528.0 366.0 162.0
12
Mas (1999) used Singh’s 1989 multi-date post classification change detection approach to determine the landuse change matrix in the Términos Lagoon area in Campeche Mexico. Using Landsat Multi Spectral Scanner (MSS) data, he detected a 2.7% change from pasture to forestry between 1974 and 1992. Falcucci et al. (2006) used a post classification procedure to develop landuse change matrices for their study of the reforestation of Italy for the periods 1960 – 1990 – 2000. Their study used cadastral data for 1960, Landsat 5 TM images for 1990 and Landsat 7 ETM+ images for 2000. Their results showed a shift to forestry from high altitude pasture and extensive low land agriculture. Chen (2000) analyzed vegetation land use changes in Anson City Korea from 1985 to 1993 using Landsat 5 TM image data. He
evaluated six different image classification algorithms as the basis for classification prior to analyzing change detection. The results showed the amount and the sources of loss of vegetation in the city.
In Queensland, the DNR and M use a threshold decision tree classification approach employing a three band difference image for detecting the presence or absence of woody vegetation. Their results are field verified (Wedderburn - Bishop et al. 2002). The output forms the basis for the SLATS reports in which they state:
“record clearing of all remnant and non-remnant woody vegetation, where woody vegetation includes both over storey and shrub foliage protective cover. The SLATS figures do not include modifications of natural grass ecosystems, nor detectable non-woody regions within sparse woodland communities. In contrast, the Queensland Herbarium records changes to the natural state of the RE (regional ecosystem), which includes changes to native grasslands and sparse woodlands but does not include
changes in non-remnant vegetation” (QDNR and M 2005, p. 3).
Local administrative units can use this data and the Queensland. Herbarium Regional
Ecosystem data to track the net change in woody and remnant vegetation in their jurisdictions. However, it does not provide insight into which land use categories are loosing or gaining woody vegetation or the type of that woody vegetation.
changes in land use patterns. In addition to measuring the structural change in woody vegetation in the Lockyer Valley, Apan et al (2000b) used Patch Analyst and GIS
Combinatorial Overlay techniques to analyze the association of other attributes such as land tenure, gradient, road access and proximity to streams with changes in landuse. Herzog et al. (2001) cite multiple examples of the use of landscape metrics to monitor the destruction and rehabilitation of landscapes in Europe, the USA, China and Japan.
Changes in landscape usage occur in small increments. Collectively these changes have profound environmental implications. The studies cited above show that remote sensing and GIS can detect and analyze these changes at the landscape level.
2.5. Crows Nest Shire
Crows Nest Shire (CNS) is an area of 162,618 ha. centered around the town of Crows Nest at the junction of the Brigalow Belt Bioregion and the South East Queensland Bioregion (Map 1). The shire falls within two natural resource management regions, the Condamine
Catchment and the South East Queensland (SEQ) Western Catchments.
Before white settlement, all of CNS was covered by intact remnant vegetation ecosystems (Map 2). By 1997 the remnant vegetation had been reduced to 25.94 % of the pre-clearing area or 42,213 ha. From 1997 to 2003 a further 644 ha. of remnant vegetation were cleared (Accad et al 2006, Table 11) as shown in Figure 1 and Map 3.
100%
25.94% 25.86% 25.72% 25.68% 25.55%
0% 20% 40% 60% 80% 100% 120%
[image:13.595.154.447.502.680.2]Crow s Nest Shire Area Remnant Extent 1997 Remnant Extent 1999 Remnant Extent 2000 Remnant Extent 2001 Remnant Extent 2003 Time C h a n g e ( % )
14
Land use within the Shire is very diverse ranging from high quality conservation areas, to extensive and intensive agriculture and urban development. Comparison of Maps 2 and 3 illustrates the decrease in remnant vegetation and the accompanying fragmentation of that which remains. CNS overall has a lower amount of remnant vegetation than the Queensland legislative guidelines and a much lower amount than the enhanced guidelines recommended by McAlpine et al. (2002). These figures illustrate the strong need for revegetation within the shire. This need has been recognized by the Condamine Alliance who have supported tree planting programs within their section of the shire1.
1
18
3. STUDY OBJECTIVES
The objective of the project is to use remote imagery (Landsat 5 imagery) and GIS to detect and analyze vegetation changes in Crows Nest Shire. It will involve investigating the following:
a. Can remote satellite imagery with a 25m pixel resolution detect areas that are experiencing a change in woody land cover? If so, what are the conditions under which it can be detected and how accurate is the detection?
b. What land cover changes have occurred in Crows nest Shire from 1991 to 2005?
c. What are the effects of change in woody land cover in the Shire?
Developing a methodology to analyze landscape scale revegetation will assist in evaluating the effectiveness of administrative and legislative programs to protect and restore landscapes that have suffered from excessive tree clearing.
4. METHODOLOGY
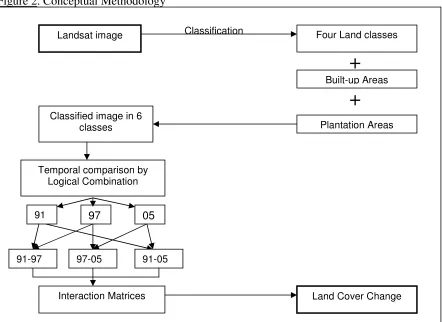
[image:18.595.74.516.478.800.2]The conceptual approach for this study was to use multiband Landsat imagery for three time periods as the basis on which to classify the terrain of Crows Nest Shire into landcover types and then to determine the interaction matrix for successive intervals as shown in Figure 2. This determined the exchanges in area between landcover types and the net amount of change in landcover of each type in the Shire.
Figure 2. Conceptual Methodology
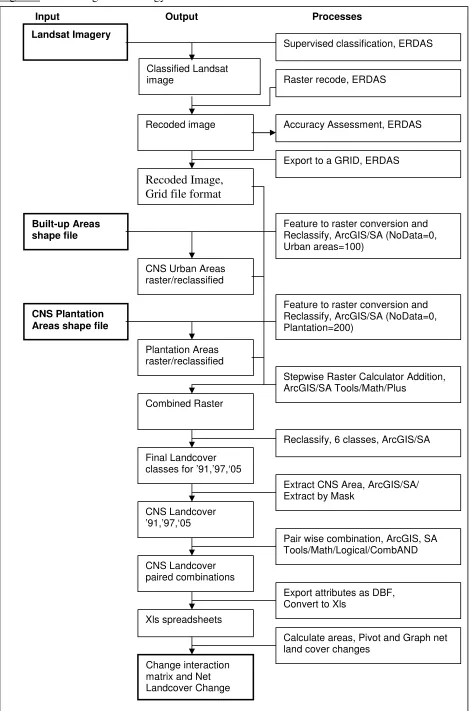
The processing methodology is outlined in Figure 3. Landsat images for an area
encompassing Crows Nest Shire for 1991, 1997 and 2005 were obtained from USQ (Apan
Classification
+
+
Landsat image Four Land classes
Built-up Areas
Plantation Areas Classified image in 6
classes
Temporal comparison by Logical Combination
91 97 05
91-97 97-05 91-05
2007) through license agreement with the Queensland Department of Natural Resources and Mines (QDNRM). These images had been preprocessed by geometric correction and
registration prior to acquisition. Each image was classified by Supervised Classification using ERDAS Imagine with the viewer band combination set to R5, G4, and B3. Initially sixteen Signature Classes were used for classification using the Maximum Likelihood Classifier and ten iterations of the Isodata algorithm. Classification was based on Bands 3, 4 and 5.
20 Figure 3. Processing Methodology
Supervised classification, ERDAS
Classified Landsat image
Raster recode, ERDAS
Recoded image
Export to a GRID, ERDAS
CNS Urban Areas raster/reclassified
Feature to raster conversion and Reclassify(NoData=0, Plantat.=200) Plantation Areas
raster/reclassified
Reclassify Final Landcover
classes for ’91, ’97, ‘05
Combinatorial AND Pair wise combinations
Expt as DBF, Conv to Xls
Xls spreadsheets
Area calcn and Pivot tables
Change interaction matrix
Recoded Image Grid file format
Feature to raster conversion and Reclassify (NoData=0, Urb Areas=100)
Input Output Processes
Landsat Imagery
Supervised classification, ERDAS
Classified Landsat
image Raster recode, ERDAS
Recoded image
Export to a GRID, ERDAS
Built-up Areas shape file
CNS Urban Areas raster/reclassified
CNS Plantation Areas shape file
Feature to raster conversion and Reclassify, ArcGIS/SA (NoData=0, Plantation=200)
Plantation Areas raster/reclassified
Stepwise Raster Calculator Addition, ArcGIS/SA Tools/Math/Plus
Combined Raster
Reclassify, 6 classes, ArcGIS/SA
Final Landcover classes for ’91,’97,‘05
Pair wise combination, ArcGIS, SA Tools/Math/Logical/CombAND CNS Landcover
paired combinations
Export attributes as DBF, Convert to Xls
Xls spreadsheets
Calculate areas, Pivot and Graph net land cover changes
Change interaction matrix and Net Landcover Change
Recoded Image, Grid file format
Feature to raster conversion and Reclassify, ArcGIS/SA (NoData=0, Urban areas=100)
Accuracy Assessment, ERDAS
CNS Landcover ’91,’97,‘05
The classified images were recoded into the four landcover classes of Woody Natural2 Vegetation, Non-woody Natural Vegetation, Cropland, and Water Bodies. Classification accuracy of each recoded image was assessed based on a stratified random sample of 50 points. The landcover of CNS was also viewed and photographed at recorded locations during 5 days of field inspections during August and September of 2007.
The recoded images were exported as grid files for further processing using ArcGIS. Built-up areas were classified using a mask for each year of analysis. The masks were prepared by manually digitizing the areas visible as built-up (urbanized or undergoing urban development) from the Landsat images. A digital cadastral data base overlay showing lot sizes was used to assist the operator with the manual digitizing. A separate file was prepared for each year of analysis and converted to raster format.
Plantation Forestry areas were separated from Woody and Non-woody Natural Vegetation by masking. A vector file of plantation areas encompassing the study area was obtained from Forestry Plantations Queensland and the plantation areas in Crows Nest Shire were extracted by clipping. The extracted file was converted to raster format.
The final land cover classes for CNS were determined by adding the Built-up Areas file to the recoded grid file of four classes and reclassifying the output to 5 classes. This had the effect of removing the built-up areas from the first four land cover classes. This procedure was repeated with the plantation areas file being added to the previous output and the resulting file reclassified into 6 classes. This had the effect of removing the plantation areas from all prior classes and producing six final land cover classes. The areas of each of these in CNS were extracted by a CNS mask using the ArcGIS Extension, Spatial Analyst Tools. Details of all data files used in the analysis are summarized in Appendix A, Primary Data Sources.
The change in land cover in CNS from 1991 to 1997 and to 2005 was analyzed using Spatial Analysis Tools to do a Logical Combination AND analysis of land cover data from successive years. The attribute tables of the resulting shape files were extracted as DBF files, converted to XLS files and the areas of each interaction calculated. Interaction matrices were prepared using Pivot Analysis to show the area of change in landcover between each landcover class.
2
22
Both absolute and relative changes in type of land cover in CNS were plotted for each of the comparison time periods.
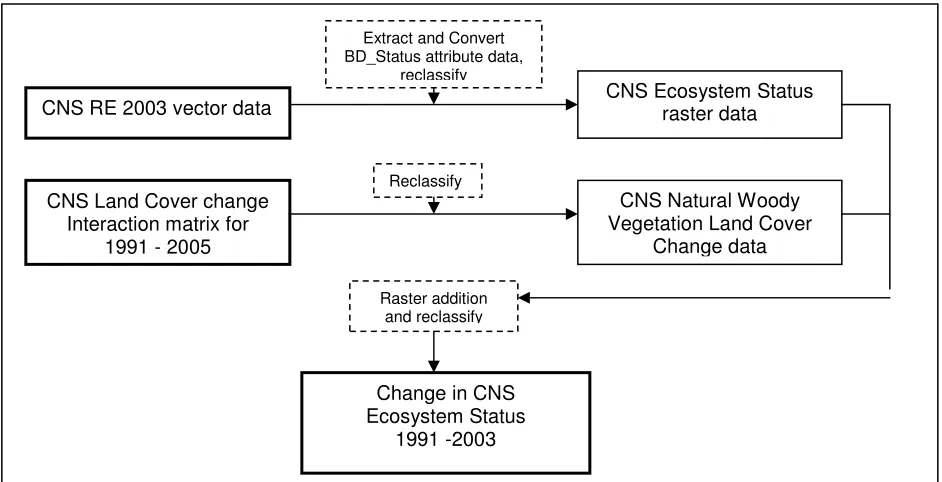
[image:22.595.70.535.321.554.2]The effect of changes in woody vegetation on different categories of remnant vegetation were investigated using the procedure outlined in Figure 4. The area containing remnant woody vegetation in 2003, which was mapped by the Queensland Herbarium (QEPA 2005), was overlain with the areas in which Woody land cover had changed from 1991 to 2005. The resulting matrix was reclassified to identify areas of change in remnant woody vegetation management categories. This procedure allowed assessment of change in areas of remnant woody vegetation from 1991 to 2003 by vegetation management category.
Figure 4. Procedure for determining effect of woody vegetation change on Remnant Vegetation Categories.
The effect of woody vegetation changes on ecosystem areas important for plant species biodiversity in Crows Nest Shire was assessed by the procedure outlined in Figure 5. The areas containing habitat previously identified by the Queensland Herbarium as containing Endangered, Of Concern and Not Of Concern ecosystems as of 2003 were overlain with areas in which Woody Natural vegetation had changed from 1991 to 2003. This allowed assessment of the change in remnant ecosystem status due to woody vegetation change from 1991 to 2003.
CNS RE 2003 vector data
CNS Remnant Veg Mgmt Cat. raster data
CNS Land Cover change Interaction matrix for
1991 - 2005
CNS Natural Woody Vegetation Land Cover
Change data Extract and Convert
VMPoly attribute data
Change in CNS Rem Veg Categories, 1991 - 2003
Reclassify
Figure 5. Procedure for determining effect of woody vegetation change on Remnant Ecosystems.
CNS RE 2003 vector data CNS Ecosystem Status raster data
CNS Land Cover change Interaction matrix for
1991 - 2005
CNS Natural Woody Vegetation Land Cover
Change data Extract and Convert
BD_Status attribute data, reclassify
Change in CNS Ecosystem Status
1991 -2003 Reclassify
24
5. RESULTS
Crows Nest Shire (CNS) is comprised of 162,618 ha of undulating terrain ranging in elevation from 200 m. to 750 m. It is used for a wide variety of human activities ranging from National Parks and State Forests to intensive and extensive agriculture, resource extraction, water impoundment and commercial and residential development. Plates 1 – 6 illustrate the variety of land uses in CNS in 2007.
Maps 4, 5, and 6 visually show the results from classifying the Landsat images.
[image:24.595.105.496.337.545.2]The Overall Classification Accuracy ranged from 76% for the 1997 image to 86% and 88% for the 1991 and 2005 images respectively (Table 3). Kappa coefficients ranged from 0.49 to 0.75 and 0.79 respectively. The Producers Accuracy and Users Accuracy are also shown in Table 3.
Table 3. Classification Accuracy Results
Category Overall
Classification Accuracy (%)
Overall Kappa Users Accuracy
(%)
Producers Accuracy (%)
1991 Image 86 0.7552
Woody Veg 84 91
Non-wdy Veg 87 95
Cropland 100 33
1997 Image 76 0.4924
Woody Veg 67 95
Non-wdy Veg 100 57
Cropland 80 80
2005 Image
Woody Veg 88 0.7904 96 93
Non-wdy Veg 74 93
Cropland 100 57
28 Plate1 Typical roadway in CNS
Plate 2 Grazing land
Plate 3 Pine plantation, standing and harvested.
Plate 4 Cropland and farm dam
Plate 5Grazing land in Cooby Dam catchment
Plate 7 Eucalypt dominant remnant showing thickening
Plate 8. Other dominant regrowth
Plate 9. Eucalypt dominant remnant not exhibiting thickening
Plate 10. Planted vegetation corridor
Plate 11. Eucalypt dominant thickening.
Plate 12. Eucalypt subdominant
30
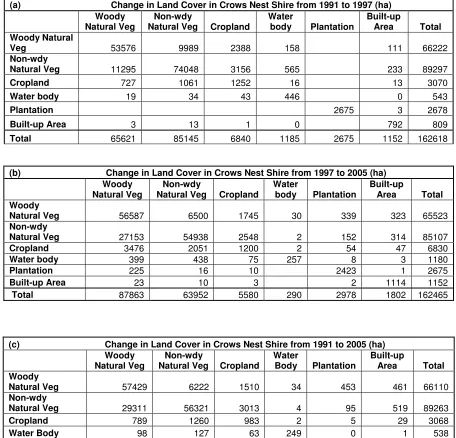
Table 4. Change in Land Cover Area in Crows Nest Shire from 1991 to 2005
(a) Change in Land Cover in Crows Nest Shire from 1991 to 1997 (ha) Woody
Natural Veg
Non-wdy
Natural Veg Cropland
Water
body Plantation
Built-up
Area Total
Woody Natural
Veg 53576 9989 2388 158 111 66222
Non-wdy
Natural Veg 11295 74048 3156 565 233 89297
Cropland 727 1061 1252 16 13 3070
Water body 19 34 43 446 0 543
Plantation 2675 3 2678
Built-up Area 3 13 1 0 792 809
Total 65621 85145 6840 1185 2675 1152 162618
(b) Change in Land Cover in Crows Nest Shire from 1997 to 2005 (ha) Woody
Natural Veg
Non-wdy
Natural Veg Cropland
Water
body Plantation
Built-up
Area Total
Woody
Natural Veg 56587 6500 1745 30 339 323 65523
Non-wdy
Natural Veg 27153 54938 2548 2 152 314 85107
Cropland 3476 2051 1200 2 54 47 6830
Water body 399 438 75 257 8 3 1180
Plantation 225 16 10 2423 1 2675
Built-up Area 23 10 3 2 1114 1152
Total 87863 63952 5580 290 2978 1802 162465
(c) Change in Land Cover in Crows Nest Shire from 1991 to 2005 (ha) Woody
Natural Veg
Non-wdy
Natural Veg Cropland
Water
Body Plantation
Built-up
Area Total
Woody
Natural Veg 57429 6222 1510 34 453 461 66110
Non-wdy
Natural Veg 29311 56321 3013 4 95 519 89263
Cropland 789 1260 983 2 5 29 3068
Water Body 98 127 63 249 0 1 538
Plantation 225 16 10 2424 4 2678
Built-up Area 11 6 1 1 789 809
Table 5. Change in Percentage Land Cover in Crows Nest Shire from 1991 to 2005
(a) Change in Land Cover in Crows Nest Shire from 1991 to 1997 (%) Woody
Natural Veg
Non-wdy
Natural Veg Cropland
Water
body Plantation
Built-up
Area Total
Woody
Natural Veg 32.95 6.14 1.47 0.10 0.07 40.72
Non-wdy
Natural Veg 6.95 45.54 1.94 0.35 0.14 54.91
Cropland 0.45 0.65 0.77 0.01 0.01 1.89
Water body 0.01 0.02 0.03 0.27 0.00 0.33
Plantation 1.64 0.00 1.65
Built-up Area 0.00 0.01 0.00 0.00 0.49 0.50
Total 40.35 52.36 4.21 0.73 1.64 0.71 100.00
(b) Change in Land Cover in Crows Nest Shire from 1997 to 2005 (%) Woody
Natural Veg
Non-wdy
Natural Veg Cropland
Water
body Plantation
Built-up
Area Total
Woody
Natural Veg 34.83 4.00 1.07 0.02 0.21 0.20 40.33
Non-wdy
Natural Veg 16.71 33.81 1.57 0.00 0.09 0.19 52.38
Cropland 2.14 1.26 0.74 0.00 0.03 0.03 4.20
Water body 0.25 0.27 0.05 0.16 0.00 0.00 0.73
Plantation 0.14 0.01 0.01 1.49 0.00 1.65
Built-up Area 0.01 0.01 0.00 0.00 0.69 0.71
Total 54.08 39.36 3.43 0.18 1.83 1.11 100.00
(c) Change in Land Cover in Crows Nest Shire from 1991 to 2005 (%) Woody
Natural Veg
Non-wdy
Natural Veg Cropland
Water
body Plantation
Built-up
Area Total
Woody
Natural Veg 35.35 3.83 0.93 0.02 0.28 0.28 40.69
Non-wdy
Natural Veg 18.04 34.67 1.85 0.00 0.06 0.32 54.94
Cropland 0.49 0.78 0.60 0.00 0.00 0.02 1.89
Water body 0.06 0.08 0.04 0.15 0.00 0.00 0.33
Planatation 0.14 0.01 0.01 1.49 0.00 1.65
Built-up Area 0.01 0.00 0.00 0.00 0.49 0.50
32
Change in Relative Land Cover in Crows Nest Shire from 1991 to 1997 (% )
-20.00% 0.00% 20.00% 40.00% 60.00% 80.00% 100.00% 120.00% 140.00% Woo dy N
atur al V
eg
No n-wdy
Natu ral V
eg
Cro pland
Wat er b
ody
Plan tatio
n
Bu ilt-up A
rea
Land Cover Type
C h a n g e ( R e la ti v e % )
Change in Relative Land Cover in Crows Nest Shire from 1997 to 2005 (% )
-100.00% -80.00% -60.00% -40.00% -20.00% 0.00% 20.00% 40.00% 60.00% 80.00% Woo dy N
atur al V
eg Non -wdy Nat ural Veg Cro plan d Wat er b
ody Plan tatio n Built -up Are a
Land Cover Type
C h a n g e ( re la ti v e % )
Change in Relative Land Cover in Crows Nest Shire from 1991 to 2005 (%)
-60% -40% -20% 0% 20% 40% 60% 80% 100% 120% 140% Woo dy N
ative Veg No n-wdy Nativ e Ve
g
Crop land
Wat er B
ody Plan
tatio n
Bu ilt-up A
rea
Land Cover Type
[image:32.595.133.461.108.517.2]C h a n g e ( R e la ti v e % )
Change in Total Land Cover in Crows Nest Shire from 1991 to 1997 (% )
-3.00% -2.00% -1.00% 0.00% 1.00% 2.00% 3.00% Woo
dy N
atur
al V
eg
No
n-wdy
Natu
ral V
eg
Crop
land
Wat
er b
ody
Plan
tatio
n
Bu
ilt-up A
rea
Land Cover Type
C h a n g e ( T o ta l % )
Change in Total Land Cover in Crows Nest Shire from 1997 to 2005 (% )
-15.00% -10.00% -5.00% 0.00% 5.00% 10.00% 15.00% 20.00% Woo dy N
atu ral V
eg
Non -wdy
Nat ural V
eg
Cro plan
d
Wa ter b
ody Plan tatio n Built -up Are a
Land Cover Type
C h a n g e ( T o ta l% )
Change in Total Land Cover in Crows Nest Shire from 1991 to 2005 (%)
-20% -15% -10% -5% 0% 5% 10% 15% Woo dy N
ative Veg No n-wdy Nat ive Veg Cro plan d Wat er B
ody Plan
tatio n
Bu ilt-up A
rea
Land Cover Type
C h a n g e ( T o ta l % )
34
The data disclose a considerable exchange of land cover during the 1991 to 1997 period. Six percent of the shire changed from being covered with woody natural3 vegetation to non-woody natural vegetation (clearing) and 7% of the shire changed from non-non-woody natural vegetation (grazing land) to woody natural vegetation (woody regeneration) leaving the shire with about 1% more land covered by woody natural vegetation after the 6 year period. During the same period, cropland increased from 2% to 4% with the increase coming from both woody and non-woody natural vegetation areas. Approximately 1% of the cropland in 1991 became covered with either woody or non-woody natural vegetation by 1997. There were 642 ha more surface water storage in 1997 than in 1991 and built-up areas occupied 343 ha more land in 1997 than 1991.
By 2005 a further 4% of the woody natural vegetation of the shire had become cleared while17% of the shire had regenerated woody natural vegetation from land used for grazing resulting in the shire having an approximately 13% net woody regeneration for the 8 year period. During the same time cropland decreased from 4% to 3.4% with the decrease going back to both woody and non-woody natural vegetation. There were 830 ha less covered with surface water storage in 2005 than in 1997 and built up areas occupied 650 ha more land in 2005 than in 1997.
The net changes in land cover for the 14 year period are shown in Tables 4 and 5 (c). There was a 13 % increase in woody natural vegetation (woody regeneration), a 15% decrease in non-woody natural vegetation land cover, a 1.4% increase in cropland, 248 ha. less committed to surface water storage and 993 ha. more built-up area in 2005 than in 1991.
The net relative changes in land cover for the three time intervals are shown graphically in Figure 6. The net land cover changes as a percent of the total area of the Shire are shown in Figure 7.
3
The effect of the change in woody natural vegetation for the period 1991 – 2005 on remnant woody vegetation categories (intact assemblages of native woody species) for the period 1991 to 20034 is given in Table 6. The spatial distribution is shown in Map 10.
Table 6. Effect of Change in Woody Natural Vegetation on Remnant WoodyVegetation Change in Woody Remnant Vegetation Between from 1991 to 2005
Remnant Woody Vegetation Change 91-03
Vegetation Category
Area in 2003 (ha) Percent CNS Land Cover Vegetation Category Area
(ha) Relative %
E-dom 5564 3.4% E-dom 267 4.8%
E-subdom 261 0.2% E-subdom 18 7.0%
O-dom 12964 8.0% O-dom 1331 10.3%
O-subdom 5548 3.4% O-subdom 221 4.0%
E-dom -452 -8.1%
E-subdom -13 -4.9%
O-dom -811 -6.3%
O-subdom -149 -2.7%
Total Woody
Remnant 24338 15.0% Net Change 412
Area of CNS 162618
E= Eucalypt genus, O=Other genera
-10.0% -5.0% 0.0% 5.0% 10.0% 15.0% E-do m E-su
bdom O-dom
O-s ubdo m E-do m E-su
bdom O-dom
O-s ubdo
m
Remnant Veg Mgmt Category
[image:39.595.126.481.443.602.2]P e rc e n t o f 2 0 0 3 A re a
Figure 8. Change in Woody Remnant Vegetation
The results show the direction of the shift in the balance between different categories. The Eucalypt dominant category had a net decrease of 3.3% and the Eucalypt subdominant category increased by 2.1percent. The categories classed as Other genera dominant and
4
40
subdominant increased by 4.0 and 1.3 percent respectively. The detailed distribution of these gains and losses is not evident at the 1:300,000 scale of Map 10 but the good conformance of the data with cadastral, road and stream features can be seen in the 1:25,000 scale inserts A and B in this map.
The effect of the change in woody natural vegetation for the period 1991 – 2005 on ecosystem biodiversity categories (See Appendix B for a detailed description of categories) the
biodiversity of the Shire for the period 1991 to 20035 is shown in Table 7 and Table 7.
Table 7. Effect of Change in Woody Natural Vegetation on Biodiversity Status
Change in Remnant Ecosystem Categories from 1991 to 2005
Areas of Biodiversity Importance Change 91-03
Biodiversity Category Area in 2003 (ha) Percent CNS land cover Biodiversity
Category Area (ha)
Relative %
Endangered Rem 6028 3.7% End. Rem 287 4.8%
Of Concern Rem 19236 11.9% Of Concern Rem 1565 8.1%
Not Of Concern Rem 16080 9.9%
Not Of Concern
Rem 994 6.2%
End. Rem -480 -8.0%
Of Concern Rem -963 -5.0%
Not Of Concern
Rem -688 -4.3%
Total Biodiversity
Remnant 41344 25.5% Net Change 716
Area of CNS 162075
-10.0% -8.0% -6.0% -4.0% -2.0% 0.0% 2.0% 4.0% 6.0% 8.0% 10.0% End. Rem
Of C once
rn R em
Not Of C
once rn R
em
End. Rem
Of C once
rn R em
Not Of C
once rn R
[image:40.595.119.482.524.687.2]em Biodiversity Category P e rc e n t o f 2 0 0 3 A re a
Figure 9. Change in Ecosystem Biodiversity from 1991 to 2005 as %.
5
The results show the direction of the changes during the period. The area of endangered ecosystems in remnant woodlands increased by 287 ha but this was offset by the loss of 480 ha of endangered ecosystems resulting in a net loss of 193 ha during this period. The Of Concern ecosystem area increased by 1,565 ha., although this was in-part offset by the loss of 963 ha of such area. The Not Of Concern ecosystems increased by 994 ha. and this was partially offset by the loss of 688 ha. of Not Of Concern area. The spatial distribution of these changes is shown in Maps 11 and 12. Map 11 provides an overview of the important
6. DISCUSSION
6.1. Accuracy
The accuracy of the classification process effects the use of the results (Huang et al 2006). Crows Nest Shire has a very mixed land cover which compounds accurate classification of the features due to the high percentage of mixels in the images. The lowest Overall Classification Accuracy of 76% (Kappa = 0.49) was obtained for the 1997 Landsat image while 86% and 88% Overall Classification Accuracies were obtained for the 1991 and 2005 images respectively (Table 3). The closeness of the Overall Accuracies for the first and last images for the comparison period means that any differences detected are likely to be real differences and not due to classification errors. The lack of 100% accuracy is inevitable in land cover classification from 25 m. pixel images. User Accuracy ranged from 74% to 100% for the 1991 and 2005 images. The Woody Vegetation class had an 84% to 96% User Accuracy (non inclusion of false pixels and thus not overestimating the class), while Non-woody Vegetation class had an 84% to 74% accuracy) This means there might have been more chance of overestimating the area covered by the Non-woody Vegetation class than by the Woody Vegetation class
6.2. Land Cover
The QDNR and M (2005) documented the continuation of clearing of both remnant and non-remnant woody vegetation throughout all of Queensland from 1995 to 2003 (Table 1). More remnant vegetation was cleared than non-remnant vegetation. Their estimates are based on a 20% folia protective cover (FPC) for an area to be considered as Woody Vegetation (Accad et al 2006). The QEPA estimate of clearing of remnant vegetation during this period was much higher (Table 2). This difference is attributed to their use of a lower FPC threshold (10%). This study did not use a FPC approach to classification. Pixel radiance values were allocated on a maximum likelihood basis. Verification from field sites indicates that areas such as those shown in Plates 8 and 12 would have been classified as Woody Vegetation while the
foreground area of Plates 2 and 5 would have been classified as Non-woody Vegetation.
46
relative increase of 33% in Woody Vegetation land cover and a 28% decrease in Non-woody Natural Vegetation land cover (Figure 6). This reflects the net conversion of 21,750 ha. to Woodland6 and a decrease of 25,670 ha. in Non-woody Natural Vegetation land cover. As shown by the land cover interaction matrices (Tables 4 (c) and 5 (c)) the change in land cover has not been a simple exchange between these two classes. Some Woodland has been
converted to Non-woodland (6222 ha), Cropland (1510 ha) Water Bodies (34 ha), Plantation (453 ha) and Built-up Area (461 ha). Concurrently Non-woody Natural Vegetation was converted to Woodland (29,311 ha), Cropland (3013 ha), Water Bodies (4 ha), Plantation (95 ha) and Built-up Areas (519 ha) during this same period. Exchanges in all land cover
categories are shown in Tables 4 (c). It is significant to note that from 1991 to 2005 there has been a decrease of 248 ha covered by surface water storage and an increase of 995 ha. of Built-up Area (residential, commercial and infrastructure). The area of Cropland (actively growing crops or fallow) increased by 2,512 ha during this period.
The results for the 1991 to 1997 period show a different picture. There was very little net change in Woodland and Non-woodland land cover in this period (Tables 4 (a) and 5 (a)) however Cropland increased by 3,770 ha., Water Body coverage by 642 ha. and Built-up Areas by 343 ha. These figures are consistent with a higher rainfall prior to 1997 imaging than prior to 2005 imaging.
The overall pattern of change may be summarized as:
a. All the increase in Woody Natural Vegetative land cover has occurred in the last 8 years of the 14 year period,
b. All the decrease in Non-woody Natural Vegetative land cover has also occurred in the last 8 year period,
c. Cropland increased by almost 4,000 ha during the first 6 years but has declined by 1,250 ha in the last 8 years,
d. The area committed to Cropland is very dynamic with large fractions changing from one land use to another in successive periods,
e. The area covered by surface water storage increased from 1991 to 1997 by 118% and then decreased by 75% from 1997 to 2005 (Figure 6),
f. The area under forestry plantation has remained relatively constant over time, g. The Built-up Area continues to increase from 343 ha during the first 6 year period
(57ha/yr) to 650 ha. during the second 8 year period (81ha/yr).
6
The results from this study are compared with the QEPA results in Table 8.
Table 8. Comparison of this study with QEPA results for comparable time periods.
Woodland
(This study)
QEPA Remnant (Accad
et al 2006)
Difference
Year
Area (ha) % Area (ha) % Area (ha) %
1991 66,222 40.7
1997 65,523 40.3 42,213 25.9 23,310 14.3
2003 41,589 25.6
2005 87,863 54.1 46,1741 28.5
1. This is a comparison between the EPA 2003 remnant data and this study’s’ 2005 woodland area.
The difference category for 1997 is consistent with this being Woody Vegetative land cover due to non-native species of 14.3%. These may be either planted in the form of private orchards or timber plantings or areas infested with woody weeds such as Lantana (Lantana
camara) and Groundsel (Baccharis halimifolia).The difference between the QEPA remnant
area for 2003 and this study’s finding for of Woody Vegetative land cover in 2005 is 46,274 ha. or 28.5% of the Shire. This is an unexpected and large increase. It may be due to the following:
i. The growth of young remnant woody species (natural regeneration) from less than 10% FPC levels in the imagery on which the QEPA 2003 data is based (effectively visually masked by the surrounding grassland) to a level that was more easily detected in the 2005 imagery used in this study.
ii. Growth of woody weed species between 1997 and 2005.
iii. Expansion of private woodland plantings between 1997 and 2005 (Plate 10). iv. Error in the data processing.
The difference in amount of Woodland between the 1991 and 1997 images compared to the 2005 image is evident to the human eye when the original Landsat images are viewed in a computer viewer. It can be seen by comparing Map 6 with Maps 4 and 5. It is further evident in the Land Cover Change Maps (Map 8 and 9).
48
during field inspections. This is evidence that emergent remnant thickening could have contributed to the 2005 increase in Woodland land cover.
Plates 8 and 12 illustrate two cases of developing woody weed Woodlands that are beginning to take over from semi-cleared land used for livestock grazing. Numerous examples of this type of transition were observed during site visits. Plate 10 illustrates a planted vegetation corridor in the catchment for the Cooby Creek Dam. This type of planting could also have contributed to increased Woodland land cover. Other examples of intentional plantings of orchards and timber wood lots were evident during site visits (Map 13).
It would seem reasonable to conclude that the increase in Woodland land cover from 1997 to 2005 is not due to an artifact of classification but instead due to a combination of remnant thickening, woody weed regrowth and intentional woodland plantings.
6.3. Remnant Thickening
When original naturally occurring woody ecosystems are partially cleared to increase grass production for grazing, the ecosystem is no longer stable. The change in species density and heterogeneity changes many of the ecosystem process flows that existed in the stable pre-clearing woody ecosystem. Such an unstable ecosystem can shift in either of three directions.
a. It may remain in the present state with continued human intervention, such as burning, fertilizing and weed control (pasture).
b. It may shift towards the previous climax if there is sufficient reseeding and grass competition is reduced by grazing (remnant thickening).
c. It may become invaded with introduced woody species to the exclusion of native grasses and trees (woody weed invasion)
50 6.4. Effects on Vegetation Management Categories
The nature of the change in woody vegetation can be investigated by analyzing the changes in remnant vegetation management categories (VM Cat). VM Cat data is available for 2003 for Crows Nest Shire as part of the Queensland Regional Ecosystem data base (Version 5) (QEPA 2005). The results given in Table 6 and Figure 8 show that Woody Vegetation land cover change resulted in a decrease in Eucalypt dominant (Edominant) woodland (+4.8% vs -8.1%), an increase in E-subdominant woodland (+7.0% vs -4.9%), an increase in Other dominant (O-dominant) woodland (10.3% vs -6.3%) and an increase in O-subdominant (+4.0% vs -2.7%). All four changes provide a consistent indication that E-dominant
woodlands in the Shire declined during the period 1991 to 2003. During this same period non Eucalypt species increased their presence. Eucalypts are the predominant species in South East Queensland remnant ecosystems7. Their decline lends support to the view that increase in Woody Vegetation land cover was due to either intentional woodland plantings or regrowth of woody weed species
6.5. Effects on Ecosystems
Important ecosystems are closely physically associated with remnant vegetation areas and in particular woody remnant vegetation. The effect of change in Woody Vegetation on these ecosystems in the Shire was analyzed using data from the QEPA Regional Ecosystems data base (Version 5) (QEPA 2005) and land cover change data from this study. The results shown in Table 7 and Figure 9 show a net loss of Endangered category ecosystems of 193 ha. (-3.8%). This is the most vulnerable category. There was an increase of 602 ha. (+3.1%) in Of Concern ecosystems and an increase of 306 ha. (+1.9%) of Not of Concern ecosystems. Queensland Herbarium data show that only 25% of the land area of Crows Nest Shire retains remnant ecosystems (Figure 1). A decline of 3.8% in the Endangered category in 12 years is considered significant by the writer. Overall the study found those areas important for remnant ecosystems increased by 716 ha or 1.7% in the 12 year period. These figures do not include Non-woody remnant ecosystem areas.
7
6.6. Recommendations
52
7. CONCLUSION
This study found that the land cover changes over a 14 year period in Crows Nest Shire could be accurately and reliably estimated using 25m pixel Landsat imagery subjected to Supervised Classification using ERDAS Imagine software. Sixteen primary classes were used for
maximum likelihood classification. These were subsequently recoded to 6 classes and Overall Classification Accuracy ranged from 74% to 88%.
The percentage of Woody Vegetation land cover in Crows Nest Shire remained constant from 1991 to 1997 at approximately 40%. However, it increased to 54 % from 1997 to 2005. This was unexpected. Previous studies of remnant vegetation during the same period showed the area covered by remnant vegetation to be declining slowly. Non-Woody Vegetation land cover remained steady at approximately 54% of the Shire from 1991 to 1997 but decreased to approximately 40% by 2005. The area under Cropland was very dynamic ranging from 1.9% in1991 to a high of 4.2% in 1997 and reducing to 3.4% in 2005. The area covered by surface water storage ranged from 0.33% in 1991 to a high of 0.73% in 1997 and decreased to a low of 18% in 2005. The area under government forestry plantations remained relatively constant over the 14 years. The Built-up Area increased from 809 ha in 1991 to 1802 ha. in 2005.
8. REFERENCES
Accad, A., Neldner, V.J., Wilson, B.A. and R.E. Neihaus. 2006. Remnant Vegetation in
Queensland 1997-1999-2000-2001-2003, including regional ecosystem information.
Brisbane: Qld. Herbarium, Environmental Protection Agency.
Apan, A.A. 2007. Landsat 5 Imagery dated 15/10/1991, 12/08/1997 and 17/07/2005. Faculty of Engineering and Surveying, USQ Toowoomba.
Apan, A.A. 1997. Landcover mapping for tropical forest rehabilitation planning using remotely-sensed data. International Journal of Remote Sensing, Vol. 18:5, pp.1029-1049.
Apan, A.A., Raine, S.R. and M.S. Paterson. 2000a. Image analysis techniques for assessing landscape structural change: A case study of the Lockyer Valley catchment, Queensland. In Proceedings of the 10th Australasian Remote Sensing and
Photogrammetry Conference, Adelaide, Aust. Pp.438-455.
Ibid, 2000b. Quantifying landscape fragmentation in the Lockyer Valley catchment,
Queensland, in Proceedings of the 28th Annual Conference of AURISA. Coolum, Qld. Bell, S.S., Fonseca M.S and L.B. Motten. 1997. Linking restoration and landscape ecology.
Restoration Ecology, Vol. 5:4, pp. 318-323.
Burrows, W. undated. Sorting fact from fiction – questionable ‘ science’ and ‘management’
that underpin Queensland’s Vegetation Management Act. From:
Chen, X. 2002. Using remote sensing and GIS to analyse land cover change and its impacts on regional sustainable development. International Journal of Remote Sensing,
Vol.23:1. pp.107-124.
Danaher, T.J., Wedderburn-Bisshop, G.R., Kastanis, L.E. and J.O. Carter. 1998. Monitoring Land Cover Change and Greenhouse Gas Emissions in Queensland. In Proceedings
of the 9th Australasian Remote Sensing and Photogrammetry Conference, Sydney,
Aust.
Dovers, S.R. and T.W. Norton. 1994. Toward an ecological framework for sustainability: Considerations for ecosystem management. Pacific Conservation Biology, Vol. 1, pp 283-293.
Eldridge, D. J. and D. Freudenberger. 2005. Ecosystem wicks: Woodland trees enhance water infiltration in a fragmented agricultural landscape in eastern Australia. Austral
54
Falcucci, A., Maiorano, L. and L. Boitani. 2007. Changes in Land-use/land-cover patterns in Italy and their implications for biodiversity conservation. Landscape Ecology Vol. 22 pp. 617-631.
Feeney, D., Maiorano, L. and L. Boitani. 1990. The Tragedy of the Commons: Twenty two years later. Human Ecology. Vol. 18:1, pp. 1-19
Fensham, R.J., Low Choy, S.L., Fairfax, R.J. and P.C. Cavallaro. 2003. Modeling trends in woody vegetation structure in semi-arid Australia as determined from aerial photography. Journal of Environmental Management, Vol. 68, pp. 421-436.
Fensham, R.L., Bray, S.G. and D.J. Fairfax. 2006. Evaluation of aerial photography for predicting trends in structural attributes of Australian Woodlands including comparison with ground-based monitoring data. Journal of Environmental
Management. Vol. 83, pp. 392-401.
Ford, H.A., Barrett, G.W., Saunders, D.A. and H.F. Recher. 2001. Why have birds in the woodlands of Southern Australia declined? Biological Conservation. Vol. 97, pp. 71-88.
Gardiner, D.B., Tupper, G.J. and G.S. Dudgeon. 1998. A quantitative appraisal of woody shrub encroachment in western New South Wales. The Rangeland Journal, Vol. 20:1, pp. 25-40
Grumbine, R.E. 1994. What is ecosystem management? Conservation Biology, Vol. 8:1, pp.27-38.
Grumbine, R.E. 1997. Reflections on “What is ecosystem management?” Conservation
Biology, Vol.11:1, pp, 41-47.
Hardin, G. 1968. The Tragedy of the Commons. Science, Vol. 162, pp. 1243-1248. Henry, D. 2006. Landcare: Reconciling Agriculture and Conservation. Address to the
International Landcare Conference, Melbourne. Aust.
Herzog, F., Lausch, A., Muller, E., Thulke, H-H., Steinhardt, U and S. Lehmann. 2001. Landscape metrics for assessment of landscape destruction and rehabilitation.
Environmental Management, Vol. 27:1, pp. 91-107
Huang, C., Geiger, E.L. and J.A. Kupfer. 2006. Sensitivity of landscape metrics to
classification schemes. International Journal of Remote sensing. Vol, 27:14 pp. 2927 – 2048.
Kirkpatrick, J.B. 1994. A Continent Transformed: Human Impact on the Natural Vegetation
of Australia. Oxford University Press, Melbourne.
evidence from δ13C and 14C analyses of soil organic matter. Geoderma Vol. 126, pp.
241-259.
Lindenmayer, D,B., Fischer, J. and R.B. Cunningham. 2005. Native vegetation cover
thresholds associated with species responses. Biological Conservation, Vol.124, pp. 312-316.
Lindenmayer, D,B. and G. Luck. 2005. Synthesis: Thresholds in conservation and management. Biological Conservation, Vol. 124, pp. 351-354.
Mas, J.F. 1999. Monitoring Land cover changes: a comparison of change detection techniques. International Journal of Remote Sensing. Vol. 20:1. pp. 139-152. Meffe, G.K. and C.R. Carrol. 1997. Principles of Conservation Biology. Sinauer Associates.,
Sunderland, MA Chap. 4: Global Biodiversity Patterns and Processes. pp. 87-121. McAlpine, C.A., Fensham, R.J. and D.E. Temple-Smith. 2002. Biodiversity conservation and
vegetation clearing in Queensland: Principles and thresholds. The Rangeland
Journal, Vol. 24:1, pp.36-55.
National Land and Water Resources Audit (NLWRA). Undated. Dryland Salinity in
Australia. Turner, ACT, Australia.
Queensland Department of Natural Resources and Mines (QDNR and M). 2005. Land cover change in Queensland 2001-2003, incorporating 2001-2002 and 2002-2003 change
periods: a Statewide Landcover and Trees Study (SLATS) report. Brisbane, Qld.
Queensland Environmental Protection Agency (QEPA), 2003. State of the Environment
Report. Brisbane Qld.
QEPA. 2004. Integrating Biodiversity Planning into NRM Plans by the Planning Arrangements Working Group. pp. 1-6.
QEPA, 2006. South East Queensland Biodiversity Planning Assessment CD. Queensland Herbarium, Brisbane Qld.
Saunders, D.A., Hobbs, R.J. and C.R. Margules. 1991. Biological consequences of ecosystem fragmentation: A review. Conservation Biology. Vol. 5:1, pp. 18-32.
Scanlan, J.C., McKeon, G.M., Day, K.A., Mott, J.J. and A.W. Hinton. 1994. Estimating safe carrying capacities of extensive cattle grazing properties within tropical, semi-arid woodlands of north-eastern Australia. The Rangeland Journal. Vol. 16:1, pp.64-76.
Sim, A., Heijnis, H. and S. Mooney 2004. Use of the pollen record to investigate vegetation thickening in central Queensland over the past 120 years. Proceedings of the AQUA
56
Tongway, D. J. and J.A. Ludwig. 1997. The nature of landscape dysfunction in rangelands,
Chap. 5, pp. 49 - 61 in Landscape Ecology: Function and Management. Ed. Ludwig, J., D. Tongway, D. Freudenberger, J. Noble and K. Hodgkinson. Pub. CSIRO,
Canberra, ACT.
Toyne, P & Farley, R .2000. The Decade of Landcare: Looking Backward- Looking Forward.
The Australia Institute, Canberra.
Turner, G.W., Ruffo, R.M.C. and M.W. Roberts. 1996. Extent and environmental significance of vegetation clearance in the Nymagee-Cargelligo area, western New South Wales.
Australian Geographer, Vol. 27:1, pp. 87-100.
Wedderburn-Bisshop, G., Wallis, J., Senarath, U and A. Stewart. 2002. Methodology for mapping change in woody landcover over Queensland from 1999 to 2001 using Landsat ETM+. In Proceedings of the 11th Australasian Remote Sensing and
Photogrammetry Conference, Brisbane, Aust. pp. 1-10.
Wilson, B.A., Neldner, V.J. and A. Accad . 2002. The extent and status of remnant vegetation in Queensland and its implications for statewide vegetation management and
legislation. The Rangeland Journal, Vol.24:1 pp. 6-35
Woinarski, J.C.Z. and A. Fisher. 2003. Conservation and Maintenance of biodiversity in the rangelands. The Rangeland Journal, Vol.25:2, pp. 157-171.
Zammit, C., Apan, A.A., Cockfield, G., LeBrocque, A. and M.R. Bouldin. 2002. Prospects for regional sustainability: Land use change in the eastern Darling Downs, 1975-2001. in
Proceedings of the 11th Australasian Remote Sensing and Photogrammetry
APPENDIX A
Project Appreciation Report
SPATIAL ANALYSIS OF REVEGETATION
IN CROWS NEST SHIRE, QLD.
USQ, ENG4111, 2007
By J. E. Dunwoody
58
TABLE OF CONTENTS
Page No.
1. INTRODUCTION 60
2. BACKGROUND 60
3. PROJECT OBJECTIVES 72
4. CONSEQUENTIAL EFFECTS 72
5. METHODOLOGY 72
6. SAFETY ISSUES 75
7. RESOURCE REQUIREMENTS 75
8. TIMELINES 75
9. REFERENCES 76
[image:58.595.70.303.147.389.2]LIST OF TABLES
Table 1. Area cleared of remnant and non-remnant woody
vegetation by type of tenure for the periods 1995 - 2003………..….4
Table 2. Queensland Herbarium estimates of remnant vegetation clearing compared to SLATA estimates of woody vegetation
clearing during 1997 – 2003………...5
Table 3. Resource Requirements………..17 Table 4. Project Timelines………17
LIST OF FIGURES
Figure 1. Change in remnant vegetation in Crows Nest Shire………9 Figure 2. Analysis procedure and resources to assess patterns of revegetation………16
Map 1. Crows Nest Shire Natural Resource Management Areas……….10 Map 2. Crows Nest Shire Regional Ecosubsystems……….11
60
INTRODUCTION
Global climate change is focusing the public’s attention on how their actions affect the environment. Global climate change no longer can be passed off as an academic or scientific curiosity. Woody vegetation is a key variable in increased global warming, decreased
biodiversity, reduced ecosystem services, drought, dryland salinity and general public amenity. National and state programs initiated to reduce tree clearing and encourage revegetation lack systematic landscape scale evaluation. The project outlined in this report may assist in the development of procedures that could be used to measure the effectiveness of national and state revegetation programs.
1. BACKGROUND
Vegetation clearing with its accompanying habitat reduction and losses in ecosystem functionality is recognized as a major environmental problem in many areas of the world including Australia (Saunders et al. 1991, Kirkpatrick 1994, McAlpine et al. 2002 and Woinarski and Fisher 2003). Individual and often small actions of many in removing
vegetation have a large cumulative impact on the environmental Commons (Hardin 1968 and Feeney et al. 1990). The full effects of tree removal and land clearing may not show up for many years (Ford et al. 2001).
The Queensland State of the Environment Report for 2003 documents continuing detioration of land and water quality and loss of biodiversity (QEPA 2003, p/4-2, p.5-9, p.7-3). It
highlights the role of vegetation removal as a major contributing cause of this detioration.
Historical evidence indicates many areas of Queensland and New South Wales may have denser woody vegetation in some areas now than before European settlement (Burrows undated, Turner et al. 1996). What then are the grounds for the current policies for controlling tree clearing and promoting revegetation?