Evaluation report and executive summary
May 2017
Independent evaluators:
The Education Endowment Foundation (EEF) is an independent grant-making charity dedicated to breaking the link between family income and educational achievement, ensuring that children from all backgrounds can fulfil their potential and make the most of their talents.
The EEF aims to raise the attainment of children facing disadvantage by:
identifying promising educational innovations that address the needs of disadvantaged children in primary and secondary schools in England;
evaluating these innovations to extend and secure the evidence on what works and can be made to work at scale; and
encouraging schools, government, charities, and others to apply evidence and adopt innovations found to be effective.
The EEF was established in 2011 by the Sutton Trust as lead charity in partnership with Impetus Trust (now part of Impetus - Private Equity Foundation) and received a founding £125m grant from the Department for Education.
Together, the EEF and Sutton Trust are the government-designated What Works Centre for improving education outcomes for school-aged children.
For more information about the EEF or this report please contact:
Danielle Mason
Head of Research and Publications Education Endowment Foundation 9th Floor, Millbank Tower
21–24 Millbank SW1P 4QP p: 020 7802 1679
About the evaluator
The project was independently evaluated by a team from NatCenSocial Research: Rakhee
Patel, Nico Jabin, Loraine Bussard, Javiera Cartagena, Sarah Haywood, and Michael
Lumpkin.
The lead evaluator was Rakhee Patel:
Address: 35 Northampton Square, London, EC1V 0AX
Email: [email protected]
Table of Contents
ABOUT THE EVALUATOR
2
TABLE OF CONTENTS
3
EXECUTIVE SUMMARY
4
INTRODUCTION
5
METHODS
11
IMPACT EVALUATION
21
PROCESS EVALUATION
33
CONCLUSION
43
REFERENCES
46
APPENDIX A: EEF COST RATING
48
APPENDIX B: SECURITY CLASSIFICATION OF TRIAL FINDINGS
49
APPENDIX C: ANALYSIS PLAN
50
APPENDIX D: RANDOMISATION SYNTAX
58
APPENDIX E: MEMORANDUM OF UNDERSTANDING
60
APPENDIX F: POST-INTERVENTION SURVEY
67
Executive summary
The project
Switch-on is an intensive, targeted literacy intervention that aims to improve the reading skills of pupils who are struggling with literacy. There are two versions of the intervention: Switch-on Reading and Switch-on Reading and Writing. Both involve specially trained Teaching Assistants (TAs) delivering a tailored programme of literacy support in daily 20-minute sessions over a ten-week period.
A previous EEF-funded evaluation of Switch-on had shown signs of promise in raising reading outcomes for Year 7 pupils, hence a larger scale effectiveness evaluation was conducted. Each of the 184 participating schools were randomly assigned to receive either Switch-on Reading, Switch-on Reading and Writing, or continue their usual practices of supporting pupils with reading difficulties (called ‘business as usual’ control). Between two and four TAs in each school were trained to deliver the interventions by a team of trainers who were distinct from the developers. TAs received 1.5 days training for Switch-on Reading, and 2.5 days for Switch-on Reading and Writing. Each TA worked with between two and four Year 3 pupils who had not met age-related expectations in literacy at the end of Key Stage 1, and who did not have a high level of special needs. In total, 999 pupils were involved in the trial. The primary outcome measure was the Hodder Group Reading Test 2A. The evaluation was conducted over the 2015/2016 academic year. A process and implementation evaluation was carried out which included depth telephone interviews with the developers, trainers, and TAs, and six case studies incorporating the views of TAs, class teachers, and Switch-on co-ordinators in the school.
EEF security rating
The security rating of the trial indicates how confident we can be that any additional progress experienced by the children receiving Switch-on was due to the intervention rather than any other factors. This trial was an effectiveness trial that aimed to test whether the intervention was effective when delivered in a form that could be available to a large number of schools. Findings from this study
Key conclusions
1. Participating children in schools delivering either version of Switch-on made no additional progress in reading compared to similarly struggling children in ‘business as usual’ control schools. The 4 padlock security rating means that we have high confidence that
there was no
difference, and that this was due to Switch-on and not affected by other factors.
2. A similar result was observed for children eligible for Free School Meals.
3. The secondary analysis suggests that Switch-on might have affected children who did not actually receive the intervention by changing the make-up of their class or the capacity of their TAs. These findings are tentative, but emphasise the importance of considering potential impacts on all children when using targeted interventions.
4. Overall, participating staff were positive about the intervention and accompanying training. Perceived outcomes for pupils included increased confidence, motivation and interest in reading, and improved reading and writing skills. Skills of participating TAs were also felt to have improved.
5. Some schools reported modifications to the prescribed content, duration and format of Switch-on sessiSwitch-ons. Closer mSwitch-onitoring by the developers could help to ensure greater fidelity in future. It was also reported that some class teachers had limited awareness of Switch-on. Clarifying the role of Switch-on as part of a broader, teacher-led literacy strategy could improve implementation.
have high security. The trial was a well-designed, three-arm randomised controlled trial, with randomisation at school level. Relatively few pupils were lost to the analysis and pupils who received the intervention were similar to the pupils in the comparison group. The trial was only designed to reliably detect an impact equivalent to three months’ progress.
Additional findings
The trial did not find evidence that a three-month delivery of Switch-on Reading or Switch-on Reading and Writing improves reading outcomes of pupils struggling with literacy at Key Stage 1 compared to schools’ usual practices. Estimated effects were at zero standard deviations and not statistically significant. The intervention also showed no effect on pupils eligible for free school meals. These findings contradict previous evidence from a smaller within-school efficacy trial and the literature on the effectiveness of structured, one-on-one literacy interventions led by TAs.
The process evaluation suggests that in some schools intervention fidelity was compromised to some degree, which is likely to have affected the quality of the intervention and could explain the lack of impact. The process evaluation also indicated inconsistent involvement of class teachers and senior leaders, which is identified in the literature as a factor that enables effective implementation.
The secondary analysis suggests that Switch-on might have affected children who didn’t actually receive the intervention by changing the make-up of their class or the capacity of their TAs. There is a possibility that implementing Switch-on may have had a negative impact on the literacy of pupils in the same year who were eligible to receive the intervention but were not selected due to limitations on numbers. Conversely, there is a possibility that the intervention had a positive impact for pupils in the same that class that were ineligible to receive the intervention. Both results should be treated cautiously.
Cost
The cost of the project was estimated at £546 per pupil. This estimate includes up-front costs (for website development and access, and for the development of training materials such as films) and ongoing delivery costs (including provision of books and TA and trainer training). In terms of staff time, approximately 68 hours per pupil were required to deliver Switch-on. This included training and the delivery of sessions. If the intervention were delivered in a school over a period of three years, the cost per pupil per year would be much lower, at £184, because most of the cost are up-front costs. Estimates are based on an average of five pupils per school and two or three TAs per school delivering the intervention.
Table 1: Summary of impact on primary outcome
Group
Effect size (95% confidence
interval)
Estimated months’ progress
EEF security
rating Type of trial
EEF cost rating
Switch-on vs. control
0.00
(-0.13, 0.13) 0 Effectiveness £££££
Switch-on FSM vs. control
0.03
(-0.18, 0.20) 0 n/a Effectiveness £££££
Introduction
Switch-on: intervention description
Switch-on is an intensive literacy intervention which was developed by Nottinghamshire Reading Recovery Teacher Leaders. The intervention was developed in response to requests from headteachers to provide TAs with professional development in literacy. The needs identified for improved training of TAs reflect findings in a wider review of evidence on ‘Making the Best Use of Teaching Assistants’ which found that ‘the typical deployment and use of TAs, under everyday conditions, is not leading to improvements in academic outcomes’ (Sharples et al., 2015, p. 11). By providing TAs with structured support and training to deliver a one-to-one reading intervention, the aim of the intervention was to enable children:
‘to participate more fully in the classroom by becoming more confident, active and independent readers, who can use a range of effective reading strategies in order to achieve their full reading potential’ (Nottinghamshire County Council Switch-on training manual, p. 2).
The intervention manual and accompanying training introduced TAs to the following theoretical frameworks:
Vygotsky’s theory of the zone of proximal development, which draws a distinction between what a learner can do independently and with help from an adult or more competent peer (Smagorinsky, 2011); and
the ‘simple view of reading’, which distinguishes between language comprehension processes and word recognition skills and demonstrates that both are essential for effective reading (Gough and Tunmer, 1986).
It also explained the rationale for re-reading familiar books and how this approach helped to build confidence and fluency.
2. Who (recipients)
The intervention was aimed at pupils in Year 3 (aged seven and eight) who were working below age-related expectations at the end of Key Stage 1 (five to seven years) and did not have a high level of special needs. Schools were able to select pupils who met these criteria—reflecting the need to reflect real-life choices and contexts in a large scale effectiveness trial—and were advised only to select pupils for whom, in their view, the intervention would be appropriate and beneficial.
3. What (materials)
TAs were provided with an intervention manual which included: the rationale for the intervention;
the theory of reading progress underpinning the intervention;
detailed instructions about how the intervention should be delivered, including examples; and forms to monitor and record the progress of pupils, and explanations of how these should be
used.
After the initial training, each school received a pack of 180 reading books to be used in the delivery of Switch-on. This bank of reading resources, from a variety of publishers, had an increasing gradient of challenge to meet the needs of all abilities. There was one book for each of the 30 reading levels across 15 colour bands. Books were fictional narrative texts.
4. What (procedures)
Key features of Switch-on and how it was intended to be delivered included:
It was designed to be interactive and to encourage active and independent problem-solving.
It was based on observation, monitoring of progress, and detailed feedback. TAs used ‘Running Records’, a form of shorthand developed by Reading Recovery to record word by word pupils’ mistakes and successes when reading. They used this to ensure pupils were accessing appropriately challenging texts, to develop understanding of how the child was learning, and to provide feedback and tailored prompts.
It was intended to be distinct from classroom learning. This was emphasized in the writing sessions by the use of a different notebook and different pens. Switch-on was nonetheless intended to be embedded in pupils’ wider learning and classroom work through communication between the TA and class teacher. This was emphasised in trainers’ training.
In terms of content, the breakdown of each session is summarised in Figure 1Error! Reference source not found..
Figure 1: Content of Switch-on Reading and Writing
Each session of Switch-on Reading incorporated the revision of at least one familiar text, the introduction of a new text and vocabulary, practising phonics, and some work on comprehension through questions and discussions. There was an expectation that in each session the pupil would read excerpts from four books. In Switch-on Writing, pupils read one book.
In practice, some modifications were made to the regularity and the content of the sessions. This is explored in the Process Evaluation section of this report.
5. Who (implementers)
Switch-on was designed to be delivered by trained TAs. Schools were asked to allocate a minimum of two TAs to the intervention as well as a co-ordinator, who was responsible for supporting and overseeing delivery of the intervention in the school. It was specified that this should be a member of the senior management team.
6. How (mode of delivery)
Switch-on is a personalised one-to-one intervention that is tailored to the needs of individual pupils. It was delivered face to face. No specific guidance was included in the intervention manual about when sessions should take place and if they should be delivered during or outside of class time.
7. Where (setting)
Switch-on Reading session
• independent reading of two familiar books(books that have been read twice before); • taking 'running records' on a book that was
introduced and read once before; • introduction of a new book; and • reading a new book with support.
Switch-on Writing session
• independent reading of a familiar book; • talking about the story and choosing asentence to write; and
The intervention took place in school. No specific guidance was included in the intervention manual about which settings within the school were most appropriate, leaving flexibility for schools to choose. 8. When and how much (dosage)
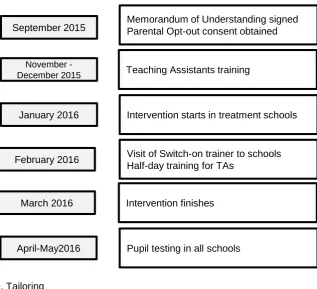
[image:9.595.77.395.194.483.2]Delivery of Switch-on began in schools in the first week of the Spring term (week commencing 4 January 2016) and included daily 20-minute sessions over a ten-week period.
Figure 2: Timeframe of the intervention delivery
9. Tailoring
Switch-on is a manualised intervention and optimal treatment fidelity is emphasised. Nonetheless, TAs were encouraged to adapt their support strategies to the specific needs of pupils.
10. How well (planned)
A ‘train the trainer’ model was adopted in order to maximise implementation effectiveness. In this model the Switch-on developers trained 21 Switch-on trainers, who then went on to train TAs in the participating schools. In October 2015, the Switch-on trainers received two days (14 hours) training on how to deliver Switch-on Reading and Writing. They trained TAs in November and December 2015. TAs and school coordinators both attended training on how to deliver Switch-on in their schools. Those in the Switch-on Reading group received one day of training, while those in the Reading and Writing group received two days (fourteen hours), one day each on reading and writing. The training provided background information on Switch-on, including the rationale for the content and approach, and also included demonstration of the use of the running record used to log the individual pupil’s progress. There was also a video demonstration of the key components of a Switch-on session.
Half way through the programme (at approximately five weeks), TAs received a further half-day training session. Trainers also made one visit to TAs in their schools to observe delivery and provide feedback as well as answer any questions. Switch-on trainers also offered technical support and assistance by phone and email.
September 2015
November -December 2015
January 2016
Memorandum of Understanding signed Parental Opt-out consent obtained
Teaching Assistants training
Intervention starts in treatment schools
February 2016
March 2016
April-May2016
Visit of Switch-on trainer to schools Half-day training for TAs
Intervention finishes
Background evidence
A previous efficacy trial evaluated the reading element of the full Switch-on programme. This trial was funded by the EEF as part of a funding round dedicated to reading catch-up projects for children at the transition from primary to secondary school. The writing component of Switch-on was not included. The earlier efficacy trial involved Year 7 pupils who had not reached a secure level 4 at the end of Key Stage 2. It found that the programme ‘made a noticeable positive impact’ (Gorard et al., 2014, p. 5). The findings suggested that, on average, pupils receiving the intervention would make approximately three additional months’ progress over the course of a term compared with pupils who did not receive the intervention. In particular, the intervention was shown to have a positive impact on the literacy learning of pupils with special educational needs (SEN), those in receipt of pupil premium, and lower attainers (Gorard et. al., 2014, p. 5).
This effectiveness trial sought to test the findings from the efficacy trial on a larger sample of schools using a cascaded ‘training the trainer’ approach. This more accurately reflected the conditions required for a larger scale-up. It also included Switch-on Reading and Writing, as well as Switch-on Reading. The effectiveness trial included pupils in Year 3 rather than Year 7, reflecting the EEF’s focus on early intervention and prevention. In addition, based on their experience of delivering Switch-on, the developers considered this to be the age group most likely to benefit from the intervention.
Evaluation objectives
The trial consisted of an impact study and a process study. The impact evaluation sought to establish whether, and to what extent, Switch-on improved outcomes in reading. The trial was an effectiveness trial, focused on determining how the intervention performs in the circumstances in which schools would normally be implementing it (that is, at scale).
There were three principal research questions tested by the project:
1. What is the impact of Switch-on Reading and Switch-on Reading and Writing on reading outcomes for eligible Year 3 children?
2. Does Switch-on Reading and Writing achieve better outcomes that Switch-on Reading? 3. Are there (positive or negative) spill-over effects on non-participating children that have reading
difficulties, or on non-participating children?
The main aim of the process evaluation was to identify the main enablers and barriers to effective scaling-up of delivery of Switch-on.
The research protocol can be found here:
https://educationendowmentfoundation.org.uk/our-work/projects/switch-on-effectiveness-trial/
Ethical review
NatCen Social Research obtained ethical approval from its internal Research Ethics Committee for the evaluation. Approval was sought for the opt-out process, communications and interviews with TAs, class teachers, co-ordinators, and Switch-on trainers, as well as the pupil testing, data linkage, and analysis of test results. Approval was granted on 31 July 2015.
Project team
The team responsible for delivering Switch-on consisted of: Paula Burrell, Intervention Developer
Teaching Assistants (297)
NatCen Social Research were the independent evaluators. The research team was led by Rakhee Patel and the evaluation design lead was Nico Jabin. They were supported by:
Loraine Bussard, Researcher
Javiera Cartagena, Senior Researcher
Sarah Haywood, Senior Researcher (now at the Department for Work and Pensions) Michael Lumpkin, Research Administrator
Trial registration
Methods
Trial design
The evaluation estimated the impact of the Switch-on intervention on reading outcomes using a three-arm school-randomised controlled effectiveness trial with waitlist. An effectiveness trial aims to assess outcomes under conditions as close as possible to those faced in the real world.1 The trial’s primary focus was to compare the two treatment conditions jointly against a control condition, on the understanding that the differences between the interventions were marginal and of secondary interest.
Switch-on was delivered from January 2016 to March 2016; 184 schools in 17 local areas were recruited and were randomly allocated to one of three groups:
1. Switch-on Reading;
2. Switch-on Reading and Writing; or
3. a ‘business as usual’ control group, with a financial incentive.
Schools in the control condition used their business as usual approach to supporting struggling readers. These schools were offered compensation of £1,500 upon completion of outcome testing, and were given the option to participate in Switch-on training in the following year (to be delivered to any year groups except the trial year group). The evaluation collected information on the nature of support provided in control schools.
Before randomisation, each trial school designated between 4 and 16 eligible pupils from Year 3 to receive the intervention, subject to treatment allocation. All schools were informed that the outcomes of these core trial pupils would be assessed using an intention-to-treat approach (that only the outcomes of the pre-selected pupils would be considered in the impact analysis). The number of pre-selected core pupils was determined by the number of TAs each school assigned to the intervention. Each participating school had to commit between two and four TAs, identified prior to randomisation, and for each TA, schools selected between two and four pupils to receive the intervention.
This design was chosen because it takes into account the resource limitations schools actually face when making choices about targeted interventions and so is appropriate for an effectiveness trial. The requirement for a minimum of two TAs per school was stipulated to ensure peer support was available and to avoid TAs working in isolation.
Participant selection
Schools
Twenty-one Switch-on trainers recruited schools in 17 local areas.2 The local areas were selected by the developers and, in many cases, were areas where they had existing professional links. Any state-maintained, academy, or private primary school located in one of the 17 participating areas where there was not already whole-school implementation of Reading Recovery (that is, where teachers and TAs had been trained in, and practiced, Reading Recovery principles)3 were eligible to participate.
1 An efficacy trial, conversely, aims to detect the potential of an intervention under conditions as ideal as possible. 2 The participating local authorities were Birmingham, Bristol, Cambridgeshire, Cheshire, Coventry, Derbyshire, Northamptonshire, Kent and Medway, Lincolnshire, Nottingham City, Nottinghamshire, Stoke on Trent, Sandwell, Walsall, Warrington, Wiltshire, and Yorkshire.
Only TAs that had not already received training in Switch-on were eligible; there were no additional eligibility criteria. When a school agreed to participate in the trial, the headteacher was required to sign a memorandum of understanding setting out the roles and responsibilities of the school, the evaluators, and the Switch-on delivery team. The memorandum of understanding informed the school about the design of the trial, the consent procedures, and specified what type of data would be collected and when.
Schools were only entered into the randomisation process if they completed a pre-randomisation survey and submitted all of the required data. Shortly after they were recruited to the trial, schools were sent a link to an online pre-intervention questionnaire that asked for information on:
type of school;
participating Year 3 pupils (such as their name, Unique Pupil Number (UPN), date of birth, and reading level);4
how TAs are trained and deployed in the school (for example, whether there was a standard induction for TAs, or whether time was timetabled for TAs and teachers to plan lessons or part of lessons together in advance);
TAs (including qualifications, experience levels in years, and which TAs would be working with pupils);
pupils selected to receive Switch-on and information on why they were selected;
‘reserve’ pupils, in the event that those selected left the school before the start of the intervention;
rooms and equipment available for testing, and the dates of the summer term to plan the testing schedule; and
data on disability and SEN status in an anonymised, aggregated format.
Pupils
Pupils that had not met age-related expectations in literacy at the end of Key Stage 1 (based on teacher assessments carried out at the end of Year 2), and who did not have a high level of special needs, were eligible for selection to the core trial group. Schools were advised to only select pupils for whom, in their view, the intervention would be appropriate. If there were more eligible pupils than the maximum 16 places available, schools were able to select which pupils to include. Pupils that were not pre-selected into the core trial group thus fell into two categories: eligible non-core pupils (those who were eligible but were not allocated to one of the places available) and ineligible pupils. These were included in the secondary analysis as set out below.
When schools were recruited to the trial in September 2015, they were able to select three ‘reserve’ pupils who, if necessary, could replace pupils that left the school before the start of the treatment in January 2016. However, because of the potential for introducing bias in the group of core trial pupils, we did not consider any replacements in the analysis.
Opt-out consent to participation in the trial, and to data linkage, was sought from parents of all pupils in Year 3 in all recruited schools prior to randomisation. The decision to obtain consent from all pupils was taken to allow (a) the investigation of spill-over effects on non-participating eligible and ineligible pupils and (b) whole-class outcome testing, which is less stigmatising for designated trial pupils and does not require opt-in consent.
Outcomes measures
The primary, and only, outcome measure used in the evaluation was the Hodder Group Reading Test (HGRT) 2A (Vincent and Crumpler, 2007).5 This test aims to test reading comprehension at word,
4 Note that information on SEN was not collected at this point as this would have required opt-in consent from pupils and parents. School-level summary information was therefore collected instead.
sentence, and continuous text level and is suitable for use with mixed ability groups. It was chosen because it is targeted at a wide age range (Years 2–6, ages 7–12), thus reducing the risk of floor or ceiling effects, while being non-adaptive and therefore ensuring that all pupils are measured on the same dimensions. It is also paper-based, which allowed whole-class testing in primary schools without adequate IT equipment. HGRT 2 is highly reliable, with a Kuder-Richardson 20/Cronbach’s alpha score of 0.95. Improvement in writing skills from Switch-on Reading and Writing was not tested for as in this evaluation we were interested in the potential impact of the writing component on reading outcomes. Outcomes were collected through whole-class testing over a period of three and a half weeks between 5 and 29 April 2016. Mop-up tests to collect outcomes from pupils that missed the main testing were carried out in 19 schools until 10 May 2016. Testing was overseen by NatCen invigilators who were blind to the treatment assignment of the school. Test papers were scored electronically by NatCen administrative staff who were also blind to treatment assignment.
Sample size
The study planned to recruit 189 schools, nine schools per Switch-on trainer. This meant that between 756 and 3,024 pupils6 were expected to be tested, depending on each school’s choices about the number of pre-selected pupils. For the power calculations, we assumed that the harmonic mean of pupils pre-selected in each school would be five,7 and the number of pupils in the trial therefore 945. Our initial power calculations were based on a joint comparison of Switch-on Reading and Switch-on Reading and Writing against the control. This is because our discussion with the developers and the EEF indicated that the two interventions were conceptually very similar and differences in outcomes of secondary importance. In addition to the overall question, each intervention was also tested separately against the control. Minimum detectable effect sizes (MDES), expressed in standard deviations, are displayed in Table 2. The calculations assumed a power of 80%, a statistical significance level of 5% for a one-sided test, and an intra-class correlation coefficient (ICC) of 0.15 (based on EEF 2015, which suggests an ICC of between 0.08 and 0.15 for Reading at Key Stage 2).
[image:14.595.71.525.559.694.2]The proportion of variance explained can be high for educational interventions if pre-test scores are used (Bloom et al., 2007), and our primary MDES, based on an assumed sample size of 189 schools and a proportion of variance explained by pre-test scores of 0.60, was 0.18 standard deviations. These calculations did not account for attrition.
Table 2: Minimal detectable effect sizes
Number of recruited schools (Switch-on : Control):
126:63 (n = 189)
Unadjusted 0.22
0.20* 0.21
0.40* 0.19
0.60* 0.18
* Proportion of residual variance explained by baseline covariates.
6 If every school selected four pupils, 756 pupils would take part, if every school selected 16 pupils, 3,024 pupils would take part.
Randomisation
Schools were randomly assigned to either of the two treatments or the control condition using randomisation stratified by the Switch-on trainer. As each trainer had capacity to support six schools in the implementation of Switch-on, each trainer was asked to recruit nine schools to the trial. In the event, six trainers recruited eight schools, 14 the expected nine, and one recruited ten schools—a total of 184 schools.
For the randomisation, a random sequence, generated by NatCen using Stata 12, was used to shuffle schools linked to each Switch-on trainer. The first three schools were assigned to Switch-on Reading, the next three to Switch-on Reading and Writing, and the remainder to the control. As a result, 63 schools were assigned to each treatment and 58 to the control condition. This approach is a slight variation to the approach set out in the statistical analysis plan, in which a third of a trainer’s schools would be allocated to each arm with a random tie-breaker if the number of schools was not divisible by three. The adopted approach ensures that each trainer supported the maximum number of schools in the trial, which was felt to be important in the context of an effectiveness trial.
Analysis
Baseline characteristics
Baseline characteristics were summarised for core-trial pupils by intervention group. Variables available at pupil level were presented at pupil level, other variables were presented at school level.
Continuous variables were summarised with descriptive statistics (n, mean, standard deviation, range and median).
At school level, the comparison covered: school type;
urban or rural status of schools;
English as additional language (EAL) status; and Special Educational Needs (SEN) status.
At the pupil level, the following baseline comparisons were presented: Free School Meal (FSM) eligibility;
gender; birth term; and
KS1 reading outcome.
A summary of baseline characteristics is presented in the ‘Outcomes and Analysis’ section of the report.
Primary analysis
The primary analysis examined whether pupils participating in a Switch-on variant had better average reading outcomes four to five months after starting the programme than pupils receiving ‘business as usual’ support for their reading.
Analysis was conducted on an intention-to-treat basis. The main model adjusted estimates and standard errors to baseline reading outcomes (Key Stage 1 teacher reading assessment) and the randomisation stratification variable, the Switch-on trainer, as fixed effects. Confidence intervals were calculated using bootstrapping.
The calculation of the effect sizes followed the methodology for Hedges’ g—using the differences in means between treatment and control groups as numerator, and the pooled standard deviation based on the total variance from a multilevel model as denominator. The effect size calculation was based on Hedges’ (2007) approach assuming unequal sample size per school.
The analysis was run in R version 3.2.1 (R Core Team, 2015) using the EEF’s analytical package for education trials, eefAnalytics, in version 1.04 (Kasim et al., 2016). Confidence intervals were specified at the 5% significance level for a two-sided test.
Sensitivity analyses
A range of sensitivity analyses were carried out to explore the robustness of the main finding:
1. Each treatment arm was compared separately against the control, as set out in the SAP. The analysis assumed coefficients for the included covariates were constant across treatment conditions. No adjustment was made for multiple comparisons as the outcomes of the two interventions are considered to be highly correlated and findings in one intervention are likely to support the finding in the other (Schulz and Grimes, 2005).
2. A wider range of prognostic covariates were included to increase power. These were, at school level: a binary urban/rural indicator for the school, the type of school,8 the total number of pupils, the proportion of pupils eligible for FSM, and the proportion of pupils with English as additional language. At year-group level: the proportion of SEN pupils, and the average baseline reading score. At individual level: gender, absences in Year 2, FSM eligibility, age, and the school term of birth.
3. CACE analysis: any core-trial participants that had not participated in at least 50% of sessions were labelled as non-compliant and a complier average treatment effect (CACE) was estimated. The cut-off was based on the consideration that attending less than 50% of sessions could not be considered as having participated in the intervention in a meaningful way. 4. Imputed values: we explored whether loss-to-follow-up was related to existing covariates or
treatment assignment, used multiple imputation to infer the likely results of those lost to follow-up, and included these imputed data in a sensitivity analysis. In addition, although not specified in the analysis plan, we carried out an analysis that did not assume missing outcome data was ‘missing at random’ (MAR) but is instead ‘missing not at random’ (MNAR). For this purpose we assumed that pupils with missing outcome data would have achieved a score of zero points. Our analysis plan also specified a variant of the CACE analysis where compliance was defined as attending at least 50% of sessions and being taught by a TA who had received the Switch-on training. However, due to the absence of the relevant TA data we could not perform this analysis.
Secondary analyses
In secondary analyses, four hypotheses were examined, as set out below. As these analyses are additional to the main focus of the trial, the results should be considered preliminary and indicative.
H2: pupils participating in Switch-on Reading have different (better or worse) outcomes than pupils participating in Switch-on Reading and Writing.
H3: non-participating eligible pupils in the same class as pupils who participate in Switch-on Reading or Switch-on Reading and Writing will have better reading outcomes than eligible pupils in classes without pupils who participate in either Switch-on programme (positive
over to non-participating eligible pupils). Pupils in treated arms are considered separately, reflecting the idea that core pupils’ learning (which may be different in the two interventions) is passed on to non-participating pupils, for example by raising expectations.
H4: non-participating ineligible pupils in the same class as pupils who participate in Switch-on Reading or Switch-on Reading and Writing will have better reading outcomes than ineligible pupils in classes without pupils who participate in either Switch-on programme (positive spill-over to non-participating ineligible pupils). Treatment arms, again, are compared separately. H5: Switch-on Reading and Switch-on Reading and Writing (jointly considered) will have a
different (higher or lower) impact on FSM pupils.
Analyses for H2 to H4 included the full set of predictive covariates set out in the first sensitivity analysis above. The analysis of H5 included the same set of covariates as the primary analysis, to allow for comparability of the results.
The Statistical Analysis Plan is included in Appendix C.
Implementation and process evaluation
The process evaluation was designed to explore how school staff in participating schools (TAs, class teachers, and co-ordinators) and Switch-on trainers viewed the delivery and implementation of Switch-on, and what they perceived the outcomes to be.
The main research questions were:
What are the key success factors and barriers to successful implementation in a scaled up ‘train the trainer’ model?
To what extent is fidelity to the core elements of Switch-on maintained when implementation is scaled up?
What are the direct and indirect costs of delivering Switch-on?
[image:17.595.71.523.522.699.2]Fieldwork took place between February and March 2016. The components are shown in Table 3. Table 3: Elements of the process evaluation
Elements of the process evaluation Mode
Observation of a Switch-on Reading training session Face-to-face by NatCen researchers Registers to collect information on pupil attendance
at Switch-on sessions
Pupil attendance log kept by TAs and provided to NatCen via Switch-on trainers Interviews with TAs Over the phone by NatCen researchers Interviews with Switch-on trainers Over the phone by NatCen researchers Joint interview with the developers Over the phone by NatCen researchers Observation and interviews in six case-study
schools
Face-to-face by NatCen researchers
Post-intervention survey Online
Observation of a Switch-on training session
Observation of a ‘train the trainer’ session and a TA training session provided the research team with insight into the delivery of the programme. Information gained from these events was used to develop the research tools for the process evaluation.
Registers to collect information on pupil attendance at Switch-on session
During the ten-week Switch-on intervention period, TAs in the treatment schools kept a record of pupil attendance, and noted any absences. They passed this information on to their Switch-on trainers, who entered it into a pro forma provided by the research team and uploaded it to a secure File Transfer Protocol (FTP) site so NatCen could access it. Trainers also provided information on attendance at the TA training sessions and support visits. This information on the ‘dosage’ of the intervention was analysed and informed an assessment of whether fidelity had been maintained in implementation.
Teaching Assistants
TAs from treatment schools were interviewed in order to understand their experience of delivering the programme, how Switch-on fitted into school life, and what they perceived the outcomes, if any, to be. An original sample of 14 TAs was selected to include a good range on the basis of the following characteristics:
intervention group (Switch-on Reading or Switch-on Reading and Writing); number of years of experience;
school practices in relation to TA deployment (induction training and whether TAs have planning time before lessons); and
size of school.
A total of eight TAs were unable to participate. In their place, TAs with similar profiles were approached.
TAs in the sample received an email with an information leaflet and were given the opportunity to opt-out.
The interviews collected the views of TAs on a range of topics including: the training they received;
their workload;
delivering the programme; materials;
views on whether the programme works more successfully with some groups than others, and why;
views on the facilitators to successful implementation; views on the barriers to successful implementation; outcomes for children and reasons for this; and suggestions for improvements to the programme.
Switch-on trainers
Case studies
The aim of the case studies was to build a more detailed understanding of implementation. Day visits were carried out to selected schools. Visits took place around the eighth and ninth weeks of the ten-week Switch-on programme and included:
watching a Switch-on session to view the programme in practice; and interviews with a TA, classroom teacher, and school co-ordinator.
A sample of six schools was selected, half of which had participated in Switch-on Reading, and half in Switch-on Reading and Writing. In addition, across the sample, there were schools with different:
proportions of FSM pupils (low/medium/high);
school practices in relation to TA deployment (induction training; whether TAs have planning time before lessons);
sizes; and
academy/LA status.
Two of the selected schools were unable to participate. In their place, two schools with similar profiles were approached and recruited.
The classroom teacher interviews covered topics such as: the workload created by the programme;
if, and how, teachers had worked with Switch-on TAs; the barriers and facilitators to implementation;
their views on the content of the programme and its suitability for their pupils; how the programme fitted in with their curriculum and schemes of work; perceptions of benefits to pupils; and
suggestions for improvements to the programme.
The school co-ordinator interviews covered similar topics to the classroom teacher interviews
including:
the workload created by the programme;
the barriers and facilitators to implementation and to sustaining the programme across the ten weeks; and
any improvements they would make to the programme.
Developers
One joint interview was conducted with the two developers. This enabled the research team to fully understand the rationale behind the programme, its aims and objectives, how it was intended to be implemented, and their views on how implementation had gone in practice.
Conduct of interviews
Each interview was based on a topic guide to ensure systematic coverage of key issues that addressed the process evaluation research objectives. It was intended to be flexible and interactive, allowing issues of relevance to be covered through detailed follow-up questioning. Separate topic guides were produced for each type of respondent.
To minimise the burden on participants, all interviews, apart from the case studies, were conducted over the telephone. Interviews lasted approximately 45 minutes. The interviews were digitally recorded and then analysed using Framework, a systematic approach to qualitative data
All participants were assured that everything discussed in the interview would remain confidential and would be treated in accordance with the Data Protection Act.
Post-intervention survey
At the end of the intervention, intervention and control schools were sent a link to a short online post-intervention survey. Its purpose was to map post-intervention and delivery in implementation schools and to gather an overview of the other interventions that may have been delivered in control schools—to understand what ‘business as usual’ meant for each school. The link to the survey was sent to the Switch-on co-ordinator in each school. Dosage and fidelity information was collected by asking schools whether the same TAs worked with the pupils throughout the programme, whether any TAs left the school, whether any pupils left the school, and whether the programme was delivered fully in the way it was intended. The survey also collected cost information from all schools.
Of the 184 participating schools, 179 completed post-intervention surveys—a response rate of 97%.
Costs
Information on costs was collected through two tools: the post-intervention survey; and
a cost spreadsheet, provided by the developers, covering all aspects of the delivery, discussed with them in a subsequent interview.
Our estimate of the total cost includes up-front costs (such as training for TAs and the purchase of resources and materials) and running costs (such as TA time to prepare and deliver the Switch-on sessions, and photocopying costs). The costs of developing the intervention are not included.
In order to calculate the total cost per pupil in the intervention’s first year we considered those pupils who were intended to receive either Switch-on Reading or Switch-on Reading and Writing (n = 658). When estimating costs per pupil in the intervention’s second and third years, we assumed that the same number of pupils would receive the intervention.
Timeline
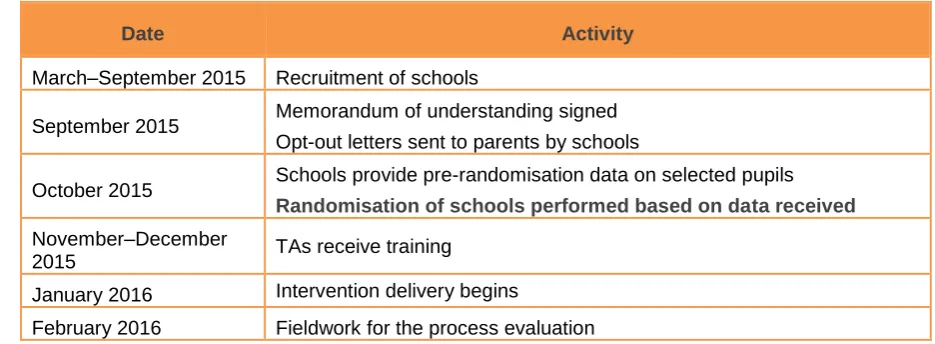
[image:20.595.62.530.588.760.2]Planning for the intervention began in Spring 2015 with initial discussions about the trial with schools. This was followed by memorandums of understanding being signed at the start of the Autumn 2015 term. The intervention was delivered during the Spring 2016 term. Evaluation activities in the field started in January 2016 and ended in May 2016. Table 4 sets out the key evaluation milestones.
Table 4: High level evaluation timeline
Date Activity
March–September 2015 Recruitment of schools
September 2015 Memorandum of understanding signed Opt-out letters sent to parents by schools
October 2015 Schools provide pre-randomisation data on selected pupils Randomisation of schools performed based on data received November–December
2015 TAs receive training January 2016 Intervention delivery begins
March 2016 Intervention finishes April 2016 Pupil testing
May 2016 Schools complete the online post-intervention survey August 2016 NPD outcome data extract obtained
Impact evaluation
Participants
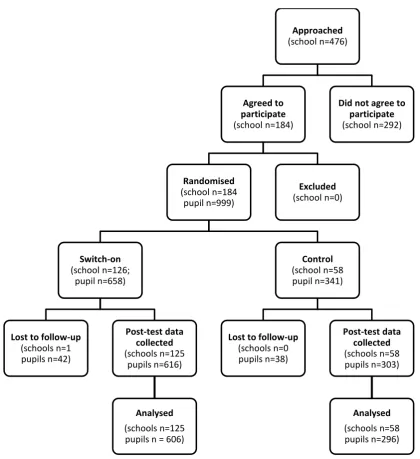
Switch-on trainers approached 476 schools across the 21 areas in which they operated,9 and recruited 184 schools from a target of 189. One of the recruited schools (the only special school) was excluded from the study after randomisation because teachers did not believe the outcome test was appropriate for their pupils.10
In the 184 schools, 9,034 out of 9,185 (98%) pupils provided consent to trial participation and data linkage. Among those providing consent, 2,064 pupils were eligible for the intervention and 999 were pre-selected by schools to participate in the core trial. Eligible pupils had to be in Year 3 (aged seven and eight years), working below age-related expectations at the end of Key Stage 1 (five to seven years), and without a high level of special needs. Schools were able to select pupils who met these criteria and were advised by the Switch-on trainers and evaluation team to only select pupils for whom, in their view, the intervention would be appropriate and beneficial.
Of the 999 pre-selected pupils, 80 were lost to follow-up, so that outcome data of 919 pupils (92% of those assigned) was available for the analysis. For an additional 17 pupils, other covariates included in the primary analysis were missing, meaning that 902 pupils (90%) were included in the primary analysis.
9 Switch-on trainers were responsible for recruiting schools and used a variety of different techniques for that purpose. Some trainers invited all primary schools in their area, while others recruited in a more targeted way. As a result, the number of schools approached by trainers is not an appropriate indicator of schools’ interest in participating in the study.
Figure 3: Participant flow diagram
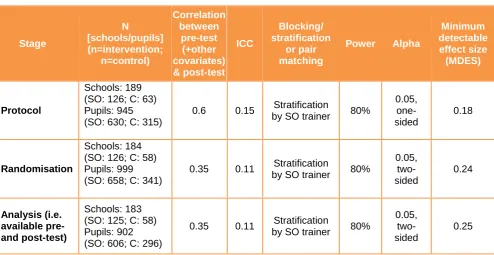
Table 5 sets out the changes in the minimum detectable effect size (MDES) between design and analysis stages. At design stage, the MDES was estimated to be around 0.18 standard deviations, based on the assumptions that the two treatment arms would be jointly compared against the control in the main analysis, that baseline covariates would explain around 60% of the variance of final outcomes, and that the strength of the previous evidence allowed the significance test to be one-sided rather than two-sided.
The MDES at randomisation stage increased to 0.24 standard deviations due to the following factors: It was also decided to use, despite the positive evidence from the efficacy trial, a two-sided test
to conservatively allow testing for negative intervention effects. This was done to better reflect current practice in impact evaluation research.
Approached
(school n=476)
Agreed to participate
(school n=184)
Randomised
(school n=184 pupil n=999)
Switch-on
(school n=126; pupil n=658)
Lost to follow-up
(schools n=1 pupils n=42)
Post-test data collected
(schools n=125 pupils n=616)
Analysed
(schools n=125 pupils n = 606)
Control
(school n=58 pupil n=341)
Lost to follow-up
(schools n=0 pupils n=38)
Post-test data collected
(schools n=58 pupils n=303)
Analysed
(schools n=58 pupils n=296)
Excluded
(school n=0)
Did not agree to participate
[image:23.595.97.518.90.550.2] The baseline covariates were not very predictive of the outcome test results. Our original power calculation assumed that baseline covariates would explain around 60% of variance in the outcome. However, the NPD-based baseline only accounted for 12% of variance (the correlation between baseline and outcome measure was 35%).
It is difficult to know exactly why baseline measures were such a poor predictor of final results. The higher correlation for better-performing pupils (66% for pupils not eligible for the intervention) indicates that regression to the mean may be a factor, a phenomenon whereby extreme scores normalise towards the mean. Regression to the mean occurs due to a proportion of extreme values being the result of chance variation. Another reason may be the difficulty in assessing reading skills adequately at KS1, or the importance of factors not accounted for in the analysis in influencing reading skills during the time of the intervention. Finally, the HGRT outcome test may not be a reliable reading test for low-achieving ‘eligible’ pupils, despite the overall positive evidence on reliability and validity from the standardisation across the range of skills, which showed high internal validity and good high correlation with other measures of reading ability (see Vincent and Crumpler, 2007).
[image:24.595.77.572.326.581.2]The MDES at analysis stage increased marginally to 0.25 due to loss-to-follow-up of some pupils.
Table 5: Minimum detectable effect size at different stages
Stage N [schools/pupils] (n=intervention; n=control) Correlation between pre-test (+other covariates) & post-test ICC Blocking/ stratification or pair matching Power Alpha Minimum detectable effect size (MDES) Protocol Schools: 189 (SO: 126; C: 63) Pupils: 945 (SO: 630; C: 315)
0.6 0.15 Stratification
by SO trainer 80%
0.05, one-sided 0.18 Randomisation Schools: 184 (SO: 126; C: 58) Pupils: 999 (SO: 658; C: 341)
0.35 0.11 Stratification
by SO trainer 80%
0.05, two-sided 0.24 Analysis (i.e. available pre- and post-test) Schools: 183 (SO: 125; C: 58) Pupils: 902 (SO: 606; C: 296)
0.35 0.11 Stratification
by SO trainer 80%
0.05, two-sided
0.25
School and pupil characteristics
Of the 184 schools recruited to the study, one, a special school, was excluded shortly after randomisation due to concerns of teachers about pupil testing. Of the remaining 183, seven in ten (69%) were local authority maintained schools, two in ten (22%) academies, and one in ten (9%) faith schools. Nearly nine in ten (87%) were located in an urban area.
At pupil level, across schools, 40% of core trial pupils were FSM-eligible, and 42% of core trial pupils were female. Pupils missed around 5% of the lessons they could have attended. These percentages do not differ between treatment arms. This is set out in more detail in Table 6.
Importantly, there is no statistically significant difference in baseline scores (KS1 reading score) across treatment arms, with 11.17 points achieved, on average, in Switch-on Reading and Writing as well as the control group, and 11.09 points achieved in Switch-on Reading. The effect size of the difference is 0.00 for Switch-on Reading and Writing against the control, and 0.03 for Switch-on Reading against the control.
Table 6: Baseline comparison
Variable Switch-on Control
School-level (categorical)
n/N (missing) Percentage n/N (missing) Percentage
School-type Local authority maintained school
89/125 (1) 71% 38/58 (0) 66%
Academy 25/125 (1) 20% 15/58 (0) 26%
Faith school 11/125 (1) 9% 5/58 (0) 9%
Rural/urban status
Rural 13/125 (1) 10% 10/56 (2) 18%
Urban 112/125 (1) 90% 46/56 (2) 82%
School-level
(continuous) n (missing) Mean n (missing) Mean
EAL (% of pupils
per school) 123 (3) 16.5 53 (5) 16.4
SEN (% of pupils
in Year 3) 125 (1) 11.7 58 (0) 11.3
Average number of Y3 pupils per school
125 (1) 50.8 58 (0) 48.7
Number of
eligible Y3
pupils
125 (1) 16.7 58 (0) 17.4
Number of pre-selected (core) Y3 trial pupils
125 (1) 5.2 58 (0) 5.9
TAs selected to deliver the intervention, per school
125 (1) 2.4 58 (0) 2.4
Pupil-level
(categorical) n/N (missing) Percentage n/N (missing) Percentage Eligible for FSM 221/606 (52) 36% 115/296 (45) 39% Gender (female) 256/606 (52) 42% 122/296 (45) 41% Birth term
Spring 273/606 (52) 45% 129/296 (45) 44%
Summer 239/606 (52) 39% 113/296 (45) 38%
Autumn 94/606 (52) 16% 54/296 (45) 18%
Pupil-level
(continuous) n (missing) Mean n (missing) Mean
KS1 reading
Absences
(%) 606 (52) 4.9 296 (45) 5.0
There is a statistically significant difference in loss-to-follow-up between trial arms in the core trial group (see Table 7). The Switch-on Reading arm lost 7.4% of pupils at follow-up, Switch-on Reading and Writing 5.2%, and the control group 11.1%. Differential loss-to-follow-up can introduce bias in effect estimates to the extent that the differences are related to outcomes, that is, that the likelihood of being a poor or good reader is linked to the likelihood of missing the outcome test.
The large and statistically significant difference in loss-to-follow-up between trial groups raises the possibility that loss-to-follow-up is linked to outcomes, since eligible non-participating pupils were substantially more likely to miss the outcome test (23% did so) than ineligible, adequate readers (of whom 5% missed the test). Teachers may have felt that participation in a test was not appropriate for some pupils who would have achieved lower scores. However, it may also reflect a higher likelihood of absences in the eligible compared to the ineligible group.
[image:26.595.71.271.379.492.2]The difference in missingness between trial arms of the core group thus may be problematic if it reflects teachers’ propensity to prevent poorly performing pupils from being tested, or less problematic if other, less strongly outcome-related reasons are the cause. The imputation of missing outcome values thus becomes an important sensitivity analysis.
Table 7: Percentage of pupils lost to follow-up, per trial group and treatment arm
Control %
SO R %
SO RW %
Core 11.1 7.4 5.2
Eligible 23.1 25.1 19.9 Ineligible 5.0 5.7 4.2
Outcomes and analysis
Primary analysis
The average post-intervention outcome scores for the core trial group, as measured by the Hodder Group Reading Test 2a, were 15.99 and 15.81 for Switch-on and the control group, respectively. The estimate of the average treatment effect, rounded to two decimal places, was 0.00. (Table 8).
Table 8: Raw outcome test scores by treatment arm
Switch-on Reading Control group
Number of pupils
(missing) 606 (52) 296 (45)
Mean
(95% confidence interval)
Effect size of comparison against control group
0.00
Confidence interval for comparison against control
(-0.13, 0.13)
Intra-class correlation in comparison against control
0.16
Sensitivity analyses
The three sets of sensitivity analyses support the robustness of the primary analysis estimates.
1. Comparing Switch-on Reading and Switch-on Reading and Writing separately against the control
Our Statistical Analysis Plan differed from our original protocol and the primary analysis presented by proposing to analyse Switch-on Reading and Switch-on Reading and Writing separately against the control. It was felt, at the time, that this was necessary to reflect the remaining uncertainty about the importance of the differences between the two intervention forms. However, following discussions with the EEF, we decided to revert to our original plan of a joint analysis in order to maximise statistical power. For transparency, we present here the analysis proposed in the SAP, which comes to the same conclusion of no evidence of an effect.
2. Wider range of prognostic factors
In the first sensitivity analysis we included additional prognostic factors to reduce the variance around the estimated effect and offset the influence of any baseline imbalances in these factors. We added: At school level:
a binary urban/rural indicator for the school; the type of school;11
the total number of pupils;
the proportion of pupils eligible for FSM; and
the proportion of pupils with English as additional language. At year-group level:
the proportion of pupils with special educational needs; and the average baseline reading score.
At individual level: gender;
absences in Year 2; FSM eligibility; age; and
the school term of birth.
The results, set out in Table 9, show no change in the estimated effect of 0.00. As before, this estimate is not statistically significant.
3. Complier average causal effect
Non-attendance, or, in the case of the control group, take-up of treatment despite control group assignment, can lead to an underestimation of the true treatment effect when using an intention-to-treat approach. The estimation of the complier average causal effect (CACE) aims to take account of non-compliance to offer a better estimate of the true treatment effect. A core assumption of CACE analysis is that treatment outcomes are not dependent on the random allocation, in other words, that non-compliers in treatment and control groups have the same expected outcome as that of non-compliers in the alternative group.
In the present case, the difference of CACE estimates to the primary analysis estimates will be small because compliance was very high. No control-group pupils took up the treatment. In the treatment group, over seven in ten (71%) of all possible treatment sessions were attended by pupils across the two treatment arms, and nearly nine in ten (89%) of pupils attended at least 50% of sessions.
The point estimate of the effect of Switchon on pupils attending at least 50% of sessions is 0.01 (CI: -0.16 to 0.14), and for pupils attending at least 80% of sessions -0.02 (CI: -0.29 to 0.25).
4. Loss-to-follow-up
Finally, we examined the effect of loss-to-follow-up on estimated effects under two different assumptions concerning missing data mechanisms: that outcome data were missing at random (MAR) and missing not at random (MNAR). MAR assumes that, except for random variation, missing outcomes can be predicted from other existing data, without bias. For example, pupils with higher levels of absence are more likely to perform poorly in the outcome test, but their performance does not also depend on, say, their teachers’ judgement on how well the pupil would do in the test (on which we have no data). MNAR assumes that the missing data is related to the values of unobserved data. For example, participants judged by teachers to have lower levels of literacy may be less likely to complete the outcome measure. It is important to note that we cannot know whether our missing data is missing at random or missing not at random.
Assessment under the MAR assumption started, first, by exploring whether loss-to-follow-up was related to any prognostic variable or treatment assignment and, second, by running our expanded model with imputed missing outcome values.
Loss-to-follow-up rates were 7.4% in the Switch-on Reading arm, 5.2% in the Switch-on Reading and Writing arm, and 11.1% in the control arm.
A multi-level logit model showed that the likelihood of missing data was predicted by higher absences, lower treatment attendance rates in the treatment groups, attending a faith school, and the trial arm. Once imputed missing outcomes were included in the model, the estimated effect (0.03 standard deviations) was of similar magnitude as the effect estimated in the primary analysis, and not statistically significant.
Table 9: Effect sizes of sensitivity analyses
n (missing) Effect size Confidence intervals
Separate analysis of Switch-on Reading and Switch-on Reading and Writing
Switch-on Reading 612 (79) -0.04 (-0.19, 0.11)
Switch-on Reading
and Writing 586 (63) 0.05 (-0.10, 0.19)
Additional prognostic factors
Switch-on vs. control 849 (150) 0.00 (-0.15, 0.15)
Complier Average Causal Effect (CACE) Attended at least 50%
of sessions 860 (139) -0.01 (-0.16 0.14)
Attended at least 80%
of sessions 860 (139) -0.02 (-0.29, 0.25)
Imputed outcome values (multiple imputation assuming MAR)
Switch-on vs. control 978 (21) 0.03 (-0.12, 0.13)
Imputed outcome values (manual imputation assuming MNAR)
Switch-on vs. control 974 (25) 0.12 (-0.02, 0.23)
Secondary analyses
Four additional analyses were carried out, as specified in the analysis plan. The results are summarised in Table 10.
H2: Difference in impact between Switch-on Reading and Switch-on Reading and Writing
The first compared the two treatment arms, Switch-on Reading with Switch-on Reading and Writing. We found no difference in effect between the two treatment variants, although it should be noted that the trial was powered to detect only very large differences with certainty. The point estimate, not statistically significant, was 0.08 standard deviations (CI: -0.05, 0.22) in favour of Switch-on Reading and Writing.
H3: Impact on non-participating eligible pupils
appear to differ on at least one attribute due to random sampling error alone and may lead to false conclusions that an observed difference is ‘real’.
H4: Impact on ineligible pupils
Our trial also pointed towards a positive spill-over effect on non-eligible pupils. Results showed a low, statistically significant positive effect (of 0.11 standard deviations) on the reading outcomes of ineligible pupils. In the light of our previous findings, these results could be hypothesised to arise from the removal of under-performing pupils from the classroom, although again, these findings are only indicative and may be spurious.
H5: Impact on core trial pupils eligible for free school meals
[image:30.595.74.539.317.477.2]Our final secondary analysis explored the effect of the Switch-on variants on FSM pupils. A subgroup analysis showed no effect of either treatment arm. The point estimates in each case are more extreme than those of the full sample, so that Switch-on Reading shows a larger negative effect on FSM pupils, and Switch-on Reading and Writing a larger positive one. An interaction test also failed to find a statistically significant effect.
Table 10: Effect sizes of secondary analyses
n (missing)
Effect size (Hedge’s g)
Confidence interval
Intra-class correlation
H2: Comparing Switch-on Reading and Writing over Switch-on Reading
606 (10) 0.08 (-0.05, 0.22) 0.21
H3: Non-participating eligible
pupils 719 (346) -0.31 (-0.47, -0.13) 0.12
H4: Ineligible pupils 6309 (661) 0.11 (0.06, 0.17) 0.12 H5: FSM subgroup analysis 336 (61) 0.03 (-0.18, 0.20) 0.17
Additional checks
In addition to the above analyses, we examined the possibility of floor effects in the outcome measure. Floor effects occur when a non-trivial proportion of trial participants (in either treatment arm) achieve the lowest possible score. In that case it is no longer possible to distinguish between better- and worse-performing pupils achieving this score, and consequently improvements due to the intervention may go undetected.
Figure 4: Histogram of trial outcomes for core group
Cost
The cost estimate presented here relates to the cost to schools of implementing the intervention without EEF funding. Our estimate of the cost of a school participating includes:
up-front costs, such as buying the Switch-on set of reading books, the Switch-on manual and teaching materials, fees for the initial and follow-up training, and staff time required for attendance at training; and
running costs, such as the time of TAs to prepare for and deliver sessions, the time of co-ordinators in schools to support TAs, and the costs of photocopying materials.
Our estimates are based on 658 pupils receiving the intervention in 126 participating schools (63 in each treated arm) with 296 TAs and 126 co-ordinators. This equates to approximately five pupils, two or three TAs, and one co-ordinator per school. Costs incurred by the Switch-on developers to train the trainers and pay their professional fees are not included in our estimates.
The following sections show the components of costs incurred by schools and present the cost per pupil.
Overall, the cost of the intervention was estimated at £359,499, and the total cost per pupil, over the first year, was estimated at £546.35.
Up-front costs and running costs
programme received half a day of follow-up training after they had started delivering the intervention. The fee for two days (fourteen hours) of training is approximately £300.12
Delivering Switch-on required a considerable investment of time by TAs. As well as the daily 20-minute session with each pupil, schools reported that each TA spent an average of 1.5 hours per day preparing to deliver Switch-on and writing up notes after sessions. Schools also reported that co-ordinators spent around 1.5 days (10.5 hours) across the ten-week period supporting TAs in their delivery. Therefore, on the basis of seven working hours per day, a total of 4,067 hours were spent by staff (co-ordinators and TAs) when preparing the sessions. Additionally, 33,390 hours were spent in total by staff when delivering the intervention.
[image:32.595.73.529.282.710.2]The only direct running costs identified relate to photocopying forms and ‘running records’, and the occasional purchase of additional books. This averaged approximately £13.75 per school (£1,733 in total).
Table 11: Trial total up-front and running costs
Up-Front Costs
Item
Time in Days
(hours)
Cost (£)
Switch-on folder and teaching materials
6,444
Time for co-ordinator to attend training (Reading and Writing)
126 (882)
Time for co-ordinator to attend training ( Reading)
63 (441)
Time for TAs to attend training (Reading and Writing)
370 (2,310)
Time for TAs to attend training ( Reading)
222 (1,554)
<