A Novel CBIR-Based System using Texture Fused
LBP Variants and GLCM Features
Meenakshi Garg,
Manisha Malhotra,
Harpal Singh
Abstract: This paper presents Multiple-features extraction and reduction for Content-Based Image Retrieval (CBIR). At first, discrete wavelet transform (DWT) is applied on the R, G and B channels to get multi-level decomposition of the image in which approximation and detailed coefficients are extracted. Approximation coefficients contain the main content of the image while detailed coefficients provide the local noise variation in the image. Further computationally efficient and rotation- invariant Dominant-Rotated Local Binary Pattern called a texture descriptor is applied on all approximation and detailed coefficients. By calculating the descriptor relative to reference in a local neighbor patch, a rotation invariance feature image is obtained. The proposed methodology contains the complete structural information extracted by the Local Binary Patterns and also extract the extra information using the information of magnitude, thus attaining extra discriminative power. Then, by getting the Dominant Rotated Local Binary Pattern image, concept of GLCM has been used to extract the statistical characteristics for the classification of texture images. GLCM directly works with the intensity of the images and also provides the spatial relationship of the pixels in the image by calculating frequency of occurring of similar patterns in different directions which makes it useful for the extraction of texture characteristics. GLCM has been improvised into a generalized co-occurrence matrix that extracts significant spatial properties from the distribution of local maxima. Further Median Robust Extended Local Binary Pattern is extracted out of the approximation and detailed coefficients and also the histogram is calculated out of them. Unlike the traditional LBP method and several variants of the LBP, Median Robust Extended Local Binary Pattern compares the local median of images instead of intensities of the raw images. It is a multiscale LBP-type descriptor that proficiently compares the image medians with novel sampling schemes, capable of capturing both microstructure and macrostructure. Further feature concatenation is applied in which GLCM features of DRLBP and histogram of MRELBP are combined for getting a large feature vector. Further, we applied a mutual information concept to sort out the most differentiable features for all categories of CORAL dataset which are further fed to particle swarm optimization-based feature selector which reduced the number of features that can be used in the classification phase. PSO uses the SVM classifier in evaluating its objective function which is average precision value for the selected features. PSO tries to increase precision value for all the categories and provides a feature vector with a large precision value when classify by SVM. Further three classifiers are trained ad tested named SVM, KNN and decision tree in which SVM gives high accuracy and precision rates of classification. Experimental results show above 94% accuracy and .80 to .90 precision values for most of the categories of CORAL dataset.
Keywords: CBIR, MLBP, DRLBP, PSO, SVM, Feature selection, classification etc.
Revised Manuscript Received on December 05, 2019.
Meenakshi Garg, University Institute of Computing, Chandigarh University, Mohali, Punjab, India. Email: [email protected]
Manisha Malhotra, University Institute of Computing, Chandigarh University, Mohali, Punjab, India. Email: [email protected]
Harpal Singh, Department of Electronics and Communication Engineering, CEC Landran, Punjab, India. Email: [email protected]
I. INTRODUCTION
A Novel CBIR-Based System using Texture Fused LBP Variants and GLCM Features
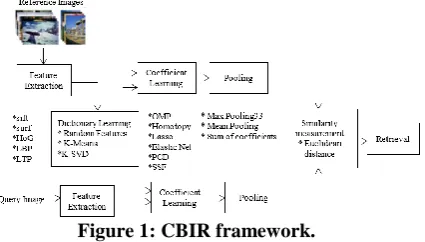
[image:2.595.70.283.136.257.2]In addition, local descriptors are extracted from the entire image in which specifically utilized for CBIR are I: Scale Scaling (SIFT) [11], Robust Accelerating Characteristics (SURF) [12], HoG Histograms (HoD) [13], Local-Binary patterns (LBP) [14]. In addition to these DFLs, the variants of LBP‟s have been proposed as an effective version of the traditional Local Binary Patterns [15].
Figure 1: CBIR framework.
The second and the main step of the CBIR models is the measure of similarity. This attempts to decrease the semantic gap [10]. In the CBIR‟s initial years, the emphasis was placed on the different similarity measures required for each individual characteristic. The similarity
measures like Mahalanobis and Euclidean distances are used to calculate the resemblance between the image descriptors. Although, learning of similarities has became popular instead of measuring the similarity recently used [10], [16]. In addition, machine learning is also becoming popular in modern research for CBIR [17] [18]. The machine performance could be improved by taking large datasets for training [19], [20]. In recent years, SAR is typically utilized in the CBIR approaches in second stage. In SAR approach, a dictionary based set of scattered coefficients are represented by the input signals with simple combination.
II. RELATED WORKS
LBP texture features are based on local characteristics for difference in the pixel value of boundary pixels in a window to a centered reference pixel and are created by the weighted combination in the various directions. Meanwhile, the local binary pattern uniform has produced inappropriate patterns for the uneven-edge shapes and textures.
Liao et al. [21], proposed a method of dominant low back pain. The Dominant local binary pattern is very robust for the image rotation and histogram equalization and is more robust against noise than the local binary pattern.
Gue et al. [22], suggested that for the preservation of the global spatial information of images, a local binary pattern variance descriptor is used. Afterwards, they built up more complete local binary pattern descriptor than conventional local binary pattern for the local texture characteristics [23]. On the basis of the combination of the local binary pattern and the Haar wavelets.
Su et al. [24], suggested various characteristics of the Haar local binary model (SLBHP). In SLBHP, the polarity of difference is considered rather than to the calculate the amplitude difference between the neighboring and the referenced pixel, is taken into account.
Ahonen et al., suggested the histograms which are flexible for the LBP (SLBP) that are noise resistant as compare to the conventional LBP [25].
Lakovid et al. [26], proposed a diffused local binary configuration (FLBP), another form of LBP, where local texture patterns are represented by the fuzzy logic. The Oriented Gradient Histogram (HOG) is used to extract the texture features of the local information that depends upon the local intensity gradient distribution and suits in appications of object detection [27]. Also, appearance of the object and the shape is characterized by the local gradient distribution. At First, images are divided in the numerous regions on the basis of computed gradient. At last, each block‟s normalized histogram is determined as a final feature vector. In this method, lots of memory is consumed by the feature vector because it is very long.
Chandrasekhar et al. [28], proposed a compressed HOG method that was a low-throughput HOG type. Afterwards, several quantization schemes for compressed HOG are presented [29].
Wang et al. [30], showed that some databases, results in a considerable improvement in the recovery performance by combining the features of LBP and HOG.
Tan et al. [31], showed that the characteristics of LBP were very noise-sensitive in image regions that are uniform and introduced the Local Ternary feature based model.
Gou et al. [32], represents the local derivative model in which deep details are extracted using second-order derivatives or higher. Such LDP‟s describes the derived address changes for a considered pixel and its adjoined pixels and are not rotationaly invariant.
Guo et al. [33] used a Local-Directional Drift Model in which pattern histogram is constructed as characteristics in order to obtain rotation invariant features. Though, the derivative order of the reference pixel and its neighbor pixel is computed without regard to the LDDP address [33]. The characteristics that are extracted from these methods are simply based on the positive and the negative directions of the edges. Further, improvments can be made by differentiating the edges in multi directions to obtain the higher-order yield.
Bakshi et al. [34] showed that by applying the Fourier transformation to local ternary patterns, the accuracy of retrieval of the medical image can be improved because of the strong redundancy in these features.
Hung et al. [35] used the local standard vector in which LVP models are generated by calculating multiple point derivatives in the different directions by combining these derivatives. Comparative Space Transformation, a new algorithm, is introduced to reduce size of feature vectors. By implementing linear-dynamic decision function, the Comparative Space Transformation extracts the functions with more information and also noise resistant.
III. FEATURE EXTRACTION 3.1 DWT
Wavelets are the small waves with changing frequency. Its duration is very limited [36]. These are used in multi-resolution analysis. At multiple multi-resolution all the images are analyzed and represented. Small sized and low contrasted objects are observed at the high resolution and huge are huge and high contrasted objects are analyzed at the coarse level. The idea of multi-resolution analysis is useful when a picture comprises of small and large and also has low and high contrast objects. All images at multi-resolution are useful. Undetected features at one resolution can be identified at other resolution. DWT is simpler to implement the and gives adequate data for the analysis and for the synthesis. The signals are decomposed into the approximation coefficients and in the detailed coefficients in which detailed coefficients are computed in horizontal, diagonal direction and also separately formed the feature vector. This feature vector can be utilized for retrieving the same type of images and can be combined with other for CBIR. At different resolutions the signals with different bands are analyzed and at the next resolution, approximation coefficients are further brake which creates three detailed co-efficient. Features left in last step decomposition are extracted by the coefficients and form the feature vector for retrieval.
[image:3.595.307.547.413.531.2]B. Dominant Rotated Local Binary Pattern (DRLBP) It is an effective texture rotation invariant descriptor that is used in feature extraction phase along with median local binary patterns. This property is attained by calculating the descriptor with course to some local reference which is high value of pixel taken as dominant pixel. This Dominant direction is invariant to the monotonic gray value variation [37].
Figure 2: Effect of rotation on the LBP and the RLBP operator [37].
𝐿𝑜𝑐𝑎𝑙𝑏𝑖𝑛𝑎𝑟𝑦𝑝𝑎𝑡𝑡𝑒𝑟𝑛𝑅,𝑃= 𝑃−1𝑝=0𝑆 𝑥𝑝− 𝑥𝑐 . 2𝑝, 𝑠 𝑥𝑝−
𝑥𝑐=&1𝑥𝑝≥𝑥𝑐&0𝑥𝑝<𝑥𝑐 (1)
𝐷 = 𝑎𝑟𝑔 𝑚𝑎𝑥 𝑥𝑝− 𝑥𝑐
𝑝 ∈ 0,1. . . 𝑃 − 1
(2)
𝑅𝑜𝑡𝑎𝑡𝑒𝑑𝐿𝐵𝑃𝑅,𝑃= 𝑃−1𝑃=0𝑠 𝑥𝑝− 𝑥𝑐 . 2𝑚𝑜𝑑 𝑝−𝐷,𝑃 (3)
In equations above, the weighting term depends upon the D. The used mod operator swings the weights in circular fashion by starting from the dominant pixel such that pattern of weights remained same irrespective of the rotation of the image. The change causes rotational invariance because the weights are now dependent on neighborhood and not on a
preselected array. In Figure 2, effect of rotation on the characteristics of the RLBP are shown. Red color shows the pixels above the threshold value, and the yellow color shows the pixels corresponding to the dominant direction D. The bit corresponds to the index D always takes the weights that are less than 1, and the other weights are moved from circular way. Figure 2 (g), shows that the weights that are correspond to the dominant position are same for the original images and for the rotated images, while all these pixels are at the different locations. Therefore, in this case, the RLBP values that are obtained for two different rotational neighborhoods are similar, for example, the riLBP parameter produces the same function values for the rotated image and for the host image as rotated and host versions constitutes bit pattern to the same value of the function. If modified-neighborhood has been considered with the value 221 exchanged with the value -pixel 78, and it originates separate pattern and must be represented with a different characteristic value. The riLBP operator also provides the same function value because all the rotated patterns give the same values, irrespective of magnitude of pixel-difference. Therefore, edge information is ignored by the riLBP and takes into account when calculates the RLBP function.
C. Median Robust Extended Local Binary pattern (MRELBP)
The authors in [38] proposed the ELBP method, in which four descriptors similar to LBP are used based on Center-pixel Intensity, Neighborhood-Center-pixel Intensity, Radial Differences and Angular Differences [39].
Figure 3: Represents the MRELBP descriptor with
r
2 radius andx
c center pixel [38].Main difference between ELBP method [38] and MRELBP method, In ELBP method, only the values of the single pixel are used, while in MRELBP method, windowed, scaled, and median approach is used [39].
ELBP method [38] is vulnerable to image noises, hence first approach is replacing the intensity values of individual pixel with that of representative over that region which is termed as Median Robust Extended LBP‟s (MRELBP). In this, raw pixel values are replaced with the median obtained from local-patches. In modified ELBP descriptor [38], individual pixel intensities at the sampled points are replaced by the median values. Similar to existed ELBP, Images are normalized to zero-mean, unit-variance and standard encoding scheme is used. Joint histograms of MRELBP CI,
2 ,
_
r priuMRELBP
NI
and2 ,
_
r priuMRELBP
NI
are used [image:3.595.51.280.460.710.2]A Novel CBIR-Based System using Texture Fused LBP Variants and GLCM Features
[image:4.595.49.294.55.242.2]image as illustrated in Figure. 2 and in Figure 4.
Figure 4: Evaluation procedure of multi-scale MRELBP descriptor and concatenated feature-set [38].
1. MRELBP CI
𝑀𝑅𝐸𝐿𝐵𝑃_ 𝐶𝐼 𝑥𝑐 = 𝑠 𝜙𝑋𝑐,𝑤 − 𝜇𝑤)
(4)
where
X
c w, represents local-patch centered around centralpixel
x
c considered for feature extraction and the function ϕ(X) determine median of local-patch and
w is the mean of the image.2. MRELBP NI
𝑀𝑅𝐸𝐿𝐵𝑃_𝑁𝐼𝑟𝑎 ,𝑝 𝑥𝑐
= 𝑆
𝑝−1
𝑛=0
𝜙 𝑋𝑟𝑎 ,𝑝,𝑤𝑟𝑎,𝑛 − 𝜇𝑟𝑎 ,𝑝,𝑤𝑟𝑎 2
𝑛
𝜇𝑟𝑎 ,𝑝 ,𝑤𝑟𝑎 = 1
𝑝 𝜙 𝑋𝑟𝑎 ,𝑝,𝑤𝑟𝑎,𝑛
𝑝−1 𝑛=0
(5)
where , , ,
ra
ra p w n
X
denotes the patch of sizew
ra
w
ra centered at pixelX
ra p n, ,3. MRELBP RD
MRELBP_RD𝑟𝑎 ,𝑟𝑎 −1,𝑝,𝑤𝑟,𝑤𝑟−1= 𝑆 𝑝 −1
𝑛 =0 𝜙 𝑋𝑟𝑎 ,𝑝,𝑤𝑟,𝑛 −
𝜙𝑋𝑟𝑎−1,𝑝,𝑤𝑟𝑎−1,𝑛2𝑛
(6)
where , , ,
ra
ra p w n
X
denotes the patches around neighborpixels
x
ra p n, , arranged on circle around centered pixelx
c having radius ra.D. Gray level co-occurrence matrix
In this, host image is converted into a matrix which responds to the relation of pixel values on a certain distance. It evaluated the mutual-occurrence of two pixel pair values
with particular distances and directions in which horizontal, vertical and diagonal directions are considered [40].
𝐺𝑑𝑖𝑠𝑡𝑡ℎ𝑒𝑡𝑎 𝑖, 𝑗 = {( 𝑥, 𝑦 , 𝑚, 𝑛() 𝐼 𝑥, 𝑦 𝑚, 𝑛) 𝑗}
𝑤ℎ𝑒𝑟𝑒( 𝑥, 𝑦) , (𝑚, 𝑛) ∈ 𝑁𝑥× 𝑁𝑦 (7)
(𝑚, 𝑛) = (𝑥 + 𝑑𝑖𝑠𝑡× 𝑡ℎ𝑒𝑡𝑎1, 𝑦 + 𝑑𝑖𝑠𝑡 × 𝑡ℎ𝑒𝑡𝑎2)
(8)
where
G
distthetais the gray-level co-occurrence matrix ofdistance dist and angle theta.
I
x y
,
andI
(m, n)
are thepixel intensity at position
( , )
m n
. Values oftheta
1and2
theta
depend on direction and evaluated using Table 1. [image:4.595.310.562.409.595.2]Figure 5 presents an example to calculate GLCM in which first matrix is matrix transformation and second matrix is host image. Consider a pixel pair (2,2) with distance one and theta zero degree marked in red in matrix one finds three times in the host image which sets the GLCM value for this pair as three. Other pairs are also computed in similar fashion
Table 1: Theta one and two correspond to theta in gray-level co-occurrence matrix [40]
Theta (deg) Theta1 Theta 2
zero 0 1
Forty-five -1 1
Ninety -1 0
One-thirty- five -1 -1
Figure 5: An example GLCM computation [40] In existed works, usually local binary patterns are considered as histograms for feature extraction and does not includes the patterns with their frequency. By taking GLCM along different directions and distances, an improved feature extraction phase is introduced in which Dominant Rotated Local Binary Pattern (DRLBP) is used. First DRLBP is calculated from multi-scale decomposed detailed and approximation coefficients obtained from red, green and blue components of original image using discrete wavelet transform. Then GLCM pattern map is obtained by considering four direction and two distances.
[image:4.595.48.285.425.686.2]different distances and directions are explored in order to obtain better feature extra traction. The combinations observed are displayed in Figure 6.
Figure 6: Different combinations obtained using different distance and directional characteristics [40].
1. In Fig. 6(a), GLCM is obtained by taking distance value one and four directions as [0 45 90 135] degree
2. In Fig. 6(b), GLCM is obtained by taking distance value two and four directions as [0 45 90 135] degree
3. In Fig. 6(c), GLCM is obtained by taking both distance value one in directions zero and forty-five degree.
4. In Fig. 6(d), GLCM is obtained by taking both distance value one but in directions zero and ninety degree
All four matrices have been concatenated to get single feature-vector.
𝐼𝑚 𝑔 = 𝐷𝑅𝐿𝐵𝑃(𝑑𝑤𝑡𝑐𝑜𝑒𝑓𝑓𝑖𝑐𝑖𝑒𝑛𝑡𝑠) 𝐺𝐿𝐶𝑀𝑑𝑖𝑠𝑡𝑡ℎ𝑒𝑡𝑎(𝐼𝑚 𝑔) = 𝐺𝑑𝑖𝑠𝑡𝑡ℎ𝑒𝑡𝑎 𝑖, 𝑗 ∀ 𝑖, 𝑗 ∈ 𝐼𝑚 𝑔
(9) where Img is the DRLBP image-map. Four combinations of GLCM as explained above, have been used to create four different feature vectors.
𝐹𝑉1 𝐼 = [𝐺𝐿𝐶𝑀10 𝑜
𝐺𝐿𝐶𝑀145 𝑜
𝐺𝐿𝐶𝑀190 𝑜
𝐺𝐿𝐶𝑀1135 𝑜
]
…… (10)
𝐹𝑉2 𝐼 = [𝐺𝐿𝐶𝑀20 𝑜
𝐺𝐿𝐶𝑀245 𝑜
𝐺𝐿𝐶𝑀290 𝑜
𝐺𝐿𝐶𝑀2135 𝑜
]
(11)
𝐹𝑉3 𝐼 = [𝐺𝐿𝐶𝑀10 𝑜
𝐺𝐿𝐶𝑀145 𝑜
𝐺𝐿𝐶𝑀20 𝑜
𝐺𝐿𝐶𝑀245 𝑜
]
(12)
𝐹𝑉4 𝐼 = [𝐺𝐿𝐶𝑀10 𝑜
𝐺𝐿𝐶𝑀190 𝑜
𝐺𝐿𝐶𝑀20 𝑜
𝐺𝐿𝐶𝑀290 𝑜
]
(13)
By obtaining GLCM in different directions and distances, more spatial information is obtained present in neighbor pixels which extracts frequency of similar patterns in different directions.
E. Steps in Feature extraction phase
The steps involved in feature extraction phase have been given in this section along the flowchart containing sequence of steps, Figure 7.
Input: Image. Output: Feature vector.
1. Separate Red, Green and Blue components and apply Discrete wavelet transform based multi-scale decomposition.
2. Apply MELBP and DRLBP map of approximation and detailed coefficients at level one.
3. BY taking DRLBP image for all type of coefficients, obtain the GLCM features as below for each R, G and B component
Evaluate gray level co-occurrence matrixes with distance one and two and along four directions 0, 45, 90 and 135. Convert all the matrices obtained above into one
dimensional vector.
Concatenate all vectors into a single feature vector. 4. Concatenate GLCM features for all type of coefficients 5. Obtain Histogram features of DRLBP and MELBP
images and concatenate with GLCM concatenated vector
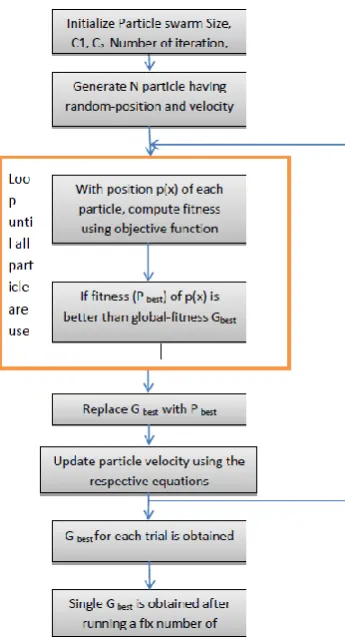
Figure 7: Flowchart of feature extraction phase IV. FEATURE SELECTION USING PSO (PARTICLE
SWARM OPTIMIZATION)
A. Proposed Multi-class Particle Swarm Optimization for feature selection
[image:5.595.57.269.96.258.2]A Novel CBIR-Based System using Texture Fused LBP Variants and GLCM Features
PSO is a meta-heuristic algorithm, developed by Kennedy and Eberhart in 2001 [41] widely used for distinct, continuous or combinatorial optimization applications. Inspire from flying pattern of a flock of birds, a particle in it denotes a single solution and collection of all is named as swarm. Each particle has its own current velocity and own best configuration p-Best achieved till last iteration and that particle which provides current global best in whole swarm is noted by G-best. In new iteration, each particle sets its own velocity in order to come more close to its p-best as well as G-best of the swarm [42].The velocity of each particle, v, is updated according to the following equation:
𝑣𝑒𝑙𝑜𝑐𝑖𝑡𝑦𝑖,𝑗 𝑡 + 1 = 𝑤 × 𝑣𝑒𝑙𝑜𝑐𝑖𝑡𝑦𝑖,𝑗(𝑡) + 𝑐𝑝× 𝑟𝑝×
𝑝_𝐵𝑒𝑠𝑡𝑖,𝑗− 𝑥𝑖,𝑗 𝑡 + 𝑐𝑔× 𝑟𝑔× 𝑔_𝐵𝑒𝑠𝑡𝑗− 𝑥𝑖,𝑗 𝑡
(14)
where x the current position of the particle
,
velocity
i j, is velocity of the ith particle dimension j, w is a constant named as momentum that adjusts velocity of current iteration with respect to the previous one,c
p, and cg arefix-constants initiated in the start. In addition, the ability of the algorithm for exploration /exploitation can adjust by modification of cp and cg in new iteration. Updated position of ith particle in dimension j is taken as in equation below:
𝑥𝑖,𝑗 𝑡 + 1 = 𝑥𝑖,𝑗 𝑡 + 𝑣𝑖,𝑗 𝑡 + 1
[image:6.595.89.262.434.753.2](15) The flow chart of the PSO procedure is represented in Figure 8.
Figure 8:Flowchart of proposed method
In order to select the best particle in each iteration, objective function is required based on which a fitness value is calculated for each particle. In classification-based optimization, mainly area under curve (AUC) is used as objective function which is evaluated for the selected features by PSO depending upon the number of classes or categories in the dataset that need to be classified. Sometimes precision or sensitivity measures are also used and optimum best is figured out from the particles. The objective function applied is assumed in form of eq. as below
𝑂𝑏𝑗𝑒𝑐𝑡𝑖𝑣𝑒𝑓𝑢𝑛𝑐𝑡𝑖𝑜𝑛 = 𝑚𝑎𝑥 𝑖 𝑚𝑖𝑧𝑒(𝑚𝑒𝑎𝑛( 𝑁 𝐴𝑈𝐶
𝑖=1 ))
…(16)
Where, N is the Image categories number. Setting parameters
Weight parameter is not kept constant and updates in new iteration by using previous iterations weight [42]:
max min max
max
(
w
w
it)
weight
w
It
(17)
Where, wmax is set as initial value of weighting-coefficient,
wmin is final value of the weighting-coefficient, itmax is
maximum no. of iterations and „it‟ is current iteration. V. FEATURE TRAINING STEP FOR CBIR The final stage of text categorization process involves the training and testing the dataset using the selected feature set given by the feature selection phase using Adaptive particle swarm optimization. Three machine learning classifiers named as DT, SVM, and k-NN are used for classification. As there is need in fitness function evaluation in PSO, decision tree is used to get the area under curve in which the chosen class was marked as true class whereas rest are marked as false. A Similar procedure is adopted for rest of the classes, after which AUC average is used as the objective function and the highest value is selected for the local best.
A. Support vector machine (SVM)
It is a machine learning method based on the learning theory, (Vapnik-Chervonenkis dimension theory) and the principle of structural-risk minimization. It can effectively deal with the regression (time series analysis), pattern recognition (classification problem, discriminant analysis) and many other problems. SVM is popular in the field of prediction and comprehensive evaluation. It works well to solve the small sampling problems, non-linear problems, and the high-dimensional pattern recognition problems. It also has many unique advantages, overcoming by the “curse of dimensionality”, “over-learning” and other problems.
B. K-nearest neighbor (KNN)
In general, this procedure is applied for two reaso
ns: to approximate the distribution density of the training data set used and to categorize the tested data set depending upon the training of the dataset [43].
C. Decision tree (DT)
The decision tree (Quinlan 1986) [44] is one of the best known machine learning systems and its main objective is to estimate the objective tasks with discrete values. This tree is called a decision tree, since it represents the decision-making method for regulate an input sample group. The decision tree could be a good selection method for opinion mining. It has a very decent performance in contradiction with high-volume data.
VI. RESULTS AND DISCUSSION
[image:7.595.304.541.49.158.2]Proposed method has been evaluated using a general-purpose WANG data-set which contains 1000 Corel-images having ten different categories of subjects. It is available in size 384 × 256 or 256 × 384 in JPEG format. In this dataset, Table 2, 100 images in each of 10 different categories like Africa, Beaches Buses, Horses, Buildings, Dinosaurs, Flowers, Elephants, Food and Mountains are used. Mostly this data-set is used for testing many CBIR systems. It is used commonly because of the good size and the availability of class information used in the data-set.
Table 2: Table showing percentage of samples classified accurately to class
Class Number of images
Africa 100
Beaches 100
Building 100
Bus 100
Dinosaur 100
Elephants 100
Flowers 100
Food 100
Horses 100
Mountains 100
The classification of view could be assessed utilizing four indexes considered on the base of the subsequent calculations: precision, accuracy, f-measure and recall [45]. Many documents noticed and the most of the categories provides the effectiveness of the presented method based on sensitivity of particular class and specificity of rest of the documents. Hence Detection Accuracy (DA) or recall value which defines sensitivity parameter can effectively represent the accuracy of text classifier. Along with recall, precision, F-measure and Accuracy parameters are also used. The formulas
𝑃𝑟𝑒𝑐𝑖𝑠𝑖𝑜𝑛 = 𝑇𝑟𝑢𝑒 _𝑃𝑜𝑠𝑖𝑡𝑖𝑣𝑒 + 𝐹𝑎𝑙𝑠𝑒 _𝑝𝑜𝑠𝑖𝑡𝑖𝑣𝑒 𝑇𝑟𝑢𝑒 _𝑃𝑜𝑠𝑖𝑡𝑖𝑣𝑒
(18)
Recall = 𝑇𝑟𝑢𝑒_𝑝𝑜𝑠𝑖𝑡𝑖𝑣𝑒
𝑇𝑟𝑢𝑒_𝑝𝑜𝑠𝑖𝑡𝑖𝑣𝑒 + 𝐹𝑎𝑙𝑠𝑒_𝑛𝑒𝑔𝑎𝑡𝑖𝑣𝑒
(19)
𝐹_𝑀𝑒𝑎𝑠𝑢𝑟𝑒𝑚𝑒𝑛𝑡 = 2 ∗ 𝑃𝑟𝑒𝑐𝑖𝑠𝑖𝑜𝑛 ∗ 𝑅𝑒𝑐𝑎𝑙𝑙 𝑃𝑟𝑒𝑐𝑖𝑠𝑖𝑜𝑛 + 𝑅𝑒𝑐𝑎𝑙𝑙
(20)
𝐴𝑐𝑐𝑢𝑟𝑎𝑐𝑦 =
𝑇𝑟𝑢𝑒 _𝑃𝑜𝑠𝑖𝑡𝑖𝑣𝑒 + 𝑇𝑟𝑢𝑒 _𝑁𝑒𝑔𝑎𝑡𝑖𝑣𝑒
𝑇𝑟𝑢𝑒 _𝑃𝑜𝑠𝑖𝑡𝑖𝑣𝑒 + 𝑇𝑟𝑢𝑒 _ 𝑁𝑒𝑔𝑎𝑡𝑖𝑣𝑒 + 𝐹𝑎𝑙𝑠𝑒 _𝑝𝑜𝑠𝑖𝑡𝑖𝑣𝑒 + 𝑇𝑟𝑢𝑒 _𝑁𝑒𝑔𝑎𝑡𝑖𝑣𝑒 () (
(21)
[image:7.595.309.557.305.613.2]Where true_positive is suitably categorized subjects in a category, False_positive as appropriately classified subjects in a category and false_negative as correctly classified documents of rest categories; Results for CBIR on Corel Dataset are shown in tables and figures below.
A Novel CBIR-Based System using Texture Fused LBP Variants and GLCM Features
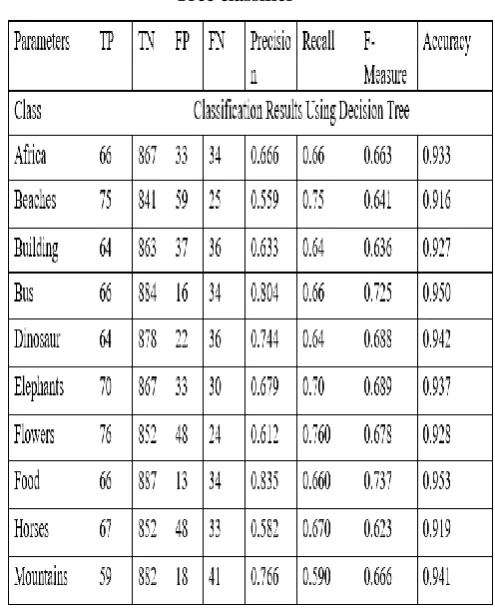
[image:8.595.312.524.56.313.2]Table 4: Performance evaluation of CBIR using k-Nearest Neighbor
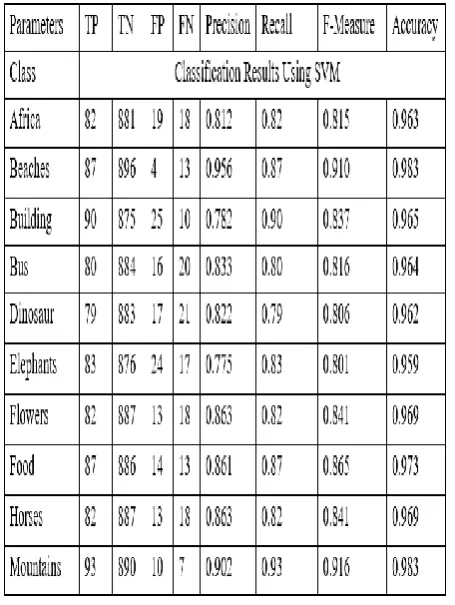
[image:8.595.54.282.426.729.2]Table 5: Performance evaluation of CBIR using Support Vector Machine
Figure 9: Bar graphs for Recall Value for CBIR on Corel Dataset
Proportion of appropriately expected positive observations to all observations in definite class true is identified as recall. SVM gives high recall ratio for all ten categories in coral dataset which falls in approx. 0.8 and 0.93 in which Beaches, Building. Food and mountain category has 0.87, 0.90, .87 and .93 recall value. Table 3, Figure 9, Rest of the categories has approximately .80 recall value when fitness function in PSO is based on SVM classification. Decision tree and kNN classifiers has significantly low value of recall parameter as compared to SVM classifier.
Figure 10: Bar graphs for Precision Value for CBIR on Corel Dataset
[image:8.595.306.518.462.697.2]Precision value falls in b/w 0.7898 and .96 for SVM, 0.40 to 0.81 for kNN and 0.559 to 0.835 for decision tree, Table 4,Figure 10, Overall SVM gives efficient precision value for almost all categories in which Beaches, flowers, horses and mountain has high measured values of precision noted as 0.956, .863, .863 and 0.902 respectively.
Figure 11: Bar graphs for F-Measure Value for CBIR on Corel Dataset
Weighted average of precision and recall is called f-score. It is additional significant limit than accuracy once having an uneven class distribution in data. SVM classifier has high value of F-score for all tested categories in 0.801 and 0.906. Bus, Dinosaur and Elephants category have F-score value close to 0.80 whereas beaches and mountain classes shows 0.916 F-score value. Table 5, Figure 11.Decision tree shows moderate results for F-score which falls from 0.623 and 0.737 whereas kNN shows poor classification results when F-score parameter is considered.
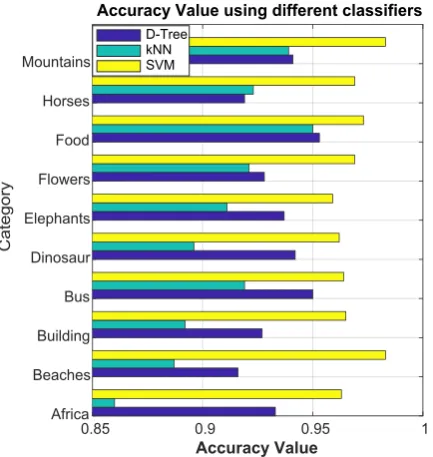
Figure 12: Bar graphs for Accuracy value for CBIR on Corel Dataset
This is the proportion of true negative plus true positives to the true negatives plus true positives plus false negative plus false positive. It computes how much measurement of cases is appropriately classified. SVM gives highest accuracy among all three tested classifiers which is 0.963, 0.983, 0.965, 0.964, 0.962, 0.959, 0.969, 0.973, 0.969 and 0.983 respectively for the images from the data-set are Africa, Beaches, Buildings, Buses, Dinosaurs, Elephants, Flowers, Food, Horses and Mountains category. Figure 12,It has been found that SVM gives best performance among all three classifiers when fitness function in PSO based feature reduction is chosen in maximizing average of AUC for all categories using the SVM classification method.
VII. CONCLUSION
In this work, multi-feature extraction has been carried out from which most differentiating features are extracted using PSO optimizer. Classification results are carried out on Corel dataset which consists of ten categories and are shown using four presentation parameters i.e. precision, accuracy, f-score and recall in which three classification methods Support vector machine, Decision Tree and k-nearest neighbor are used for classification. Proposed method constitutes four steps i) Decomposition in which multi scale decomposition is carried out using discrete wavelet transform for R, G and B channels separately ii) feature extraction in which DRLBP texture image is generated and GLCM is obtained along with MLBP texture features of detailed and approximation coefficients. Concatenation is carried out from this feature set for all three R, and B channels iii) feature reduction in which PSO algorithm is used to extract the most differentiating features iv) classification in which three classifiers are used for evaluating the category of tested images. PSO uses SVM classifier in evaluating its objective function which is maximizing the average AUC for the selected features. PSO tries to increase AUC value for all the categories and provides feature vector with large AUC value when classify by SVM. Experimental results show that SVM is the best which shows high values of recall, F-score and accuracy parameter.
CONFLICT OF INTEREST
The authors declare that they have no conflict of interest.
REFERENCES
1. Hsu W, Rodney Long L, Antani SK (2007) SPIRS: A framework for content-based image retrieval from large biomedical databases. (MEDINFO)- Proceedings of the 12th World Congress on Health (Medical) Informatics - Building Sustainable Health Systems, pp 188– 192
2. Deserno TM, Guld MO, Plodowski B, Spitzer K,Wein BB, Schubert H, Ney H, Seidl T (2008) Extended query refinement for medical image retrieval. Journal Digital Imaging pp 280–289
3. Schettini R, Ciocca G, Gagliardi I (2009) Feature extraction for content-based image retrieval. Encyclopedia of Database Systems, pp 1115–1119
4. Yue J, Li Z, Lu L, Fu Z (2011) Content-based image retrieval using color and texture fused features. Mathematical and Computer Modelling, pp 1121–1127
[image:9.595.53.270.515.744.2]A Novel CBIR-Based System using Texture Fused LBP Variants and GLCM Features
6. Mandal S, Sudarshan VP, Nagaraj Y, Dean-Ben XL, Razansky D (2015) Multiscale edge detection and parametric shape modeling for boundary delineation in optoacoustic images. 37th Annual International Conference of the IEEE Engineering in Medicine and Biology Society, pp 707–710
7. Zhang D, Lu G (2001) Content-Based Shape Retrieval Using Different Shape Descriptors: A Comparative Study. Proceedings of the IEEE International Conference on Multimedia and Expo
8. Anh ND, Bao PT, Nam BN, Hoang NH (2010) A New CBIR System Using SIFT Combined with Neural Network and Graph-Based Segmentation. Intelligent Information and Database Systems, Second International Conference, ACIIDS, pp 294–301
9. T. Dharani, I.L. Aroquiaraj, A survey on content-based image retrieval, in: Pat- tern Recognition, Informatics and Mobile Engineering (PRIME), 2013 International Conference on, 2013, pp. 4 85–4 90 10. W. Huang, Y. Gao, K. Chan, A review of region-based image retrieval,
J. Signal Process. Syst. 59 (2) (2010) 143–161
11. D. Lowe, Distinctive image features from scale-invariant keypoints, Int. J. Com- put. Vis. 60 (2) (2004) 91–110
12. H. Bay, A. Ess, T. Tuytelaars, L.V. Gool, Speeded-up robust features (SURF), Computer Vision Image Understanding 110 (3) (2008) 346– 359
13. N. Dalal, B. Triggs, Histograms of oriented gradients for human detection, in: Computer Vision and Pattern Recognition, 2005. CVPR 2005. IEEE Computer Society Conference on, volume 1, 2005, pp. 886–893
14. [14] T. Ojala, M. Pietikainen, D. Harwood, Performance evaluation of texture mea- sures with classification based on kullback discrimination of distributions, in: Pattern Recognition, 1994. Vol. 1 - Conference A: Computer Vision amp; Im- age Processing., Proceedings of the 12th IAPR International Conference on, vol- ume 1, 1994, pp. 582–585, doi: 10.1109/ICPR.1994.576366 .
15. X. Tan, B. Triggs, Enhanced local texture feature sets for face recognition under difficult lighting conditions, Image Process., IEEE Trans. 19 (6) (2010) 1635–1650
16. H. Chang, D.-Y. Yeung, Locally linear metric adaptation with application to semi-supervised clustering and image retrieval, Pattern Recognit. 39 (7) (2006) 1253–1264.
17. D. Zhang, M.M. Islam, G. Lu, A review on automatic image annotation tech- niques, Pattern Recognit. 45 (1) (2012) 346–362.
18. Y. Gao, K.L. Chan, W.-Y. Yau, Learning in content based image retrieval - a brief review, in: Information, Communications Signal Processing, 2007 6th Interna- tional Conference on, 2007, pp. 1–5 19. S.R. Bul ș, M. Rabbi, M. Pelillo, Content-based image retrieval with
relevance feedback using random walks, Pattern Recognit. 44 (9) (2011) 2109–2122. http://dx.doi.org/10.1016/j.patcog.2011.03.016 . ComputerAnalysis ofImagesandPat- terns.
20. M.K. Kundu, M. Chowdhury, S.R. Bul ș, A graph-based relevance feedback mech- anism in content-based image retrieval, Knowl. Based
Syst. 73 (2015) 254–264.
http://dx.doi.org/10.1016/j.knosys.2014.10.009 .
21. S. Liao , M.W. Law , A.C. Chung , Dominant local binary patterns for texture clas- sification, IEEE Trans. Image Process. 18 (5) (2009) 1107–1118 .
22. Z. Guo , L. Zhang , D. Zhang , Rotation invariant texture classification using LBP variance (LBPV) with global matching, Pattern Recognit. 43 (3) (2010a) 706–719
23. Z. Guo , L. Zhang , D. Zhang , A completed modeling of local binary pattern operator for texture classification, IEEE Trans. Image Process. 19 (6) (2010b) 1657–1663 .
24. S.-Z. Su , S.-Y. Chen , S.-Z. Li , S.-A. Li , D.-J. Duh , Structured local binary haar pattern for pixel-based graphics retrieval, IET Electron. Lett. 46 (14) (2010) 996–998
25. T. Ahonen , M. Pietikinen , Soft histograms for local binary patterns, in: Pro- ceedings of the Finnish signal processing symposium, (FINSIG 2007), 5, 2007, pp. 1–4 .
26. D.K. Iakovidis , E.G. Keramidas , D. Maroulis , Fuzzy Local Binary Patterns for Ul- trasound Texture Characterization, in: International Conference Image Analysis and Recognition, 2008, pp. 750–759 . Berlin
27. N. Dalal , B. Triggs , Histograms of oriented gradients for human detection, 2005 IEEE Comput. Soc. Conf. Comput. Vision Pattern Recognit. 1 (2005) 886–893 .
28. V. Chandrasekhar , G. Takacs , D. Chen , S. Tsai , R. Grzeszczuk , B. Girod , CHog: Compressed histogram of gradients a low bit-rate feature descriptor, in: IEEE Conference on Computer Vision and Pattern Recognition, 2009, pp. 2504–2511 .
29. V. Chandrasekhar , Y. Reznik , G. Takacs , D. Chen , S. Tsai , R. Grzeszczuk , B. Girod , Quantization Schemes for Low Bitrate Compressed Histogram of Gradients De- scriptors, in: 2010 IEEE
Computer Society Conference on Computer Vision and Pattern Recognition-Workshops, 2010, pp. 33–40 .
30. X. Wang , T.X. Han , S. Yan , An HOG-LBP Human Detector with Partial Occlusion Handling, in: 2009 IEEE 12th International Conference on Computer Vi- sion, 2009, pp. 32–39 .
31. X. Tan , B. Triggs , Enhanced local texture feature sets for face recognition under difficult lighting conditions, IEEE Trans. Image Process. 19 (6) (2010) 1635–1650 .
32. B. Zhang , Y. Gao , S. Zhao , J. Liu , Local derivative pattern versus local binary pattern: face recognition with high-order local pattern descriptor, IEEE Trans. Image Process. 19 (2) (2010) 533–544 . 33. Z. Guo , Q. Li , J. You , D. Zhang , W. Liu , Local directional
derivative pattern for rotation invariant texture classification, Neural Comput. Appl. 21 (8) (2012) 1893–1904 .
34. A. Oberoi , V. Bakshi , R. Sharma , M. Singh , A framework for medical image re- trieval using local tetra patterns, Int. J. Eng. Technol. 5 (1) (2013) 27–36 .
35. K.-C. Fan , T.-Y. Hung , A novel local pattern descriptor-local vector pattern in high-order derivative space for face recognition, IEEE Trans. Image Process. 23 (7) (2014) 2877–2891 .
36. Prashant Srivastava, Ashish Khare, “Integration of wavelet transform, Local Binary Patterns and moments for content-based image retrieval” Journal of Visual Communication and Image Representation, Volume 42, 2017, Pages 78-103
37. Rakesh Mehta, Karen Egiazarian,"Dominant Rotated Local Binary Patterns (DRLBP) for texture classification"Pattern Recognition Letters,Volume 71,2016,Pages 16-22
38. L. Liu, L. Zhao, Y. Long, G. Kuang, and P. Fieguth, “Extended local binary patterns for texture classification,” Image and Vision Computing, vol. 30, pp. 86–99, 2012.
39. L. Liu, S. Lao, P. W. Fieguth, Y. Guo, X. Wang and M. Pietikäinen, "Median Robust Extended Local Binary Pattern for Texture Classification," in IEEE Transactions on Image Processing, vol. 25, no. 3, pp. 1368-1381, March 2016.
40. Manisha Verma, Balasubramanian Raman,"Center symmetric local binary co-occurrence pattern for texture, face and bio-medical image retrieval" Journal of Visual Communication and Image Representation,Volume 32,2015,Pages 224-236
41. J. Kennedy, R.C. Eberhart, Swarm Intelligence, Academic Press, San Diego, CA, 2001.
42. Francisco Erivaldo Fernandes Junior, Gary G. Yen,"Particle swarm optimization of deep neural networks architectures for image classification"Swarm and Evolutionary Computation,Volume 49,2019,Pages 62-74
43. Alfaro C, Cano-Montero J, Gómez J, Moguerza JM, Ortega F (2016) A multi-stage method for content classification and opinion mining on weblog comments. Ann Oper Res 236(1):197–213
44. Quinlan JR (1986) Induction of decision trees. Mach Learn 1(1):81– 106
45. Zhang, H., Gan, W., Jiang, B.: Machine learning and lexicon based methods for sentiment classification: a survey. In: Proceedings of IEEE Conference on Web Information System and Application (WISA), pp. 262–265 (2014)
AUTHORS PROFILE
Meenakshi Garg, received her M.Tech. from MDU, Rohtak. She is expert in image processing and optimization fields. She has published research papers in various reputed journals. Currently, she is working as an Assistant Professor in Govt. Bikram College of Commerce, Patiala.
![Figure 2: Effect of rotation on the LBP and the RLBP operator [37].](https://thumb-us.123doks.com/thumbv2/123dok_us/8153572.247861/3.595.51.280.460.710/figure-effect-rotation-lbp-rlbp-operator.webp)
![Figure 4: Evaluation procedure of multi-scale MRELBP descriptor and concatenated feature-set [38]](https://thumb-us.123doks.com/thumbv2/123dok_us/8153572.247861/4.595.49.294.55.242/figure-evaluation-procedure-multi-mrelbp-descriptor-concatenated-feature.webp)
![Figure 6: Different combinations obtained using different distance and directional characteristics [40]](https://thumb-us.123doks.com/thumbv2/123dok_us/8153572.247861/5.595.57.269.96.258/figure-different-combinations-obtained-different-distance-directional-characteristics.webp)