RESEARCH NOTE
Development and validation of a reliable
LC–MS/MS method for quantitative analysis
of usnic acid in
Cladonia uncialis
Natalia Sveshnikova
1, Tao Yuan
2, Jamie M. Warren
2and Michele D. Piercey‑Normore
1*Abstract
Objective: The purpose of this study was to develop and validate a specific and sensitive liquid chromatography tandem mass‑spectrometry method for quantification of usnic acid concentration in the lichen, Cladonia uncialis, suit‑ able for detection of relatively small fluctuations of usnic acid concentration in response to environmental changes. Results: The resulting method was fully validated according to international guidelines and demonstrated good selectivity and sensitivity with minor levels of a matrix effect and high accuracy.
Keywords: Liquid chromatography tandem mass‑spectrometry, LC–MS/MS, Secondary metabolites, Lichen, Usnic acid, Cladonia uncialis
© The Author(s) 2019. This article is distributed under the terms of the Creative Commons Attribution 4.0 International License (http://creativecommons.org/licenses/by/4.0/), which permits unrestricted use, distribution, and reproduction in any medium, provided you give appropriate credit to the original author(s) and the source, provide a link to the Creative Commons license, and indicate if changes were made. The Creative Commons Public Domain Dedication waiver (http://creativecommons.org/ publicdomain/zero/1.0/) applies to the data made available in this article, unless otherwise stated.
Introduction
Usnic acid (UA) is one of the most common and most studied lichen-specific secondary metabolites and is taxonomically widely distributed in species of Clado-nia, Usnea, Lecanora, Ramalina, Evernia, members of the Parmeliaceae, and other lichen genera [1]. Isolated in 1844 [2] and studied ever since, it is still of interest in industry for its antibacterial, antiviral, antioxidant, anti-inflammatory, analgesic and even anticancer properties [1, 3–5]. The biological role of UA in lichens is consid-ered to be species-specific [6], and may include UV pro-tection for the photobiont [7], from herbivores [8, 9], and from fungal and bacterial pathogens [10, 11].
Under natural conditions, the accumulation of UA in lichens is thought to depend on environmental fac-tors [7, 12–14] with seasonal variation [15, 16]. Methods of extraction and quantification of UA were reported depending on available equipment, research goals and required accuracy of the method, making it difficult to compare across studies. One of the most reliable mod-ern analytical methods is Liquid Chromatography
Tandem-Mass Spectrometry (LC–MS/MS), having advan-tages of both accurate identification and quantification of the substance in question. The use of LC-UV with MS in recent publications [17, 18] was not sensitive enough for detection of subtle variation in UA, was not validated, and were conducted on species with matrix interferences. The development of a standard method to detect UA may help to elucidate its ecological role. The goal of this study was to establish a method for reliable monitoring of subtle changes in concentration of UA, specifically for Cladonia uncialis (L.) F.H. Wigg. [19–21], from the natural lichen thallus and validation according to Bioanalytical Method Validation (US and EU [22–25]).
Main text
Materials and methods
Chemicals
All reagents used were of analytical or higher grade and purchased from Sigma Aldrich (Merck KGaA) unless otherwise stated. Usnic acid (UA) standard stock solution was prepared by solubilising 1 mg of UA in 1 mL of 100% acetonitrile.
Sample preparation
50 mg of the top 10 mm of dry Cladonia uncialis thal-lus was crushed with mortar and pestle, soaked in 10 mL
Open Access
*Correspondence: mpiercey‑[email protected]
of 100% acetonitrile, vortexed for 30 s and agitated at 150 rpm on the shaker (LSE Orbital Shaker, Corning™ LSE™) for 20 min at room temperature. This extraction was repeated four times with the same material to obtain residual UA. All extracts were pooled into one glass tube, and the combined volume was adjusted to 50 mL with 100% acetonitrile.
For the control, an extract from Cladonia ochrochlora
(a non-UA-producing species) was prepared in the same manner to emulate the matrix effect.
LC–MS/MS procedure
LTQ XL™ Linear Ion Trap Mass Spectrometer (Thermo Scientific™) was used to conduct mass spectroscopy. Fil-tered (Whatman® Mini-UniPrep® G2, PTFE membrane, pore size 0.2 μm) samples were injected in a volume of 10 μL into a C8 LC column (Phenomenex, Luna® 3 µm C8(2) 100 Å, LC Column 100 × 2 mm) and separated by UltiMate™ 3000 RSLCnano System. Chromatographic separation was performed at a flow rate of 0.2 mL/min using a gradient elution program, starting from 80% of eluent A (water with 0.1% formic acid, v/v) and gradually changing to 5% A and back over 40 min. Exact gradient parameters: 80% of eluent A/20% B (100% acetonitrile acidified with 0.1% formic acid (v/v)) for 5 min, gradual changing to 5% A/95% B over 23 min, 5% A/95% B for 5 min, return to 80% of eluent A/20% B over 7 min.
Mass spectrometry measurements were performed on an LTQ OrbiTrap XL MS (Thermo Fisher). Samples were introduced to MS via electrospray ionisation using the following conditions: sheath gas flow rate, 30 (arbitrary units); auxiliary gas, 5 (arbitrary units); ESI voltage, 4.0 (kV); capillary voltage, − 35 (V); capillary temperature, 275 (°C); and tube lens voltage, − 110 (V). The collected spectra were scanned over the mass/charge number (m/z) range of 155–2000 atomic mass units (Xcalibur version 4.0). MS spectra were generated by collision-induced dissociation of the metabolite ions at normalized collision energy of 35%.
Method validation
The LC–MS/MS method was validated with respect to the specificity, linearity and sensitivity, precision and accuracy, matrix effects and recovery.
Specificity
The Specificity test was conducted by comparing chro-matograms of 6 matrix blanks (C. ochrochlora extracts without UA) with a blank spike (UA in 100% acetonitrile) and a matrix spike (C. ochrochlora extracts spiked with UA).
Linearity and sensitivity
Two types of calibration standards were used for assess-ment of linearity and sensitivity of the method: different concentrations of UA in a solvent (acetonitrile) only as blank standards, and the same concentrations of UA in a matrix solution (C. ochrochlora extracts) as matrix stand-ards. The final calibration curves included three repli-cates per calibration point, and linearity was assessed by linear regression.
The calibration range was narrowed down from a broader initial diapason (chosen based on existing lit-erature) by visual observations of 10 analytical runs. The Limit of Detection (LOD) and Limit of Quantification (LOQ) were calculated using the formulas recommended by the guidelines mentioned above:
where SD is the standard deviation of the signal at the lowest point of the calibration curve.
Accuracy and precision
The intra- and inter-day accuracy and precision measure-ments were conducted using measuremeasure-ments of three con-centrations of UA (within the calibration range) dissolved in a matrix (extract) on a single assay, repeated (with trip-licates) three times within 1 week.
Matrix effect
The Matrix effect was determined by comparison of the retention time (Rt) and the level of MS signal of the rep-resentative blank matrix spiked with a predetermined amount of UA with those obtained for the corresponding amount of UA in the solvent (100% acetonitrile).
To assure the matrix match between C. uncialis and C. ochrochlora, a similar comparison was made using both matrix samples spiked with the same amount of UA. Samples used for measurements contained 20 µL of final extract per mL of acetonitrile.
Recovery
The recovery was determined by comparing MS response level of spiked samples pre- and post-extraction, accord-ing to SANCO guide, usaccord-ing the average result of 4 repli-cates. The recovery percentage was calculated by dividing the value for the MS response of spiked pre-extracted sample by that of post extracted sample.
Results and discussion
Negative electrospray ionization mass spectrometry has been used for analysis of UA for some time [26,
LOD=3.3 ∗ SD
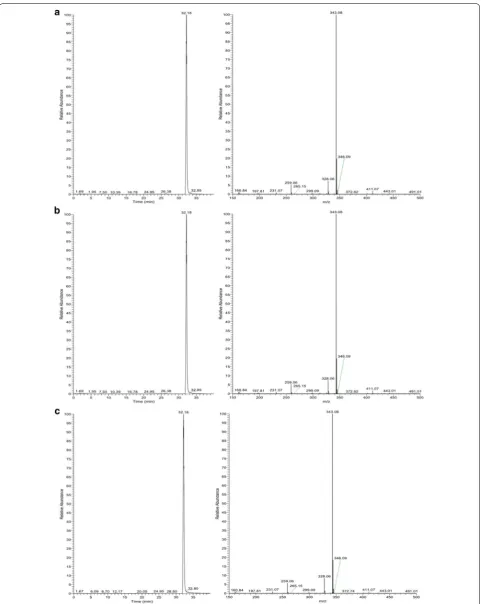
27], resulting in an established fragmentation pattern with major ion m/z 343.08 and minor daughter ions at m/z 328.06 and m/z 259.08 (Spectrum BML00262 in MassBank of North America, SPLASH: splash10-0006-0009000000-eba42546783e6d051377). The same pattern was observed in our experiments (Fig. 1).
Optimisation of the LC–MS/MS protocol was directed toward obtaining distinctive symmetrical peaks com-bined with good resolution. The C8(2) LC column with 3 µm particle size run at a speed of no more than 0.25 mL/min with acetonitrile buffered with 0.1% of for-mic acid as a mobile phase demonstrated the best results for LC separation and provided the most favorable condi-tions for MS/MS measurements.
Matrix effect
Since some degree of matrix-induced ionisation suppression was previously reported [17], the modified matrix-matched calibration approach, proposed by the SANCO guide, was chosen as the most reliable for quantification analysis.
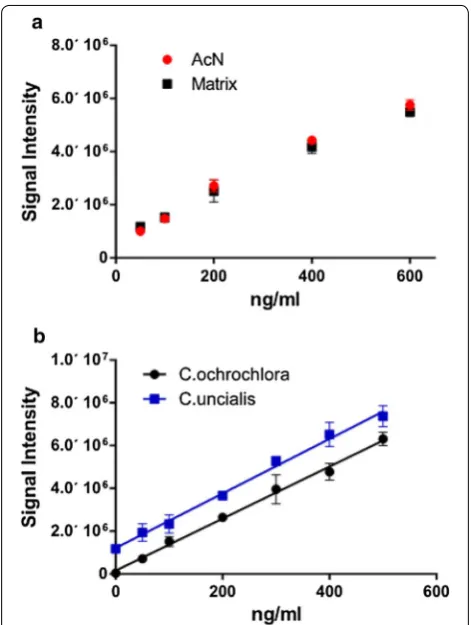
Since a non-UA-containing extract from C. uncia-lis cannot be obtained, another species was chosen as a matching matrix source—Cladonia ochrochlora, a lichen of the same genus and habitat, and known to contain no UA [28, 29]. (No difference was observed in peak qual-ity or size between blanks) (UA standard added to pure acetonitrile) and matrix (UA standard in acetonitrile with addition of the extract of C. ochrochlora) (Figs. 1 and 2a). The un-spiked extract of C. uncialis did not demonstrate any deviations in peak shape from that of the standard. To test if signal strength was affected in samples of C. uncialis, both matrices (extracts of C. ochrochlora and C. uncialis) were compared using standard addition calibra-tion curves created by spiking those extracts with known concentration of UA (Fig. 2b), and using four replicas for each concentration value.
Although not identical due to presence of UA in the C. uncialis samples (translated into Y-intercept shift), the calibration curves demonstrated no significant difference in slopes.
This supported the use of C. ochrochlora extract as a matching matrix for future experiments. The insignifi-cance of the matrix effect on quality of the signal in our experiments in contrast to the matrix effect observed in other laboratories [17] could be explained by differences in either extract composition of analysed species, meth-ods specifications, equipment used in experiments, sam-ple preparation, or a combination of factors.
Specificity, linearity and sensitivity
A comparison of blanks (acetonitrile, matrix C. ochro-chlora extracts without UA) with samples and spiked
blanks (UA added to acetonitrile or matrix solution) demonstrated a high specificity of the method. Nei-ther pure acetonitrile, nor pure matrix chromatograms showed any peaks with the UA fragmentation pattern, while peaks with the UA specific MS fragmentation were observed in samples and spiked blanks at very low (< 2 ng/mL) concentrations.
While UA indeed could be detected at very low concen-trations (< 2 ng/mL), the linearity range was more restric-tive: after a series of adjustments the reliable measuring interval fell between 50 and 500 ng/mL. The Limit of Detec-tion (LoD) and Limit of QuantificaDetec-tion (LoQ) were calcu-lated using the calibration curve obtained for C. ochrochlora
extract and was 2.2 ng/mL (LoD) and 32.3 ng/mL (LoQ). The concentration of the UA sample extracted, using the described procedure with 50 mL final volume of the extract, is expected to be recovered within the quanti-tative linear range since concentrations of UA in Cla-donia species under natural conditions vary between 0.4 and 3.8 in dry weight percentages, corresponding to 80–760 ng/mL in our experimental conditions [17, 30– 32]. In the case of the UA concentration exceeding the suggested limits, an appropriate dilution was used.
Recovery
Recovery, a characteristic of extraction efficiency, was measured by comparison of UA-spiked samples where the known concentration of UA (2.5 µg to the final 50 mL volume) was added after or before the extraction and was 94%, consistent with that of Roach et al. [17]. Since three independent measurements produced similar results, and considering previous reports about a small fraction of UA ineradicable from the cell wall matrix [7, 33], the extraction efficiency was stable and high enough (about 94%) for further experiments.
Accuracy and precision
Precision was expressed as Coefficient of Variation (CV) and accuracy was expressed as Relative Error (RE), and were evaluated for three concentrations of UA within the linearity range: 50 ng/mL, 200 ng/mL and 500 ng/mL. The resulting fluctuations did not exceed 7% for Intra-assays and 11% for Inter-Intra-assays for CV, and 7% for RE cal-culations in both type of measurements (Table 1).
Stability
The matrix solution (extract of C. ochrochlora) spiked with UA at the concentration of 400 ng/mL, was kept at room temperature in darkness for 1 month and assessed five times during that period. Inter-assay RE was 2.31%, which is an acceptable level of deviation, demonstrating stability of UA under experimental conditions in this study.
Conclusion
The method suggested in the present article proves to be suitable for accurate measurements of UA concentra-tion in dried field samples of Cladonia uncialis under the conditions in this study: sample preparation and stor-age, maintaining concentration of UA in the extracts between 50 and 500 ng/mL, and regular adjustments of calibration.
Limitations
The method presented in this paper was performed in a single laboratory and the validation was performed on a single species.
Acknowledgements
The authors thank the BERI lab (Grenfell campus, Memorial University of NL) for use of the equipment. Funding was provided by Natural Sciences and Engineering Research Council of Canada Discovery and Accelerator Grants to MPN.
Authors’ contributions
All authors have made substantial contributions to the study. NS and MPN developed the idea for the experiment; NS, TY and JW designed and con‑ ducted the experiment; NS, TY, JW and MPN interpreted the data; NS and MPN drafted the manuscript; TY and JW reviewed the manuscript drafts. All authors read and approved the final manuscript.
Funding
Funding sources were NSERC DG and DAS to MPN. The funding was used to provide post‑doctoral salary, purchase chemicals and supplies for the experi‑ ment, and as service fees to run the experiment.
Availability of data and materials
All data generated or analysed during this study are included in this published article or can be obtained upon request to NS.
Ethics approval and consent to participate
Not applicable.
Consent for publication
The manuscript includes no individual person ́s data requiring consent for publication.
Competing interests
The authors declare they have no competing interests.
Author details
1 School of Science and the Environment, Grenfell Campus, Memorial Uni‑ versity of NL, 20 University Drive, Corner Brook, NL A2H 5G4, USA. 2 School of Science and the Environment, Boreal Ecosystem Research Facility, Grenfell Campus, Memorial University, 20 University Dr, Corner Brook, NL A2H 5G4, USA.
Received: 7 June 2019 Accepted: 21 August 2019
References
1. Ingolfsdottir K. Molecules of interest: usnic acid. Phytochemistry. 2002;61:729–36.
2. Knop W. Chemisch‑physiologische Untersuchung uber die Flechten. Justus Lieb Ann Chern. 1844;49:103–24.
Fig. 2 a Standard additions data recorded for acetonitrile (AcN) or extract of C. ochrochlora (Matrix). MS/MS response at m/z 343.08 was tested in three‑five replicates at every indicated concentration (error bars indicate SD for every measuring point). b Calibration curves made for extracts of C. ochlochlora (Y = 12,164 * X + 1.54e + 005 (with R2 = 0.9428)) and C. uncialis (Y = 12,761 * X + 1.21e + 006 (with R2 = 0.9197)) spiked with UA standards. Error bars indicate SD, calculated for every measuring point
Table 1 Intra- and inter-assays accuracy and precision
Assay type UA, ng/mL CV, % RE, %
[image:5.595.56.292.86.399.2] [image:5.595.57.290.523.618.2]•fast, convenient online submission •
thorough peer review by experienced researchers in your field • rapid publication on acceptance
• support for research data, including large and complex data types •
gold Open Access which fosters wider collaboration and increased citations maximum visibility for your research: over 100M website views per year •
At BMC, research is always in progress.
Learn more biomedcentral.com/submissions
Ready to submit your research? Choose BMC and benefit from:
3. Fournet A, Ferreira ME, Rojas de Arias A, et al. Activity of compounds iso‑ lated from Chilean lichens against experimental cutaneous leishmaniasis. Comp Biochem Physiol. 1997;111:69–74.
4. Scirpa P, Scambia G, Masciullo V, et al. A zinc sulphate and usnic acid preparation used as post‑surgical adjuvant therapy in genital lesion by human papillomavirus. Minerva Ginekol. 1999;51:255–60.
5. Mayer M, O’Neill MA, Murray KE, Santos‑Magalhães NS, Carneiro‑Leão AM, Thompson AM, Appleyard VC. Usnic acid: a non‑genotoxic compound with anti‑cancer properties. Anticancer Drugs. 2005;16(8):805–9. 6. Cocchietto M, Skert N, Nimis PL. A review on usnic acid, an interesting
natural compound. Naturwissenschaften. 2002;89:137–46.
7. McEvoy M, Nybakken L, Solhaug KA, Gauslaa Y. UV triggers the synthesis of the widely distributed secondary lichen compound usnic acid. Mycol Prog. 2006;5:221–9.
8. Pöykkö H, Hyvärinen M, Backor M. Removal of lichen secondary metabo‑ lites affects food choice and survival of lichenivorous moth larvae. Ecol‑ ogy. 2005;86:2623–32.
9. Gauslaa Y. Lichen palatability depends on investments in herbivore defence. Oecologia. 2005;143:94–105.
10. Cardarelli M, Serino G, Campanella L, Ercole P, De Nardone Cicco F, Ale‑ siani O, Rossiello F. Antimitotic effects of usnic acid on different biological systems. Cell Mol Life Sci. 1997;53:667–72.
11. Lauterwein M, Oethinger M, Belsner K, Peters T, Marre R. In vitro activities of the lichen secondary metabolites vulpinic acid,(+)‑usnic acid, and (−)‑ usnic acid against aerobic and anaerobic microorganisms. Antimicrob Agents Chemother. 1995;39:2541–3.
12. Ravinskaya AP. The effect of ecological factors on usnic acid and atranorin contents in the lichens. In: Golubkova NS, editor. The problems of experi‑ mental lichenology in the USSR. Leningrad: Komarov Botanical Institute, USSR Academy of Sciences; 1991. p. 93–8.
13. Culberson CF, Armaleo D. Induction of a complete secondary‑product pathway in a cultured lichen fungus. Exp Mycol. 1992;16:53–63. 14. Timsina BA, Sorensen JL, Weihrauch D. Effect of aposymbiotic conditions
on colony growth and secondary metabolite production in the lichen‑ forming fungus Ramalina dilacerata. Fungal Biol. 2013;117(11–12):731–43. 15. Quilhot W, Peña W, Flores E, Hidalgo ME, Fernández E, Leighton G. Tem‑
poral variation in usnic acid concentration in Usnea aurantiaco‑atra (Jaq.) Bory. Chile: Serie Científica, Instituto Antarctico Chileno; 1991. p. 99–106. 16. Bjerke Jarle W, Elvebakk A, Dominguez E, Dahlback A. Seasonal trends in usnic acid concentrations of Arctic, alpine and Patagonian populations of the lichen Flavocetraria nivalis. Phytochemistry. 2005;66:337–44. 17. Roach JAG, Musser SM, Morehouse K, Woo JYJ. Determination of usnic
acid in lichen toxic to elk by liquid chromatography with ultravio‑ let and tandem mass spectrometric detection. J Agric Food Chem. 2006;54:2484–90.
18. Smeds AI, Kytöviita M‑M. Determination of usnic and perlatolic acids and identification of olivetoric acids in Northern reindeer lichen (Cladonia stellaris) extracts. Lichenologist. 2010;42:739–49.
19. Abdel‑Hameed M, Bertrand RL, Piercey‑Normore MD, Sorensen JL. Identi‑ fication of 6‑hydroxymellein synthase and accessory genes in the lichen Cladonia uncialis. J Nat Prod. 2016;79:1645–50.
20. Liao C, Piercey‑Normore MD, Sorensen JL, Gough K. In situ imaging of usnic acid in selected Cladonia spp. by vibrational spectroscopy. Analyst. 2010;135:3242–8.
21. Kowalski M, Hausner G, Piercey‑Normore MD. Bioactivity of second‑ ary metabolites and thallus extracts from lichen fungi. Mycoscience. 2011;52:413–8.
22. Thompson M, Ellison SL, Wood R. Harmonized guidelines for single‑lab‑ oratory validation of methods of analysis (IUPAC Technical Report). Pure Appl Chem. 2002;74(5):835–55.
23. ICH Harmonised Tripartite Guideline, validation of analytical procedures. Text and methodology Q2(R1). In: International conference on harmoni‑ sation of technical requirements for registration of pharmaceuticals for human use. 2005.
24. SANCO/12571/2013. Guidance document on analytical quality control and validation procedures for pesticide residues analysis in food and feed. 2013.
25. Sargent M. Guide to achieving reliable quantitative LC–MS measure‑ ments. RSC analytical methods committee. 1st ed. 2013.
26. Lechter RM. Chemistry of lichen constituents—VI: mass spectra of usnic acid, lichexanthone and their derivatives. Org Mass Spectrom. 1968;1:551–62.
27. Kutney JP, Sanchez IH, Yee TH. Mass spectral fragmentation studies in usnic acid and related compounds. Org Mass Spectrom. 1974;8:129–46. 28. Martin W. Chemical aids to species recognition in the lichen genus
Clado-nia. Tuatara. 1971;19(1):6–11.
29. Wang XY, Joshi Y, Hur J‑S. The genus Cladonia (lichenized Ascomycota, Cladoniaceae) in South Korea. Mycotaxon. 2011;117:405–22. 30. Huovinen K. Variation in lichen acids in Cladonia stellaris and
Clado-nia rangiferina in Finland and North Norway. Acta Pharnaca Fennica. 1985;94:113–23.
31. Proska B, Sturdikova M, Pronayova N, Liptaj T. (+)‑Usnic acid and its deriv‑ atives. Their inhibition of fungal growth and enzyme activity. Pharmazie. 1996;51:195–6.
32. Cansaran Duman D, Aras S, Atakol O. Determination of usnic acid content in some lichen species found in Anatolia. J Appl Biol Sci. 2008;2(3):41–4. 33. Solhaug KA, Gauslaa Y. Acetone rinsing—a method for testing ecological
and physiological roles of secondary compounds in living lichens. Sym‑ biosis. 2001;30:301–15.
Publisher’s Note