International Journal of Innovative Technology and Exploring Engineering (IJITEE) ISSN: 2278-3075, Volume-8 Issue-10, August 2019
Abstract: Additive manufacturing is finding increasing
applications in industries ranging from electronics to aerospace and even medical sectors. However, these machines are very expensive which hinders researcher investigations. Thus it is important to have an alternative data source for such machines. A probable solution is to develop a simulator to replicate such machine based on same input parameters and thus obtain results similar to that from an actual machine. This would help developers and researchers investigate several aspects of additive manufacturing without using the actual machine. This paper reports an investigation conducted to study the behavior of a selective laser melting machine under different scenarios. Influences due to components such as vacuum pump, reciprocating pump, gas inlet valve, vent valve, elevator and wiper have been included. Experimental result data has been used to build codes in C# software to program the PLC simulator. Validation experiments confirmed simulation output. The present work helps the end user to inspect real time simulations such as vacuum creation, inert gas atmosphere progression. Thus, simulation results offer time and resource savings to an additive manufacturing end user by him/her make informed decisions by supplying exact parameter settings suitable to his/her manufacturing requirements.
Keywords : Selective Laser Melting; PLC simulator; Additive
Manufacturing; 3D printing
I. INTRODUCTION
Additive manufacturing or 3D printing has gained massive popularity in recent times among researchers in many fields. Rapid advancement in this field has redefined and customized additive manufacturing to suit a wide spectrum of applications such as aerospace, automotive, medical and biological systems [1]. The history of AM can be rooted back to photo sculpture, a technology widespread in the 1860’s and Topography in the 1890’s. “Photo-Glyph Recording” technique (patented in 1951) was a technique developed from these early techniques of photo sculpture and topography, in which the cross sections of the object to be replicated were scanned and layers of transparent photo emulsion were exposed. The recent techniques of additive manufacturing such as Stereo lithography, selective laser
Revised Manuscript Received on August 05, 2019
Anupum Pandit, Symbiosis Institute of Technology (SIT), Symbiosis International (Deemed University) (SIU), Pune.
Ravi Sekhar, Symbiosis Institute of Technology (SIT), Symbiosis International (Deemed University) (SIU), Pune.
Pritesh Shah, Symbiosis Institute of Technology (SIT), Symbiosis International (Deemed University) (SIU), Pune.
melting, selective laser sintering is into existence because of advancements starting from the obsolete Photo Glyph Recording. The present day AM techniques are based out of four patents namely: vat photo polymerization, powder bed fusion, material extrusion and binder jetting. One of the earliest modern day AM techniques was Rapid Prototyping. Developed in the 1980’s, this technology could create printed parts and not just models. Rapid Prototyping led to time and cost reduction and the much famous product development cycle. Not much in use by industries, rapid prototyping was majorly used by scientists, professors , students and doctors to rapidly build and analyze models for theoretical studies and comprehension. Surgeons can use a damaged body part model for analysis and planning suitable operating procedure.
Nomenclature
AM Additive Manufacturing
SLM Selective Laser Melting
PLC Programmable Logic Controller
XML Extensible Mark-up Language
C# C Sharp Programming Language
GUI Graphical User Interface
VS2013 Visual Studio 2013
The current work is concerned with metal selective laser melting (SLM), which is a type of additive manufacturing. SLM is basically a powder bed fusion technique using metal powders [2]. It is one of the most preferred forms of AM due to its ability to generate complex geometries [3, 4, 5, 6]. 3D printing process is based on an input of sliced 3D CAD data, having layer thicknesses around 20 µm to 100 µm which result in multiple 2D sections.
The required part is then built layer by layer, through even distribution of metallic powder by a recoater. Each layer is then fused in inert atmospheric conditions. The resultant part properties are distinctive as its microstructure is affected by cycles of melting and solidification under highly intense heat inputs [7, 8, 9]. Simulation softwares such as 3D-Sim, Stratasys Insight, Materialize 3-Matic, Renishaw Quantum etc. have been developed to help simulate this intricate SLM process. However, the pre fabrication steps seem to have been excluded in these softwares, despite overwhelming impact of pre fabrication on the overall result. Pre fabrication simulation can offer significant
benefits, such as:
Simulation Based Process Optimization for
Additive Manufacturing
• Reduction in chamber stabilization time
• Improved quality by reducing pressure and oxygen level fluctuations within chamber.
• Reduction in machine failure probability
Optimization of pre fabrication procedure is difficult because the chamber must stabilize in minimum possible time while maintaining acceptable limits of pressure and oxygen levels. Optimization codes must address different scenarios such as power failures, set point overshoots, component failures etc. All this requires numerous system runs to evaluate appropriate machine response needed under varying situations. Running an actual machine for this purpose would prove costly in terms of time, power and inert gas consumption. Moreover, the prohibitive cost of such machines translates into their lower availability to conduct trials. Repeated trials may also undermine machine performance in the long run. Companies like Renishaw have many developers working on such problems. One of the solutions to these issues is the AM machine simulator described in current work.
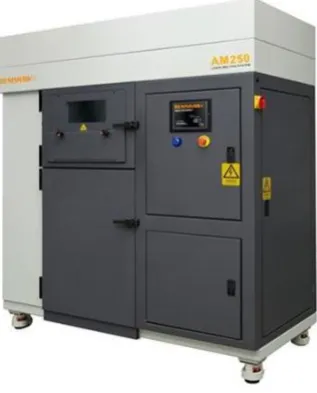
Fig. 1. Renishaw AM 250
1.2 Process Flow Model
Experimentation and analysis have been done for the Renishaw AM 250 machine (figure 1). Process flow steps are as follows. Changes in UI are detected by control logic, which commands the PLC. PLC forwards these commands to the machine and gets feedback. Machine feedback is fed to UI through control structure. In simulation, control logic commands and process feedback are given and taken from PLC and machine simulators, respectively. Thus, control structure updates UI with machine simulator feedback.
Check Input Status
Execute the program
Update the Output status
Fig. 2. Process Flow Model And Stages In PLC Operation [11]
2. AM Machine Simulator
The AM Machine Simulator has been developed in order to substitute the actual machine. The simulator incorporates the PLC simulator along with the machine simulator. The stages in PLC operation have been shown in figure 2. The entire simulation process is based on communication between the developers’ code, PLC simulator and the machine simulator. Similar to the working of the actual machine wherein the code commands the PLC which in turn commands the machine, a PLC simulator has been developed which replicates the working of the actual PLC. A PLC continuously scans a program and its operation consists of three major steps i.e. confirming input status, implementing the program and revising the output status (Fig. 2). The program contains the logic that should be carried out when a particular input changes [11].
[image:2.595.63.222.309.506.2]To replicate this process, a winform application in C# using VS2013 has been created. The application has two parts. The first replicates the PLC whereas the second part replicates the actual machine giving feedback to the PLC simulator. Another GUI named as RenAMP has been developed using which a user can interact with the winform application and visualize the feedback. An XML address table was created which contains all the digital and analogue input/output addresses. Each event/device of the machine has been given an input and a corresponding output address. A code in C# was implemented to map the PLC input and output. This mapping has been done such that when a user makes a change in the GUI, the input bit corresponding to the particular change gets updated. A background thread in the main program continuously scans the address table and detects a change in the input bit status. The PLC simulator then commands the machine simulator and waits for a feedback. On completion of the event by the machine simulator a feedback is sent to the PLC simulator and the PLC simulator using the mapping code updates the corresponding output bit for that particular event.
International Journal of Innovative Technology and Exploring Engineering (IJITEE) ISSN: 2278-3075, Volume-8 Issue-10, August 2019
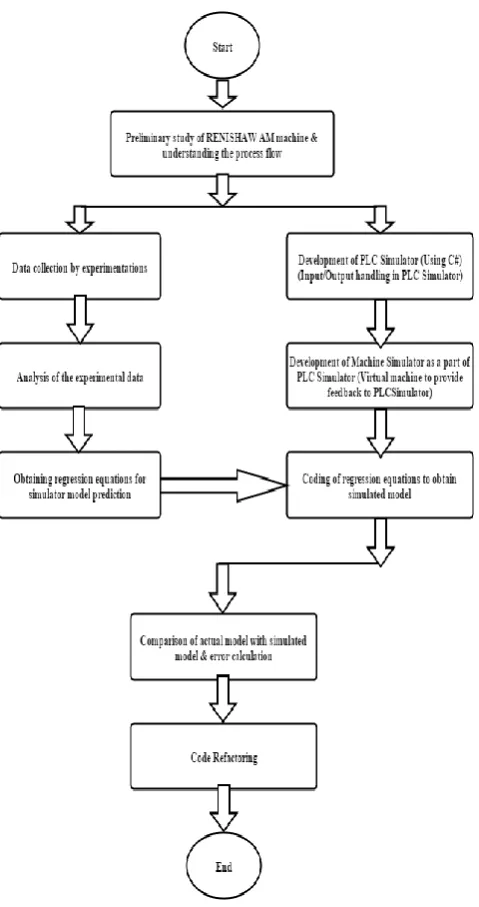
Fig. 3. Methodology Followed For Developing The Simulation Software
2.1 Prediction of Pressure & Oxygen Behavior using Curve Fitting
Four devices are employed to ensure stabilized inert gas conditions in the chamber. These devices are recirculation pump, gas pump, vacuum pump and vent valve. Their functions are listed in figure 4. Trials were conducted to understand the variations in chamber pressure and oxygen levels. Resultant trends were plotted graphically and curve fitting [12] was implemented to arrive at equations governing these phenomena. Microsoft excel was utilized for simple curve fitting exercise. These equations were coded and a log was created for corresponding GUI output. Governing equation outputs were compared with actual values. Statistical parameters like root mean square of error, percent error, sum of squares of errors and mean square of errors were determined to measure the accuracy of simulation results.
Vacuum Pump Gas Pump Vent Valve Recirculation Pump
Wiper/Recoater Elevator
•To create vacuum inside the chamber
•To pump argon into the chamber
•To release excess pressure from the chamber
•To recirculate gas from bottom to top of the chamber.
•To spread powder onto the substrate inside the chamber
•To move the substrate up or down as required during fabrication
Fig. 4. Function Of Different Devices In An AM Machine
Figure 5 shows a graph which has a curve plotted out of the actual experimented data. The device in operation was vacuum pump. Pressure change with respect to time was plotted in microsoft excel. Using the trendline option best
fit curve was visualized. The equation deduced was of a polynomial 3rd degree curve.
y
10
13x
3 6*10
8x
2 0.0125
x
where y= parameter (pressure in this case), x = time. The equation was coded and a simulated model was developed. The simulated curve was plotted on the same graph to visualize the deviation between the actual and simulated model. Similar experiments and comparisons were conducted for all the devices for both pressure and oxygen as shown in figure 6. Table 1 shows a comparison between actual model and the simulated model developed. The behaviour of pressure and oxygen during vent and recirculation operation is basically linear and hence the linear relation has been directly coded for them. It clearly shows that the percentage error lies below 10 percent for all the cases and hence can be said that curve fitting is an appropriate technique to predict the simulation cases.
The deduced equations for the different devices are: -
• Vacuum Pump
y 1013 x3 6*108 x2 0.0125x Pressure y 3*1011 x3 105 x2 1.6148x Top Oxygen y 2*1011 x3 3*106 x2 1.5722x Bottom Oxygen
• Vacuum Pump
y 2*108 x2 0.0096x Pressure y 7 *106 x2 1.8377x Top Oxygen
y
4*10
10x
3 8*10
5x
2 6.2393
x
Bottom [image:3.595.318.532.60.134.2]Fig. 5. Comparative Graph For Pressure
Table 1. Table Showing % Error Between Actual And Simulated Model.
Parameters Pressure Top Oxygen Bottom Oxygen
Experiment No. 1 2 3 1 2 3 1 2 3
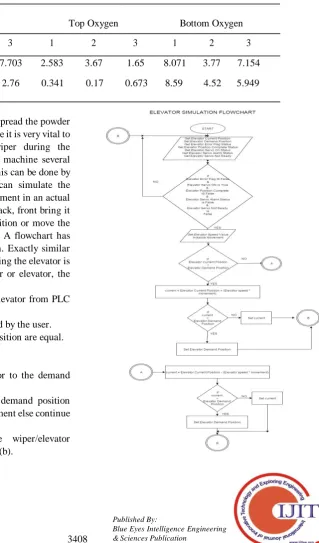
Vacuum Pump 3.26 5.34 7.703 2.583 3.67 1.65 8.071 3.77 7.154
Gas Pump 1.08 2.00 2.76 0.341 0.17 0.673 8.59 4.52 5.949
2.2 Wiper and Elevator Movements
A wiper as shown in figure 5 is used to spread the powder on top of the substrate in the chamber. Hence it is very vital to have a foolproof movement of the wiper during the fabrication. A developer needs to run the machine several times to check the accuracy of his code. This can be done by the AM machine simulator. Developer can simulate the wiper movement similar to the wiper movement in an actual machine. Developer can move the wiper back, front bring it to center position, move it to an exact position or move the wiper by a particular value front or back. A flowchart has been created to show the wiper simulation. Exactly similar case is with the elevator, only difference being the elevator is moved up or down. To simulate the wiper or elevator, the following steps are performed:
• Obtain actual position of the wiper/elevator from PLC Simulator
• Obtain the demand position as entered by the user. • Check whether actual and demand position are equal. • If equal, no movement required.
• If not equal, move the wiper/elevator to the demand position by a fixed speed.
• Keep checking whether actual and demand position have become equal or not, if yes stop movement else continue movement.
[image:4.595.220.540.289.833.2]International Journal of Innovative Technology and Exploring Engineering (IJITEE) ISSN: 2278-3075, Volume-8 Issue-10, August 2019
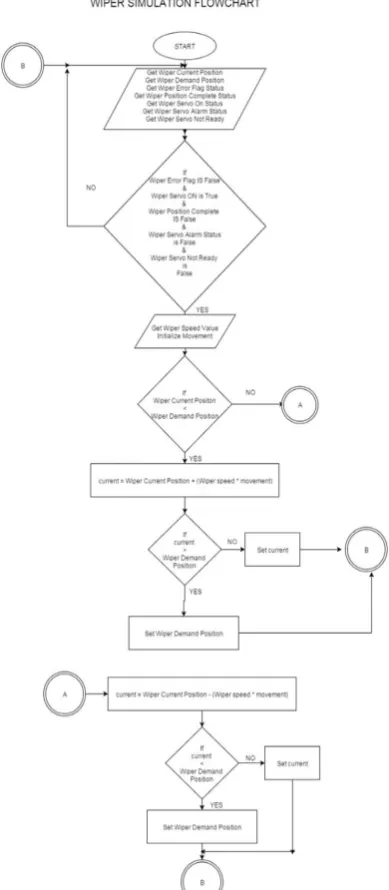
Fig. 7. (a) Wiper Simulation; (b) Elevator Simulation
2.3 Chamber Preparation and Build Simulation
The individual simulation of the peripheral devices (pumps, valves, wiper and elevator) makes it possible for a user to simulate the complete chamber preparation process and the build process. The GUI has a prepare chamber button which when pressed by the user, prepares the chamber for fabrication i.e. creation of vacuum, creation of inert gas environment and finally chamber stabilization. After the chamber stabilizes, the build can be simulated which shows the movement of the wiper and elevator for each layer. The entire chamber preparation process can be visualized by a user using the AM machine simulator. The machine simulator provides the feedback to the GUI as done by the actual machine in the actual case. This enables a user/developer to
2.3.1 Get an estimate of the time that will be taken by the actual machine to stabilize.
2.3.2 Amount of vacuum to be created to obtain the required oxygen levels.
2.3.3 Optimize the chamber preparation process by changing the process flow (sequence of operation of devices). 2.3.4 Optimize the build process by optimizing the wiper and elevator movements.
2.3.5 Enables developer to jump to different stages without having to wait for the earlier stage to get over.
3. Discussions and Limitations
One major advantage of the AM machine simulator is its ability to allow developers jump stages. A developer working on second stage can feed in data as per his requirement and move on to the next stage without having to wait for the first stage to get over. Lot of effort has been put to obtain a close to actual simulation model. But a significant error is noticed between actual and simulation making it necessary to apply techniques to reduce the error. The percentage error can be reduced by implementing optimization techniques. Many researchers have worked on different techniques to optimize the curve fitting equations. For instance, Genetic Algorithm is employed by many researchers for curve fitting optimization [13, 14]. Additive manufacturing does not show constant behavior. Its characteristics are dynamic because of variations depending on the temperature, atmospheric pressure and even the altitude of the machine’s location. Thus, system calibration assumes significance [15, 16] towards flexibility of the simulator for application in different setups.
II. CONCLUSION
The AM machine simulator is a software tool that has the capability to replicate the actual additive manufacturing machine approximately. One of its important novel features is the way in which it helps a developer to jump between stages. We have discussed in detail the way in which the communication between the PLC simulator, machine simulator and the GUI would take place. Simulation for every stage and every device operated during the pre-fabrication process has been discussed in detail enabling the user to get an approximate estimate of the chamber preparation process. Comparisons between real and simulated results point towards possible optimization of simulation model using any of the modern techniques. In conclusion, AM machine simulator, is a powerful and useful tool that promises to be of great assistance to AM machine manufacturers and researchers.
REFERENCES
1. W. Trochim,J. Davis "Computer Simulation for Program Evaluation." Evaluation Review Vol. 5. 10 No. 5, October 1986 pp. 609-634. 2. J. J. Beaman, C. R. Deckard, Selective laser sintering with assisted
powder handling, US Patents No. 4938816.
[image:5.595.64.259.68.514.2]4. B.C. Zhang, N.E. Fenineche, H.L. Liao, C. Coddet Microstructure and magnetic properties of Fe–Ni alloy fabricated by selective laser melting Fe/Ni mixed powder J Mater Sci Technol, 29 (8) (2013), pp. 757–760 5. Y.D. Wang, H.B. Tan, Y.L. Fang, H.M. Wang Microstructure and
mechanical properties of hybrid fabricated 1Cr12Ni2WMoVNb steel by laser melting deposition Chin J Aeronaut, 26 (2) (2013), pp. 481–486 6. D.D. Gu, Y.C. Hagedorn, W. Meiners, G. Meng, R.J.S. Batista, K.
Wissenbach Densification behavior, microstructure evolution, and wear performance of selective laser melting processed commercially pure titanium Acta Mater, 60 (9) (2012), pp. 3849–3860
7. H. Attar , M. Bonisch, M. Calin, L.C. Zhang, S. Scudino, J. Eckert, Selective laser melting of in situ titanium–titanium boride composites: processing, microstructure and mechanical properties. Acta Mater 2014;76:13–22.
8. D.D. Gu, YF Shen,G.B. Meng, Growth morphologies and mechanisms of TiC grains during selective laser melting of Ti– Al–C composite powder. Mater Lett 2009;63(29):2536–8.
9. F. Verhaeghe,T. Craeghs,J. Heulens, L. Pandelaers, A pragmatic model for selective laser melting with evaporation. Acta Mater 2009;57(20):6006–12.
10.C. Sutcliffe ,P. Fox., Manufacture of metal articles , US Patent - 20150135897 A1,(May 2015).
11.Y.N. Burali, PLC Based Industrial Crane Automation & Monitoring, International Journal of Engineering and Science, Vol. 1, Issue 3 (Sept 2012), PP 01-04.
12.M. Hook, L. Junchen,O. Noriaki, S. Snowden, ”Descriptive and predictive growth curves in energy system analysis” Natural Resources Research, 2011, Vol. 20, Issue 2: 103-116.
13.M. Gulsen, A.E. Smith,D.M. Tate , A genetic algorithm approach to curve fitting, International Journal of Production Research ,1995; 33(7):1911-1923.
14.M.A. Farahat ,M. Talaat, Short-Term Load Forecasting Using Curve Fitting Prediction Optimized by Genetic Algorithms, International Journal of Energy Engineering 2012, 2(2): 23-28.
15.B. Park , J.D. Schneeberger , Microscopic Simulation Model Calibration and Validation, Transportation Research Record 1856 , Paper No. 03-2531.
16.M. Hofmann, On the Complexity of Parameter Calibration in Simulation Models, JDMS, Volume 2, Issue 4, October 2005 Pages 217– 226.
AUTHORSPROFILE
Anupum Pandit was a research student in Symbiosis Institute of Technology, Pune.
Ravi Sekhar is an Assistant Professor in Symbiosis Institute of Technology, Pune.