SPATIAL ANALYSIS AND MODELLING OF FLOOD RISK AND CLIMATE ADAPTATION CAPACITY FOR ASSESSING URBAN
COMMUNITY AND CRITICAL INFRASTRUCTURE INTERDEPENDENCY
A Dissertation submitted by
Rodolfo Espada, Jr.
BSF (UP Los Baños) MENRM (UPOU Los Baños)
For the award of
Doctor of Philosophy
ii
Flood hazards are the most common and destructive of all natural hazards in the world. A series of floods that hit the south east region of Queensland in Australia from December 2010 to January 2011 caused a massive devastation to the State, people, and its critical infrastructures. GIS-based risk mapping is considered a vital component in land use planning to reduce the adverse impacts of flooding. However, the integrated mapping of climate adaptation strategies, analysing interdependencies of critical infrastructures, and finding optimum decisions for natural disaster risk reduction in floodplain areas remain some of the challenging tasks. In this study, I examined the vulnerability of an urban community and its critical infrastructures to help alleviate these problem areas. The aim was to investigate the vulnerability and interdependency of urban community’s critical infrastructures using an integrated approach of flood risk and climate adaptation capacity assessments in conjunction with newly developed spatially-explicit analytical tools.
As to the research area, I explored Brisbane City and identified the flood-affected critical infrastructures such as electricity, road and rail, sewerage, stormwater, water supply networks, and building properties. I developed a new spatially-explicit analytical approach to analyse the problem in four components: 1) transformation and standardisation of flood risk and climate adaptation capacity indicating variables using a) high resolution digital elevation modelling and urban morphological characterisation with 3D analysis, b) spatial analysis with fuzzy logic, c) geospatial autocorrelation, among others; 2) fuzzy gamma weighted overlay and topological cluster analyses using Bayesian joint conditional probability theory and self-organising neural network (SONN); 3) examination of critical infrastructure interdependency using utility network theory; and 4) analysis of optimum natural disaster risk reduction policies with Markov Decision Processes (MDP).
The flood risk metrics and climate adaptation capacity metrics revealed a geographically inverse relationship (e.g. areas with very high flood risk index occupy a low climate adaptation capacity index). Interestingly, majority of the study area (93%) exhibited negative climate adaptation capacity metrics (-22.84 to < 0) which indicate that the resources (e.g. socio-economic) are not sufficient to increase the climate resiliency of the urban community and its critical infrastructures. I utilised these sets of information in the vulnerability assessment of critical infrastructures at single system level. The January 2011 flood instigated service disruptions on the following infrastructures: 1) electricity supplies along 627km (75%) and 212km (25%) transmission lines in two separate areas; 2) road and rail services along 170km (47%) and 2.5km (38%) networks, respectively; 3) potable water supply along 246km (56%) distribution lines; and 4) stormwater and sewerage services along 33km (91%) and 32km (78%) networks, respectively.
iii short-term measures (e.g. protection).
The analysis with Markov Decision Processes (MDP) elucidated that the Australian Commonwealth government utilised the natural disaster risk reduction expenditure to focus on recovery while the State government focused on mitigation. There was a clear indication that the results of the MDP analysis for the State government established an agreement with the previous economic analysis (i.e. mitigation could reduce the cost of recovery by 50% by 2050 with benefit-cost ratio of 1.25).
iv
Certification of Dissertation
I certify that the ideas, experimental work, results, analyses, software and conclusions reported in this dissertation are entirely my own efforts, except where otherwise acknowledged. I also certify that the work is original and has not been previously submitted for any other award, except where otherwise acknowledged.
_____________________________ ____________________ Signature of Candidate Date
ENDORSEMENT
_____________________________ ____________________ Signature of Principal Supervisor Date
v
Peer-Reviewed Conference Papers
Chapter 3
Espada, R., Apan, A. & McDougall, K., 2012. Spatial modelling of adaptation strategies for urban built infrastructures exposed to flood hazards. In: Queensland Surveying and Spatial Conference 2012 (QSSC 2012), 13-14 Sept 2012. Brisbane City, Surveying and Spatial Sciences Institute.
Espada, R. J., Apan, A. & McDougall, K., 2013. Understanding the January 2011 Queensland flood: the role of geographic interdependency in flood risk assessment for urban community. In: Australia and New Zealand Disaster and Emergency Management Conference (ANZDMC) 2013, 28-30 May 2013. Brisbane City, AST Management Pty Ltd. pp. 68-88. ISBN: 978-1-922232-04-5.
Chapters 4 to 5
Espada, R., Apan, A. & McDougall, K., 2013. Using spatial modelling to develop flood risk and climate adaptation capacity metrics for vulnerability assessments of urban community and critical water supply infrastructure. In: 49th International Society of City and Regional Planners (ISOCARP) Congress 2013, 1-4 October 2013. Brisbane City, International Society of City and Regional Planners (ISOCARP). ISBN: 978-94-90354-25-1.
Espada, R., Apan, A. & McDougall, K., 2013. Using spatial modelling to develop flood risk and climate adaptation capacity metrics for assessing the vulnerability of urban community and critical electricity infrastructure. In: 20th International Congress on Modelling and Simulation (MODSIM) 2013, Adelaide, Modelling and Simulation Society of Australia and New Zealand (MSSANZ), pp. 2304-2310. ISBN: 978-0-9872143-3-1.
Journal Papers
Chapter 5
vi
Risk Reduction Policies with Markov Decision Processes. Manuscript accepted on 20 June 2014 in Applied Geography for publication.
Awards
2013 ESRI Young Scholar Award for Australia – ESRI Australia and ESRI USA 2013 Queensland Spatial Excellence Award (Highly Commended Postgraduate Student) – Surveying and Spatial Sciences Institute (SSSI) Australia
2013 ACSC Postgraduate Student Seminar Research Paper Presentation First Prize Winner – International Centre for Applied Climate Sciences, University of Southern Queensland
2012 ACSC Postgraduate Student Seminar Research Paper Presentation First Prize Winner – Australian Centre for Sustainable Catchments, University of Southern Queensland
vii
Foremost, I would like to express my sincere appreciation to my Principal Supervisor, Associate Professor Armando Apan for his wisdom, direction and motivation all throughout this research journey. The guidance of my Associate Supervisor, Professor Kevin McDougall, significantly helped me in framing up this thesis right from the very beginning. Access and funding support for the spatial datasets used in this study were also made possible because of their genuine generosity.
Besides my supervisors, my sincere gratitude goes to the Australian Government through the Department of Education for the Endeavour Postgraduate Award and the team from Austraining International for providing the financial support and scholarship management support, respectively.
This thesis would neither be accomplished nor completed without the access to other spatial datasets. As such, my heartfelt appreciations go as well to the Australian Bureau of Statistics (ABS), Brisbane City Council (BCC), Energex Ltd., Queensland Fire and Rescue Service (QFRS), Queensland Department of Environment and Resource Management (DERM), and Queensland Government Information Service (QGIS).
viii
Page
Abstract ii
Certification of Dissertation iv
Publications and Awards v
Acknowledgments vii
Table of Contents viii
List of Figures xii
List of Tables xvii
Abbreviations xix
Chapter 1 INTRODUCTION 1
1.1 Background 1
1.2 Research Problems and Significance 2
1.3 Research Objectives 4
1.4 Location of the Study Area 5
1.5 Overview of Research Methods 6
1.6 Scope and Limitation of the Study 9
1.7 Organisation of the Thesis 10
Chapter 2 LITERATURE REVIEW 12
2.1 Overview of the Climate System 12
2.2 Climate and Climate Change in Australia and Queensland 12 2.3 Floods in Queensland and other Australian States 14
2.4 Flood Risk Assessment 16
2.4.1 Risk Components and its Relationships 16
2.5 Climate Adaptation Capacity 18
2.6 Developing Flood Risk and Climate Adaptation Capacity
Indicating Variables 21
2.6.1 Geographic Information System 22
2.6.2 Spatial Analytical Techniques 22
2.6.2.1 Three Dimensional (3D) Analysis using LiDAR 22 2.6.2.2 Spatial Analysis with Fuzzy Logic 24
2.6.2.3 Proximity Analysis 25
ix
2.6.2.7 Hot Spot Analysis 27
2.6.2.8 Line Statistical Analysis 27 2.7 Vulnerability Assessment of Critical Infrastructures for
Interdependency Analysis 27
2.7.1 Application of Self-Organising Neural Network (SONN) 28 2.7.2 Application of Bayesian Joint Conditional Probability 29 2.7.3 Critical Infrastructure Interdependency Analysis 30 2.8 Optimisation Techniques with Markov Decision Processes 31
2.9 Summary 33
Chapter 3 METHODS FOR THE TRANSFORMATION AND
STANDARDISATION OF INDICATING VARIABLES 35
3.1 Introduction 35
3.2 Key Concepts and Data Inputs 36
3.3 Data Transformation and Standardisation 40
3.3.1 Three Dimensional (3D) Analysis 42
3.3.1.1 Digital Elevation Modelling for Flood Hazard
Analysis 42
3.3.1.2 Digital Building Modelling for Urban
Morphological Characterisation 45
3.3.2 Spatial Analysis with Fuzzy Logic 47
3.3.3 Proximity Analysis 54
3.3.4 Quadrat Analysis 55
3.3.5 Spatial Statistics with Collect Events Analysis 57 3.3.6 Modelling with Spatial Autocorrelation 60
3.3.7 Hot Spot Analysis 70
3.3.8 Line Statistics 71
3.4 Summary and Conclusion 72
Chapter 4 USING SPATIAL MODELLING TO DEVELOP FLOOD
RISK AND CLIMATE ADAPTATION CAPACITY METRICS 77
4.1 Introduction 77
4.2 Research Methods 78
4.2.1 Application of Self-Organising Neural Network (SONN) 78 4.2.2 Quantification of Flood Risk and Climate Adaptation
x
4.2.2.2 GIS-based Weighted Overlay Analysis 83
4.3 Results and Discussions 84
4.3.1 Generated SOM/SONN Planes by Infrastructure Assets 84 4.3.2 Flood Risk and Climate Adaptation Capacity Models 90 4.3.3 Flood Risk and Adaptation Capacity Model Applications 99
4.4 Summary and Conclusion 102
Chapter 5 VULNERABILITY ASSESSMENT OF CRITICAL
INFRASTRUCTURES FOR INTERDEPENDENCY ANALYSIS 104
5.1 Introduction 104
5.2 Research Methods 104
5.2.1 Setting the Dimensions of Critical Infrastructure
Interdependency 104
5.2.2 Climate Risk Environment 105
5.2.3 Critical Infrastructures’ Common Cause and Cascade
Failures 106
5.2.3.1 Modelling the Individual Systems 107 5.2.4 Characterising the Critical Infrastructure Interdependencies 107
5.3 Results and Discussions 108
5.3.1 Vulnerability Assessment of Critical Infrastructures at
Single System Level 108
5.3.1.1 Electricity Network Model 109
5.3.1.2 Road and Rail Networks 114
Road Network Model for Evacuation Routing 119 5.3.1.3 Water Supply Network Model 121
5.3.1.4 Sewerage Network Model 125
5.3.1.5 Stormwater Network Model 127 5.3.2 Critical Infrastructure Interdependencies 130 5.3.3 Climate Adaptation Strategies/Resiliency Measures 135
5.3.3.1 Electricity Network 136
5.3.3.2 Road and Rail Networks 137
5.3.3.3 Sewerage Network 138
5.3.3.4 Water Supply Network 139
5.3.3.5 Stormwater Network 140
xi
Strategies 142
5.4 Summary and Conclusion 143
Chapter 6 SPATIAL MODELLING OF NATURAL DISASTER RISK REDUCTION POLICIES WITH MARKOV DECISION PROCESSES (MDP)
145
6.1 Introduction 145
6.2 Research Methods 146
6.2.1 Setting the Markov Decision Processes (MDP) Algorithms 146
6.2.1.1 State Variables 148
6.2.1.2 Action Variables 148
6.2.1.3 State Transition Probabilities 150
6.2.1.4 Reward Variables 151
6.2.1.5 Policy Iteration 154
6.2.1.6 Discounting Factors 155
6.2.2 Integration of Markov Decision Processes (MDP) with
Geographic Information System (GIS) 155
6.3 Results and Discussions 157
6.4 Summary and Conclusion 166
Chapter 7 CONCLUSIONS AND RECOMMENDATIONS 167
7.1 Introduction 167
7.2 Summary of Findings 167
7.3 Conclusions 169
7.4 Recommendations for Future Works 170
REFERENCES 171
APPENDICES 203
Appendix 1 Selected indicating variables processed with fuzzy logic and
corresponding FMVs 203
Appendix 2 Calculated global Moran’s I statistics of flood risk and
xii
Figure Page
1.1 The location map of the study area 6
1.2 The input-process-output (IPO) model used in the study 8
1.3 The schematic layout of this Thesis 11
2.1 The Crichton’s (1999) risk triangle/pyramid 16 3.1 The cross-functional process map used in the study 41 3.2 The flow chart of flood hazard analysis and urban
morphological characterisation used in the study 42
3.3 The LiDAR-derived digital elevation model 45
3.4 The flood hazard index map 45
3.5 The building footprints map 46
3.6 The LiDAR-derived digital building model and building volume
in 3D 46
3.7 Point and stick map of building FSI 47
3.8 Physical vulnerability index map from building floor space 47 3.9 The geometric interpretation of fuzzy small membership 48 3.10 The geometric interpretation of fuzzy large membership 48 3.11 The physical vulnerability index map of settlement indicating
variable processed with fuzzy logic 49
3.12 Index maps of fifteen (15) social vulnerability indicating
variables processed with fuzzy logic 50
3.13 Index maps of three (3) exposure indicating variables processed
with fuzzy logic 53
3.14 The vulnerability index maps of access to emergency services
and response time 55
3.15 The exposure index maps from infrastructure nodes 57 3.16 The consequential hazard maps of the study area 59 3.17 The function curves of hazard indicating variables 62 3.18 The function curves of physical vulnerability indicating
variables 62
3.19 The function curves of social vulnerability indicating variables 63 3.20 The function curves of infrastructures’ exposure indicating
variables 63
xiii
3.23 The cluster and outlier (CO) maps of social vulnerability
indicating variables 69
3.24 The cluster and outlier (CO) maps of critical infrastructures’
exposure indicating variables 69
3.25 The heritage infrastructure exposure index map 70 3.26 The roads and rails vulnerability index map 71 4.1 The analogy between artificial neuron and biological neuron 78 4.2 The conceptual self-organising neural network (SONN) used in
the study 79
4.3 The MATLAB import wizard tool 80
4.4 The MATLAB’s neural network clustering tool 82
4.5 Example of ArcGIS weighted overlay analytical tool used in the
study 84
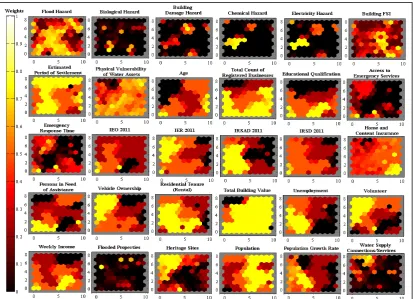
4.6 The SOM/SONN planes of indicating variables for electricity
infrastructure vulnerability assessment 85
4.7 The SOM/SONN planes of indicating variables for road and rail
infrastructures vulnerability assessment 85
4.8 The SOM/SONN planes of indicating variables for sewerage
infrastructure vulnerability assessment 86
4.9 The SOM/SONN planes of indicating variables for stormwater
infrastructure vulnerability assessment 86
4.10 The SOM/SONN planes of indicating variables for water supply
infrastructure vulnerability assessment 87
4.11 The SOM/SONN planes of indicating variables for integrated
infrastructures vulnerability assessment 87
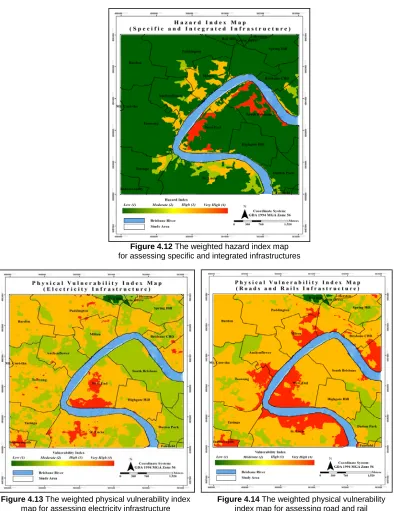
4.12 The weighted hazard index map for assessing specific and
integrated infrastructures 90
4.13 The weighted physical vulnerability index map for assessing
electricity infrastructure 90
4.14 The weighted physical vulnerability index map for assessing
road and rail infrastructures 90
4.15 The weighted physical vulnerability index map for assessing
sewerage infrastructure 91
4.16 The weighted physical vulnerability index map for assessing
stormwater infrastructure 91
4.17 The weighted physical vulnerability index map for assessing
xiv
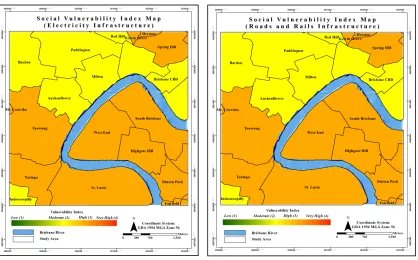
4.19 The weighted social vulnerability index map for assessing
electricity infrastructure 92
4.20 The weighted social vulnerability index map for assessing road
and rail infrastructures 92
4.21 The weighted social vulnerability index map for assessing
sewerage infrastructure 92
4.22 The weighted social vulnerability index map for assessing
stormwater infrastructure 92
4.23 The weighted social vulnerability index map for assessing water
supply infrastructure 93
4.24 The weighted social vulnerability index map for assessing the
integrated infrastructure 93
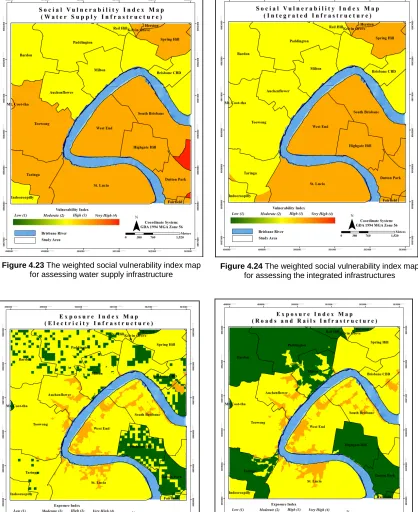
4.25 The weighted exposure index map for assessing electricity
infrastructure 93
4.26 The weighted exposure index map for assessing road and rail
infrastructures 93
4.27 The weighted exposure index map for assessing sewerage
infrastructure 94
4.28 The weighted exposure index map for assessing stormwater
infrastructure 94
4.29 The weighted exposure index map for assessing water supply
infrastructure 94
4.30 The weighted exposure index map for assessing the integrated
infrastructures 94
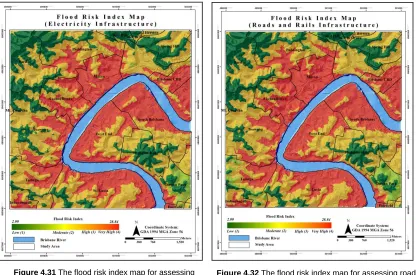
4.31 The flood risk index map for assessing electricity infrastructure 95 4.32 The flood risk index map for assessing road and rail
infrastructures 95
4.33 The flood risk index map for assessing sewerage infrastructure 96 4.34 The flood risk index map for assessing stormwater infrastructure 96 4.35 The flood risk index map for assessing water supply
infrastructure 96
4.36 The flood risk index map for assessing the integrated
infrastructures 96
4.37 The adaptation capacity index map for assessing electricity
infrastructure 97
4.38 The adaptation capacity index map for assessing road and rail
infrastructures 97
4.39 The adaptation capacity index map for assessing sewerage
xv
4.41 The adaptation capacity index map for assessing water supply
infrastructure 98
4.42 The adaptation capacity index map for assessing the integrated
infrastructures 98
4.43 The area coverage of flood risk and climate adaptation capacity
by infrastructure asset 100
5.1 The dimensions of infrastructure interdependency used in this
study 105
5.2 A sample query builder used to identify the geographic
interdependency of electricity and sewerage networks 108 5.3 The Ergon Energy and Energex power distribution maps 109 5.4 The typical electricity supply system in Queensland 110 5.5 The electricity network map of the study area 111 5.6
The electricity network vulnerability maps on north east to south west areas using flood risk and climate adaptation capacity models
112
5.7 The electricity network vulnerability maps in the south east area
using flood risk and climate adaptation capacity models 113
5.8 The road network map of Queensland 115
5.9 The road network map of the study area 116
5.10 The Queensland rail network 117
5.11 The train network map of Brisbane City 118
5.12
The road and rail networks vulnerability and flood evacuation route maps using flood risk and climate adaptation capacity models
121
5.13 The water supply network and assets in South East Queensland
owned and managed by SEQ Water 122
5.14 The water supply network map of the study area 123 5.15
The generated water supply network vulnerability maps of the study area using flood risk and climate adaptation capacity models
124 5.16 The sewerage network map of the study area 125 5.17 The sewerage network vulnerability maps of the study area
using flood risk and climate adaptation capacity models 127 5.18
The Brisbane River Environmental Values and Water Quality Objectives Schedule showing the coverage of urban stormwater infrastructure
xvi
5.21 The integrated infrastructure vulnerability maps of the study
area using flood risk and climate adaptation capacity models 131 5.22 The geographic interdependency of electricity and sewerage
networks 132
5.23 The geographic interdependency of electricity, road, and
sewerage networks 133
5.24 The co-location map of stormwater and sewerage networks 134 5.25 The critical infrastructure interdependency matrix 135 5.26
The hierarchy of infrastructure interdependency’s climate adaptation and resiliency measures in Queensland in response to 2010/2011 floods
142 6.1 The schematic diagram of MDP used in the study 147 6.2 A sample schematic diagram of finding optimum natural
disaster risk reduction policy with MDP and GIS 156 6.3
The MDP scenario 5 expected utility maps for very high (VH) flood risk future state using mitigation, preparedness, response, and recovery action variables
160
6.4
The MDP scenario 5 expected utility maps for high (H) flood risk future state using mitigation, preparedness, response, and recovery action variables
161
6.5
The MDP scenario 5 expected utility maps for moderate (M) flood risk future state using mitigation, preparedness, response, and recovery action variables
162
6.6
The MDP scenario 5 expected utility maps for low (L) flood risk future state using mitigation, preparedness, response, and
recovery action variables
xvii
Table Page
2.1 The Queensland’s climatic conditions 13
2.2 Flood events in Queensland and other Australian States from 1899
to 2011 14
3.1 The thematic layers/indicating variables with corresponding
assumptions used in the study 37
3.2 Flood risk and adaptation capacity index classification 41 3.3 The technical background information of LiDAR system and data 43 3.4 The flood hazard categories and risk description 44 3.5 The infrastructure nodes/points used in quadrat analysis for
exposure assessment 56
3.6
Summary of generated z-scores and distance bands of food risk and climate adaptation capacity indicating variables used in the local Moran’s I
61
3.7 The CO Type classes of hazard indicating variables with assigned
ordinal values and perceived levels of flood risk 65 3.8 The CO Type classes of physical vulnerability indicating variables
with assigned ordinal values and perceived levels of flood risk 66 3.9 The CO Type classes of social vulnerability indicating variables
with assigned ordinal values and perceived levels of flood risk 66 3.10 The CO Type classes of exposure indicating variables
with assigned ordinal values and perceived levels of flood risk 66 3.11 Procedural summary of the transformation and standardisation of
indicating variables 72
4.1 The number of training performed in the neural network 81 4.2 The indicating variables used in the SOM/SONN analysis and
corresponding Bayesian joint conditional probable weights 88 4.3 The area coverage (%) and corresponding flood risk and
adaptation capacity metrics 101
5.1 The identity values of critical infrastructures 108 5.2 The electricity assets that participated in the electricity network
model 111
5.3 Count of highly vulnerable electricity assets within very high flood
risk zone or low adaptation capacity 112
5.4 Summary of potentially disrupted electricity transmission lines
within the study area 113
5.5 The study area’s potential road route to evacuation centre 1 (RNA
xviii
5.7 Counts of highly to very highly vulnerable critical water supply
network assets 124
5.8 Counts and lengths of highly vulnerable critical sewerage network
assets 126
6.1 Total government expenditure by category 1990/91-2001/02 149 6.2 Total commonwealth expenditure by category 1990/91-2001/02 150 6.3 Total state and territory government expenditure by category
1990/91-2001/02 150
6.4 The state transition probabilities used in the MDP analysis 151 6.5 The total lost earnings for businesses impacted by the Queensland
floods 151
6.6 The total lost earnings as a percentage of annual turnover for
businesses impacted by the Queensland floods 152 6.7 The summary of selected MDP scenarios presented in the Chapter 157 6.8 The pattern of disaster risk reduction optimum policies 164 6.9 Summary of the expectimax values and optimum policies across
xix
3D Three-Dimensional
ABS Australian Bureau of Statistics
AC Adaptation Capacity
AEP Average Exceedance Probability AER Australian Energy Regulator ANN Artificial Neural Network ARI Annual Recurrence Interval
AOV Assigned Ordinal Value
BCC Brisbane City Council
BCR Benefit-Cost Ratio
BOM Bureau of Meteorology
BTRE Bureau of Transport and Resources Economics
CA Climate Adaptation
CCA Climate Change Adaptation
CEC Commission of the European Communities
CCIQ Chamber of Commerce and Industries Queensland CIS Critical Infrastructure System
CO Cluster and Outlier
CSIRO Commonwealth Scientific and Industrial Research Organisation
DBM Digital Building Model
DCCEE Department of Climate Change and Energy Efficiency
DCS Department Community Safety
DEFRA Department for Environment, Food and Rural Affairs
DEM Digital Elevation Model
DERM Department of Environment and Resource Management
DEWS Department of Energy and Water Supply DNRM Department of Natural Resources and Mines DOTARS Department of Transport and Regional Services
DRR Disaster Risk Reduction
DSM Digital Surface Model
DTM Digital Terrain Model
DTMR Department of Transport and Main Roads EHP Environment and Heritage Protection
xx
ERT Emergency Response Time
FMV Fuzzy Membership Values
FR Flood Risk
FRACIAS Flood Risk - Adaptation Capacity Index - Adaptation Strategies
FSE Fuzzy Synthetic Evaluation
FSI Floor Space Index
GIS Geographic Information System H High Risk (Rating of flood risk model) HH High Values Surrounded by High Values HL High Values Surrounded by Low Values IAG Insurance Australia Group
ICC Ipswich City Council
IDW Inverse Distance Weight
IEO Index for Education and Occupation IER Index for Economic Resources
IPCC Intergovernmental Panel on Climate Change IRSAD Index of Relative Socio-Economic Advantage and
Disadvantage
IRSD Index of Relative Socio-Economic Disadvantage
KML Keyhole Markup Language
L Low Risk (Rating of flood risk model) LH Low Values Surrounded by High Values LiDAR Light Detection and Ranging
LL Low Values Surrounded by Low Values M Moderate Risk (Rating of flood risk model)
MDP Markov Decision Processes
NDRRA Natural Disaster Relief and Recovery Arrangements NFRAG National Flood Risk Advisory Group
NS Not Significant
PFR Perceived Flood Risk Level
QCA Queensland Competition Authority
QCM Quadrat Counting Method
QFCI Queensland Floods Commission of Inquiry QFRS Queensland Fire and Rescue Service
xxi
RDA Rapid Damage Assessment
SEIFA Socio-Economic Index for Areas
SEQ South East Queensland
SOM Self-Organising Map
SONN Self-Organising Neural Network
SoQ State of Queensland
TC Tropical Cyclones
TIFF Tagged Image File Format
UNDP United Nations Development Programme
UNISDR United Nations International Strategy for Disaster Reduction
UQ-CGQ University of Queensland Centre for Government Queensland
1 Chapter 1
INTRODUCTION
1.1 Background
Flood hazards are the most common and destructive of all natural hazards (Vanneuville et al. 2011) and flood damages had been estimated to be the most costly in Australia (BTRE 2002 and Geoscience Australia 2010a). To reduce the impact of flooding, flood hazard mapping has been considered a vital component for appropriate land use planning in flood prone areas (Linham and Nicholls 2010). In doing so, flood forecasts are usually determined by examining past occurrences of flooding events, determining recurrence intervals of historical events (known as Annual Recurrence Interval), and then extrapolating to future probabilities (known as Average Exceedance Probability) (Baer 2008). Taking along with forecasts, nowcasting can also be done by describing in details the current weather through extrapolation of weather data (e.g. radar echoes) for a period of 0 to 6 hours ahead (WMO n.d.).
The estimation of the Average Exceedance Probability (AEP) of extreme floods is grouped into two broad categories: the statistical streamflow modelling methods and rainfall-runoff modelling methods (Smith et al. 2010). These modelling and mapping techniques produce a better understanding of the causes and magnitude of disastrous flooding. Furthermore, these methods will provide flood information necessary to support the development of an integrated strategy to improve disaster resilience and preparedness in the flood hazard reduction areas (Teasdale et al. 2010).
2
transportation, residential houses, commercial and industrial buildings, education, and public health and safety, etc. The policy, research and implementing agencies treated them separately – an approach analogous to a “pigeon-hole”. Hence, the research gap on spatial modelling and vulnerability assessment of integrated critical infrastructures as significant research contribution in providing policies for flood risk management and climate adaptation strategies was examined.
1.2 Research Problems and Significance
The impacts of climate on our ecological and socio-economic systems will most likely affect several sectors like food, industry, settlement and society, health, and water (Parry et al. 2007). In the urban setting, for example, some cities will face difficulties in providing basic services to their inhabitants like energy and water supply, physical infrastructure, transportation, ecosystem goods and services, and industrial production (UN Habitat 2011). Furthermore, the United Nations estimates that by 2025, half of the world’s population will be living in areas that are at risk from storms and other weather extremes (Heller et al. 2003). Thus, there is an urgent need to develop natural disaster risk reduction measures and climate adaptation strategies to help minimise the harmful effects of extreme weather events like floods.
In Australia, the Government has funded a number of projects under the Climate Change Adaptation Program to improve knowledge of the impacts of climate change, strengthen the capacity of decision-makers to respond and address major areas of national vulnerability (DCCEE 2010). The current recommended strategies are to manage climate risk through mitigation (i.e. net reductions in greenhouse gas emissions) and adaptation to unavoidable climate impacts (CSIRO 2007). In support to the latter strategy, this study examined the vulnerability of an urban community and its critical infrastructures exposed to extreme flood event.
In New York City, the New York City Climate Change Adaptation Task Force (NYC CCATF) evaluated the vulnerability of its infrastructures to climate change with emphasis on coastal flooding and developed adaptation strategies such as maintenance and operations (e.g. temporary flood gates, cleaning of drainage systems, etc.), capital investments (e.g. installation of new flood barriers, elevating elements of critical infrastructure to levels above projected flood elevations), and regulatory (e.g. modification of city building codes and design standards (McLaughlin et al. 2011). In The Netherlands, the urban water managers in the city of Rotterdam developed a new water management strategy through a transformative water management approach by combining urban design with a climate adaptation strategy (Graaf and Brugge 2010). In New Zealand, a study was conducted to understand the impact of climate changes on the interconnected infrastructure systems and services (ISS) in Hamilton City (Jollands et al. 2006).
3
Conversely, the Rotterdam study lacks an emphasis on the importance of infrastructure interdependencies as thoroughly presented in the Hamilton City study. Infrastructure interdependency refers to the networks of infrastructures wherein the operation of individual infrastructure sector relies on other sectors, e.g. energy, water and transport networks depend on information and communication technology (ICT) infrastructure for control and monitoring of their conditions, which entails dependency on energy (Collins et al. 2011). Thus, infrastructure interdependencies are highly critical considering that extreme events are responsible to ‘cascade failure’ where the failure of one aspect of infrastructure can lead to complete fragmentation of interdependent networks (Buldyrev et al. 2010).
In identifying natural disaster risk reduction policies and climate adaptation strategies, the Geographic Information System (GIS) and remote sensing technologies play a significant role in climate impact assessment process. Their capability to handle and analyse thematic maps with high accuracy, time- and cost-efficiency has been demonstrated in various disciplines. With its wide range of applications and modelling functions, these technologies are popular tools in disaster risk management. Thus, the successful utilisation of these technologies in disaster management is crucial (Altan et al. 2010) for study of historical events (Islam and Sado 2000), a major tool in planning (Ernst and Mostafa 2010), and to map spatial distribution of flood risk and vulnerability (Karmakar et al. 2010). As a tool, GIS can be used for analysing climate impacts, identifying the risks and opportunities that will need to be responded to, defining the geographical areas most sensitive to climate change, and identifying appropriate adaptation responses (Liu 2009).
A GIS-based framework can provide a scientific understanding of earth systems and leads to more thoughtful and informed decision making (Dangermond and Baker 2010) to combat the potential harmful effects of extreme climatic conditions. However, the greatest priority is to develop responses or strategic actions that can work within the high uncertainty of future climate change, to build resilience, and maintain flexibility (Hunt and Watkiss 2010). In prioritising strategic responses for climate adaptation and natural disaster risk reduction, decision-makers are confronted with competing financial resources. Hence, in an increasingly competitive financial environment, government expenditures for disaster risk reduction should be spent optimally without losing the efficacy of finest delivery of infrastructure services to communities.
Having identified the significant issues mentioned above, this study was challenged to fill in the following research gaps and thereby produced significant academic and practical contributions to this area of research:
4
1995). This research area has never been substantially explored in flood risk assessment studies.
The linkage between descriptive and prescriptive modelling techniques is presented in Chapters 3, 4 and 6.
2. The pigeon-hole approach has been the common method of analysing infrastructure exposure to flood hazards which separately analyses risk for different types of infrastructure (e.g. water, electricity, sewerage, etc.). An infrastructure asset is said to be critical if its disruption would cause social inconvenience. This study introduced an integrated approach of analysing infrastructure risk to damage due to flooding (in general) and identifying critical interdependent infrastructure assets (in particular) that are exposed and vulnerable to flood hazards. Infrastructure interdependency refers to the networks of infrastructures wherein the performance of one relies on the other (Collins et al. 2011). The critical infrastructures analysed in this study were electricity, water supply, sewerage, stormwater, roads and rails, and building properties. They were selected based on the availability of spatial information. Chapter 5 identifies the ways and discusses the means of addressing the issue.
3. Finally, the spatial modelling to find optimal decisions for disaster risk reduction by setting the problem as Markov decision process was also examined in this study – an approach that has not been comprehensively studied to support the natural disaster risk reduction efforts. This is also fully discussed in Chapter 6.
1.3 Research Objectives
The aim of this study was to investigate the vulnerability and interdependency of urban community’s critical infrastructures using an integrated approach of flood risk and climate adaptation capacity assessment in conjunction with newly developed spatially-explicit analytical tools.
Specifically, the objectives of this study were the following:
1. To develop a comprehensive set of flood risk and climate adaptation capacity metrics as inputs for modelling natural disaster risk reduction and climate adaptation strategies;
2. To assess the vulnerability of an urban community and its critical interdependent infrastructures exposed to flood hazard for the development of integrated climate adaptation strategies; and
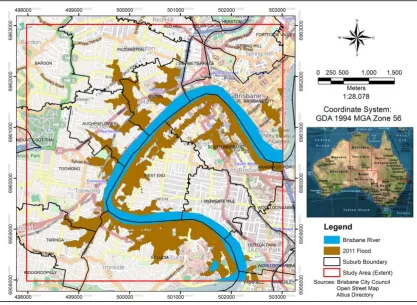
5 1.4 Location of the Study Area
The study area is located in the core suburbs of Brisbane City, the Queensland’s capital in Australia (see Figure 1.1). The City is traversed by the 345-kilometer long Brisbane River, which is the longest river in South East Queensland and flows down from Mount Stanley to Moreton Bay (Middelman 2002). Including the Lockyer Creek and Bremer River catchments, around 6,500 km2 (approximately 50%) of the Brisbane River catchment is below Wivenhoe and Somerset Dams (Robinson 2011). Completed in 1984, the Wivenhoe Dam was built as a dual-purpose storage for both drinking water (which supplies water to the City) and flood mitigation (SEQ Water 2012).
[image:27.595.117.535.392.697.2]Described as Australia’s New World City with strong economic growth, Brisbane City had an $85 billion economy in 2011, almost half of the State economy (BCC 2011). However, the Brisbane’s economic progress together with more than a million estimated residents, had been hampered and devastated recently by 2010/2011 floods. In January 2011, the Brisbane River broke its banks and inundated the city (Queensland Museum 2011). Flood waters in Brisbane peaked at 4.46 metres making it one of the worst floods since the January 1974 flood when Brisbane River reached 5.45 metres (BOM 2013). The flood caused significant damage on the City’s infrastructures, assets, transport, waterways, and community areas with an estimated damage bill in excess of $440 million (BCC 2012b).
Figure 1.1 The location map of the study area
6
Paddington, Bardon, St. Lucia, and Dutton Park, etc.. The extent of this study area was chosen based on available high resolution LiDAR dataset.
On the South Brisbane side, the study area is home to major cultural attractions and art galleries, Australia’s only beach in a city, Brisbane’s best restaurants and cafes, and one of the East Queensland’s most popular tourist destinations. Aside from offering tourism services to an estimated 10 million people each year, the area is devoted to several land uses such as recreation parks, commerce and business, industry, education, residential, cultural centres and museum, State Library of Queensland, among others (South Bank Corporation 2012). Within the CBD, the centre takes the role of the Queensland’s principal vicinity for business and administration complemented by retailing, entertainment, education, community and cultural facilities, tourism and residences (BCC 2010).
1.5 Overview of Research Methods
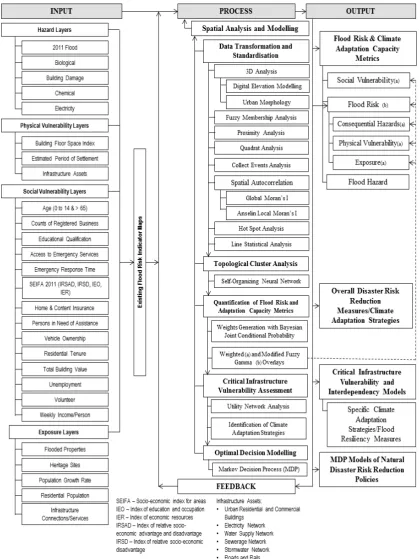
This study developed an integrated approach of formulating climate adaptation strategies to reduce vulnerability of an urban community and infrastructure assets from floods and the long-term effects of extreme climatic events. Figure 1.2 is the input-process-output (IPO) model specifically used in this study. Highlighted in the figure were data inputs used, processes involved, and the outputs generated from the comprehensive analysis. Under the input component, the flood hazard, vulnerability, and exposure indicators were assessed (also see Table 3.1). Under the process component, four (4) main GIS operation challenges were addressed to generate the flood risk and adaptation capacity metrics. The first challenge was to identify analytical tools with ArcGIS 10 (ESRI 2011) that will transform indicating variables (i.e. indicators that describe observable variables) for flood hazard, vulnerability, and exposure into standardised raster formats. The digital elevation modelling and urban morphological characterisation with 3D analysis, spatial analysis with fuzzy logic, proximity, quadrat, collect events analyses, hot spot and line statistical analyses were primarily operationalised. Each of this preliminary analytical technique was used according to the type of geographic feature being represented by the indicating variable (Table 3.1).
This study was also challenged to apply the spatial autocorrelation techniques with emphasis on Global Moran’s I and Cluster and Outlier Analysis of Anselin Local Moran’s I. These techniques were applied to measure the dispersion of urban development, critical infrastructures, emergency services, and flood-related hazards that suggest a measure of perceived level of flood risk in an urban community. The application and conceptualisation of these techniques are a challenging task considering that direct interpolation techniques of point data, for example, renders inaccurate results in clustering highly vulnerable infrastructures. The initial outputs generated from the spatial autocorrelation analyses were then summarised in raster using the Inverse Distance Weight (IDW) method of point data interpolation. The generated raster maps were then carefully analysed to assign categorised values for each indicating variable that generally explain perceived level of flood risk.
7
by creating transformation algorithm of the raster maps in MATLAB version R2011b program (The Mathworks, Inc. 2013) and analysed the topological clusters of these indicating variables using the self-organising neural network (SONN) mapping tool. Selection was then made as to which of the indicating variables were included in the weighted overlay operations.
The third challenge was to address the limitations of deductive and normative arguments in climate risk assessment. As such, varying degrees of importance (unequal weights) of indicating variables were generated using Bayesian probability. These probability values were used in the weighted overlay operations in generating consequential hazard, physical vulnerability, and exposure indices. These indices were in turn used in calculating the flood risk metrics using the modified fuzzy gamma function. Applying Equations 3.1 to 3.6, the flood risk and climate adaptation capacity metrics were generated.
8
9 1.6 Scope and Limitation of the Study
The study was scoped based on several considerations: availability of spatial datasets, single flood event (i.e. January 2011 flood), and strategic locations of significantly flooded critical interdependent infrastructures in an urban community (i.e. Brisbane City). The rationale and key considerations in the way how this study was scoped were based on the recommendations of Queensland Floods Commission of Inquiry to look at solutions to limit the consequences of infrastructure failure from severe weather events like the January 2011 flood in Brisbane. As a very topical and significant issue, the Commission was established by the State government of Queensland to investigate into what had happened during the December 2010-January 2011 floods in south east region of the state and provide recommendatory actions to increase Queensland’s resiliency from flooding. The information from this inquiry based on actual flood events gave this study an opportunity to bring GIS and remote sensing as tools to help find the solutions. A variety of limitations can be identified in this study. The most obvious one is the extent of the study area. Its selection was approached on the basis of availability of high resolution LiDAR data. Ideally, flood risk assessment should be done through the ecosystem approach either on the basis of flood plain or catchment area. However, none of this approach was considered due to the absence of a wider LiDAR coverage to scope the entire flood plain or catchment area.
The second limitation is the absence of temporal analysis of flood risk. Due to unavailability of data which relate to historical extreme flood events, this study opted to settle on a single flood event data particularly the actual extent of the January 2011 flood. Furthermore, due to complexity and unfeasibility to “predict” the future conditions of Brisbane City and its critical interdependent infrastructures in the future, the climate change factors for assessing future flood risk in the study area were also excluded in the analysis. Hence, the absence of temporal dynamics of flood risk is acknowledged in this study.
To fully assess the vulnerability of the study area and its critical infrastructures, ICT infrastructure, broadband, gas storage and distribution, ports and airports, food supply, waste, financial, and other networked infrastructures were desired to be included in the analysis. However, the availability and the confidentiality of some datasets hindered to include them in the analysis.
Furthermore, the effect of integrating hydrologic and hydraulic analysis in the flood risk assessment has also been disregarded in this study. Instead of using them as tools in flood risk assessment, it was assumed that the actual flood extent could provide better and accurate modelling information.
Finally, the assumptions associated with the variables in setting the Markov decision processes (MDP) were mainly based on existing literature; hence, no actual experimentation was performed.
10 1.7 Organisation of the Thesis
This thesis is organised into seven chapters with schematic representation shown in Figure 1.3.
The First Chapter presents the introductory background to the research, poses the research problems and significance, and sets out the objectives.
The Second Chapter reviews the areas of knowledge that are relevant to this study: geographic information system (GIS) and natural disaster risk assessment. The use of spatial layers in flood risk and climate adaptation capacity assessments is discussed along with critical infrastructure interdependency modelling and optimising disaster risk reduction policies. In a nutshell, this Chapter provides the nexus amongst the flood risk, climate adaptation capacity, critical infrastructure interdependency, and disaster risk reduction policies of the examined urban community.
Chapter 3 describes the spatial analytical tools that were utilised to transform and standardise flood risk and climate adaptation capacity indicating variables. This
Chapter serves as the “gateway” to Chapters 4, 5 and 6. Chapter 4 covers the development of flood risk and climate adaptation capacity
metrics through the applications of Self-Organising Neural Network (SONN), Bayesian joint conditional probability, weighted overlay, and fuzzy gamma overlay techniques in GIS.
The Fifth Chapter covers the methods of assessing the vulnerability of critical infrastructures along with interdependency analysis. The specific and integrated climate adaptation strategies to increase climate resiliency of the study area and its critical infrastructures are also discussed.
11
Figure 1.3 The schematic layout of the Thesis Introduction
What is flood risk assessment? What is climate adaptation capacity? How to assess flood vulnerability of urban community and its critical infrastructures? How to identify optimum policy for natural
disaster risk reduction? How can GIS be used in solving those issues to benefit an urban community?
Transforming and standardising flood risk and climate adaptation capacity indicating
variables through the application of spatially-explicit analytical tools
Developing the flood risk and climate adaptation capacity metrics for the urban
community and critical infrastructures
Assessing the vulnerability of urban community and critical infrastructures for
interdependency analysis and flood risk reduction/climate adaptation measures
Finding the optimal natural disaster risk reduction measures
Conclusions and recommendations
Chapter 1 Setting the scene
Chapter 2
Chapter 3
Chapter 4
Chapter 5
Chapter 6
Chapter 7
Literature review
Implementing spatially-explicit
analytical tools
Quantifying flood risk and climate adaptation
capacity
Developing critical interdependency
models and identifying climate adaptation measures
Optimum decision modelling
12 Chapter 2
LITERATURE REVIEW
The first Chapter presented the overall framework on the potential use of GIS and remote sensing in the natural disaster risk management. This second Chapter is a review on the relationships of various factors affecting the flood risk and climate adaptation capacity assessments of urban community and critical infrastructures. Furthermore, this Chapter establishes the niche for disaster risk reduction and climate adaptation, as well as the relevant sciences and technologies of GIS and remote sensing. In summary, Chapter 2 provides the journey towards exploring the relationship of the three major components of this study: (1) flood risk-climate adaptation capacity assessments; (2) vulnerability assessment of critical infrastructures and their interdependencies; and (3) identification and analysis of natural disaster risk reduction measures.
2.1 Overview of the Climate System
As a complex system, the Earth’s climate is controlled primarily by the exchange and storage of heat through the atmosphere, ocean, and biosphere (Dai et al. 2001; Whitfield et al. 2010). Once any of the components are changed, it may give rise to change in the climatic conditions on different scales of time and in different ways (Bradley 2015). For example, the equatorial location of the tropical rainforest and high sun angles all throughout the year make the tropical region high in terms of annual temperatures with very little seasonal variation (Ritter 2006). In the late 1970s, the atmospheric science community had begun reporting on the potential for a warming of the global climate as a result of increased gaseous pollutants released into the atmosphere (Changnon 1995).
13
2.2 Climate and Climate Change in Australia and Queensland
As a large island continent in the southern hemisphere, Australia has a diverse range of climate zones characterised by the following (BOM 2011):
• The northern part, interior, and southern part of the continent has tropical, arid, and temperate climatic conditions, respectively;
• The country is a relatively arid country with 80% of the land receiving 600 mm annual rainfall and 50% receiving less than 300 mm.
• The south eastern coastal cities are characterised as wetter zone – where most Australians are living.
A country that is very vulnerable to the effects of climate change, Australia’s climatic conditions had been altered significantly. Since 1910, the average temperature of the country has risen by 1°C and estimated to face the following by 2030 (DCCEE 2011):
• a further 1°C of warming in temperatures;
• up to 20 % increase in drought;
• up to 25 % increase in the days of very high or extreme fire danger; and
• increase in storm surges and severe weather events.
In Queensland, the climatic conditions across the area are considerably varied as summarised in the following Table (BOM 2011).
Table 2.1 The Queensland’s climatic conditions
Geographic Location Climatic Condition Inland west Low rainfall and hot summers
North Monsoon season
Coastal strip Warm temperate
Southern ranges Low minimum temperatures
The warm waters of the Coral and Tasman Seas influence the climate of the coastal strip with an annual median rainfall ranging from 1000 to 6000 mm increasing to over 3200 mm along parts of the northern coast (BOM 2011). In coastal regions, tropical cyclones (from November to May) are a natural hazard (BOM 2011).
In a report released by the Queensland’s Office of Climate Change in 2008, the following key findings were emphasised (Whitfield et al. 2010):
• Year 2000-2009 was the hottest on record with temperatures 0.58oC higher than the 1961-1990 average;
• Queensland regions can expect increased temperatures of between 1.0oC and 2.2oC by 2050;
• Rainfall is expected to change, with a potential decrease by up to seven per cent (7%) in central Queensland by 2050;
• A three to five per cent (3-5%) decrease in rainfall in the south-east Queensland region is projected; and
• Sea levels are rising faster than expected.
14
Australia has historically been impacted by various flood disasters and recently the December 2010 to January 2011 floods in south east Queensland. Floods are estimated to be the most costly natural disaster in Australia (Geoscience Australia 2011). The average direct annual cost of flooding between 1967 and 1999 has been estimated at $314 million. The most costly flood was recorded in 1974 amounting to $2.9 billion (Geoscience Australia 2010); which has been, however, superseded by the 2010/2011 Queensland floods.
2.3 Floods in Queensland and other Australian States
Were the December 2010 to January 2011 floods in south east Queensland caused by anthropogenic climate change?
In an interview of ABC Radio National with Stewart Franks, a hydrologist from the University of Newcastle, the latter described that extreme climatic events in Eastern Australia were associated with El Niño and La Niña events (Franks 2011). These events tended to cluster into what referred as the multi-decadal epochs of climate variability such that during these periods, El Niño may be dominant bringing droughts between 20 to 40 year periods and subsequently replaced by La Niña events for another 20 to 40 year periods leading to a marked increase in flood risk (Franks 2011). Furthermore, the warm El Niño events are associated with below average rainfall and higher than average temperatures and evaporation, whereas the cool La Niña events typically deliver enhanced rainfall totals and cooler than normal conditions demonstrated that year-to-year flood (and drought) risk varies significantly and that this variability was closely related to El Niño/Southern Oscillation (ENSO) (Kiem et al. 2006).
In another view, however, opposite scientists argue that although the global atmospheric warming of about 0.75oC over the past century had some impact, there is no strong reason at the moment to say that La Niña is stronger or worse than it would even without humans (Birsel 2011). Whether the 2010/2011 floods in Queensland and other floods in Australia were caused by climate change or ENSO phenomenon, these were the significant things that are certain - that the flood hazards considerably affected and shaped the economy and history of Australia in general and Queensland in particular as summarised in Table 2.2.
Table 2.2 Flood events in Queensland and other Australian States from 1899 to 2011
Year Flood Event Description
1899 On 04 March 1899, a category 5 cyclone, named Cyclone Mahina, was one of the Australia’s recorded worst natural disasters. Winds reached 260 kilometres per hour that caused tsunami of 14.6 metres. The cyclone swept the inland of Queensland for 5 kilometres. Four hundred (400) people lost their lives. Some sharks and dolphins were left hanging from trees and cliffs (State Library of Queensland 2010).
1918 During the early 1918 (January), Mackay Cyclone was the first two cyclones that inflicted heavy damage on significant population centres in northern Queensland. Thirty (30) people lost their lives mainly from Mackay and Rockhampton due to devastating winds, and storm surge. The phenomenal amount of rainfall (1,411 mm) that lasted for three days generated the worst flood in Mackay’s history (ABS 2008).
15
Year Flood Event Description
rains, and over 1,000 houses in Launceston were inundated (ABS 2008).
1955 Moving south from Queensland, a monsoon depression deposited the 250-mm rainfall in 24 hours in the Hunter, Macquarie, Namoi and Gwydir River Valleys. The floods lost 14 lives and 15,000 people were evacuated. The flood disaster completely submerged houses and damaged various infrastructure assets like bridges, roads, railways and telephone lines (ABS 2008).
1974 The year 1974 brought devastations in the areas of Brisbane and Darwin. In January, Brisbane was got flooded due to heavy rain from Cyclone Wanda. The 580-mm rainfall in Brisbane and 1,300-mm rainfall at Mt. Glorious made the rivers rose at the highest levels, washed away many houses, and unfortunately killed 14 people (ABS 2008).
In December of the same year, Cyclone Tracy brought devastating floods in Darwin. Most buildings were totally destroyed and badly damaged due to extremely fierce winds. Sixty five (65) people died and the remaining population was evacuated. It was then that building codes and aspects of disaster planning were given much attention (ABS 2008).
1975 Since 1910, 48 cyclones have caused gale-force winds at Port Hedland. On the average, a cyclone visited the area once for every two years usually from mid-December to April peaking in February. Cyclone Joan in 1975 had the strongest wind gust recorded at Port Hedland measuring 208 km/h (ABS 2008).
1999 The strong and slow moving upper level trough undercut by cool south-easterly winds caused persistent heavy rainfall in the Esperance region for few days. This climatic event made the area significantly flooded. Rainfall record reached 209 mm - the heaviest rainfall event since rainfall records began in 1899 (ABS 2008).
2006 Carrying gale-force winds of up to 290 km/h, category 5 Cyclone Larry smashed into the far-north Queensland coast. The cyclone significantly uprooted trees, lifted roofs of houses and flattened crops on the 20th of March 2006. The estimated loss of infrastructure and crops between the areas of Babinda and Tully was at $500M. Larry caused a significant storm surge with inundation record as high as 4.9 metres above the expected at Bingil Bay. Mulgrave, Tully, Murray Rivers and Gulf Rivers were similarly flooded caused by rainfall associated with cyclone (ABS 2008).
2007 Between the 8th and 11th of June 2007, the regions of Hunter and Central Coast of New South Wales were lashed with torrential downpours and gale-force winds. Flash floods urged thousands of residents to abandon their homes. Consequently, a section of Old Pacific Highway collapsed and electric powers were cut. The three-day wild storms lost nine (9) lives on the record.
In July 2007, Victoria’s Gippsland was under the state’s worst flood in a decade. Homes, businesses and farms were significantly lost amounting to millions of dollars. The rising flood waters caused by 48-hour torrential rains urged the residents for rescue and evacuation (ABS 2008).
2010-2011
From December 2010 to January 2011, a series of floods hit Australia, particularly in the state of Queensland, with three quarters of the state declared a disaster zone with over 2.5 million people affected (QRA 2011). Areas like Brisbane City, Rockhampton, Emerald, Bundaberg, Dalby, Toowoomba and Ipswich were devastated by floods. During the early hours of Christmas Day of 2010, a category 1 Tropical Cyclone Tasha brought significant rain in the broad area of northern Queensland. Thirty-five (35) people died, 29,000 homes and businesses suffered from inundation, and flood damaged the region with an estimated amount of over $5 billion (QFCI 2011).
16 2.4 Flood Risk Assessment
A potentially damaging phenomenon (i.e. flood hazard) is considered a disaster when it brings damage, loss or destruction to the socio-economic system of populated areas (Westen2002). A methodology that is meant to determine the nature and extent of risk by analysing the potential hazards and evaluating the conditions of vulnerability and potential it may cause to people, property, services, livelihoods and the environment is termed as risk assessment (UNISDR (2009). In various risk assessment studies, protection of people and assets has been the primordial concern.
2.4.1 Risk components and its relationship
The highly recognised expression of risk is represented by Crichton’s (1999) three-dimensional pyramid which comprises of three elements: hazard, vulnerability, and exposure. If any of these elements increases or decreases, the risk increases or decreases, respectively; hence, the greater the contribution of one of the factors, the greater the risk there would be (Dwyer et al. 2004) as shown in the following Figure. As the colour of the pyramid gets from being red to green, the risk level decreases.
Figure 2.3 The Crichton’s (1999) risk triangle/pyramid after Dwyer et al. (2004)
Fundamental in understanding the risk assessment process is to understand what is meant by the term risk. Risk is defined as the combination of the probability of an event and its negative consequences (UNISDR 2009). Whilst engineers tend toward quantitative expressions of risk such as cumulative frequency plots; a corporate risk manager defined the term as a pertinent event for which there is a textual description (Koller 2007). Thus, in this research, risk is proposed to be perceived as a social construct and contextual notion (Jonkman 2007) taking into consideration who contextualises the notion, when and where it has been contextualised, how and for what purpose it has been contextualised.
17
Risk can either be classified as (Mirfenderesk and Corkill 2009):
1. Existing risk that applies to existing buildings and development on flood-prone area and refers to the risk a community is exposed to as a result of its location on the floodplain;
2. Future risk refers to the risk a community may be exposed to either as a result of new development on the floodplain or change in environmental forces as a result of climate change; and
3. Residual risk refers to the risk remaining after mitigation. UNISDR (2009) similarly refers this risk that remains in unmanaged form, even when effective disaster risk reduction measures are in place, and for which emergency response and recovery capacities must be maintained.
In the absence of sufficient and reliable data on future and residual risks in relation to the flooding events within the study area, this study mainly focused on existing or current flood risk.
The number of assets (e.g. people, property, systems and other elements) present in hazard zones that are subject to potential losses is termed as exposure (UNISDR 2009). In a broader sense, assets are understood to include productive assets (e.g. human, natural, physical, and financial assets); social and political assets (e.g. voting rights, community participation, etc.); and geographical assets (e.g. location of household, population centres, markets, etc.) (Heltberg et al. 2008).
Equally important in understanding the concept of asset is how people weigh its significance, such that an asset is said to be critical if its disruption would cause social inconvenience. These include primary physical structures, technical facilities and systems which are socially, economically or operationally essential to the functioning of a society or community, both in routine circumstances and in the extreme circumstances of an emergency (UNISDR (2009). For the purpose of this study, infrastructure assets refer to the interrelated built, institutional and environmental systems and services (Jollands et al. 2006) of an urban community. When a dangerous phenomenon, substance, human activity or condition potentially damages property or causes loss of life, injury or other health impacts, or environmental damage (UNISDR 2009), that danger brings the system into a hazard condition. Phenomena like droughts, floods, storms, episodes of heavy rainfall, and any other physical manifestations of climatic variability or change are some examples of climatic-related hazard (Brooks 2003). In harmonising UNISDR’s (2009) and Brooks’ (2003) interpretations, it seems apparent that both are intended to mean hazards as either physical or social manifestations of a phenomenon that may cause an undesirable outcome.
18
social system, or a subsystem of a system such as infrastructure system within an urban ecosystem, or the human-environment interactions and social-ecological system.
Interestingly, Geoscience Australia (2010) conceptualised vulnerability as the impact a hazard has on the people, infrastructure, and the economy. When we characterise a vulnerable human being as: 1) capable of being physically, emotionally or spiritually wounded; 2) open to attack or damage (physical, emotional, or spiritual); and 3) lack in defence or support mechanisms (at the levels of government; community; household; and individual) (Schneiderbauer and Ehrlich 2004), then the term vulnerability is analogous to any individual or social grouping that is determined by their capacity to respond to a hazard, rather than by what may or may not happen in the future (Kelly and Adger 2000).
A variety of research in this area espoused a risk-based approach (Merz et al. 2010, Aronica et al. 2012) to identify spatial patterns of flood risk associated with hazard, vulnerability, and exposure (Kazmierczak and Cavan 2011). Researchers approached their methods and constructs to their analyses in different ways (Boholm 1998) and yet flood risk experts and decision makers still face the challenge of finding techniques and measures to effectively cope with flood hazards (Kellens et al. 2013).
The concepts associated with flood risk assessment were useful in this study particularly on the choice of indicating variables, parameters, and risk classification. For example, the term hazard was associated to the January 2011 flood that caused danger to the study area and its consequential hazards such as biological, chemical, building damage, and electricity hazards. Thus, the concept of hazard was considered in this study being not solely and directly attributed to the flood phenomenon but also its consequences that aggravated the danger.
Furthermore, social vulnerability was referred in this study as the political and socio-economic circumstances (e.g. index of education and occupation, insurance, number of emergency volunteers, etc.) that allowed the urban community to withstand the hazards. Sets of information such as building size, height, settlement growth, and number of critical infrastructure assets were also relevant in determining the physical vulnerability (Deichman 2011) and exposure of the study area.
Finally, in the absence of sufficient and reliable data on future and residual risks in relation to the flooding events within the study area, this study mainly focused on the existing or current flood risk type of classification.
2.5 Climate Adaptation Capacity