0022-538X/08/$08.00⫹0 doi:10.1128/JVI.01819-07
Copyright © 2008, American Society for Microbiology. All Rights Reserved.
Proteomic Studies Reveal Coordinated Changes in T-Cell Expression
Patterns upon Infection with Human Immunodeficiency Virus Type 1
䌤
†
Jeffrey H. Ringrose,
1‡ Rienk E. Jeeninga,
1Ben Berkhout,
1and Dave Speijer
2*
Laboratory of Experimental Virology, Department of Medical Microbiology, Center for Infection and Immunity Amsterdam,1
and Clinical Proteomics Group, Department of Medical Biochemistry, Academic Medical Center,
University of Amsterdam,2Amsterdam, The Netherlands
Received 19 August 2007/Accepted 8 February 2008
We performed an extensive two-dimensional differential in-gel electrophoresis proteomic analysis of the cellular changes in human T cells upon human immunodeficiency virus type 1 (HIV-1) infection. We detected 2,000 protein spots, 15% of which were differentially expressed at peak infection. A total of 93 proteins that changed in relative abundance were identified. Of these, 27 were found to be significantly downregulated and 66 were upregulated at peak HIV infection. Early in infection, only a small group of proteins was changed. A clear and consistent program of metabolic rerouting could be seen, in which glycolysis was downregulated and mitochondrial oxidation enhanced. Proteins that participate in apoptotic signaling were also significantly influenced. Apart from these changes, the virus also strongly influenced levels of proteins involved in intra-cellular transport. These and other results are discussed in light of previous microarray and proteomic studies regarding the impact of HIV-1 infection on cellular mRNA and protein content.
Human immunodeficiency virus type 1 (HIV-1) infection influences many physiological processes in the infected indi-vidual, ultimately leading to the development of AIDS. In order to replicate efficiently, the virus has to adapt the intra-cellular metabolism of the host cell. With the help of its ac-cessory proteins, HIV-1 is able to alter many physiological aspects of both the infected cells and the organism as a whole (17, 39, 47). HIV-1 disturbs immune responses, changes in-fected cells so that it can survive and persist, and prepares the cells for production and release of new viral particles. The intracellular processes influenced by HIV infection have been the subject of intense research, including studies that focus mainly on the role of HIV-1 accessory proteins in these pro-cesses and more general studies using microarrays to detect mRNA changes in the cell (11, 16, 42, 51). The proteome changes, however, have only recently begun to be studied in detail (9).
Coordinated gene expression patterns characterize cell types and specific cellular responses. Changes are often accompa-nied by coordinated protein modifications. A gene only en-codes the amino acid sequence of a protein product, which can exist in many different isoforms with different functions. Thus, a relatively limited number of genes can give rise to an enor-mous number of functionally distinct proteins (23). This is for the most part achieved by posttranslational protein
modifica-tion (PTM). PTM provides cells with very agile systems to adapt swiftly to changing environments, e.g., as exemplified by the key role of protein phosphorylation in signal transduction or intracellular transport. Such PTM responses, however, can-not be directly detected using DNA technologies. Indeed, there often seems to be a discrepancy between experimental results based on analysis of products of transcription versus translation (40). Therefore, proteomic studies of many pro-teins using techniques that can detect subtle differences in protein expression and discriminate between different protein isoforms are crucial for the characterization of the multitude of intracellular responses to HIV infection (51). Proteomic stud-ies can thus give rise to new insights that can eventually lead to new intervention strategies.
In this study, we used the fluorescence two-dimensional dif-ferential in-gel electrophoresis (2D-DIGE) technique to com-pare the differences between uninfected and HIV-1-infected T cells. The DIGE technique is based on protein labeling with cyanine-based fluorescent probes and subsequent 2D gel elec-trophoresis to quantify changes in protein expression (1, 50). Identities of differentially expressed proteins were subse-quently determined by matrix-assisted laser desorption mass spectrometry. We found general correlations at the protein level with results from previous studies using microarray-based techniques (11, 16, 42, 51). Using annotated databases, we identified classes of proteins and general pathways that are altered upon HIV infection. This proteomic approach con-firmed at the protein level several HIV-1 effects on pathways and processes that previously have been described using other techniques (9). Furthermore, it allowed us to reinterpret and extend earlier findings, identifying additional processes hith-erto only suspected to be involved in HIV infection.
MATERIALS AND METHODS
Cells and viruses.C33A cervical carcinoma cells (ATCC HTB) (31, 2) were grown as a monolayer in Dulbecco’s minimal essential medium supplemented * Corresponding author. Mailing address: K1-262, Academic
Med-ical Center, University of Amsterdam, ClinMed-ical Proteomics Group, Medical Biochemistry, Meibergdreef 15, 1105 AZ Amsterdam, The Netherlands. Phone: 310205665134. Fax: 310206915519. E-mail: [email protected].
† Supplemental material for this article may be found at http://jvi .asm.org/.
‡ Present address: Department of Biomolecular Mass Spectrometry, Utrecht University, Sorbonnelaan 16, 3584 CA Utrecht, The Nether-lands.
䌤Published ahead of print on 20 February 2008.
4320
on November 8, 2019 by guest
http://jvi.asm.org/
with 10% (vol/vol) fetal calf serum (FCS), 100 U/ml penicillin, 100g/ml strep-tomycin, 20 mM glucose, and minimal essential medium nonessential amino acids at 37°C and 5% CO2. The cells were transfected by the calcium phosphate
method as described previously (13).
The human T-lymphocyte cell line PM1 (31) was cultured in advanced RPMI 1640 (Gibco BRL, Gaithersburg, MD) supplemented with 1% (vol/vol) FCS, 20 U/ml penicillin, and 20g/ml streptomycin at 37°C and 5% CO2.
HIV-1 infections were performed with C33A-produced virus stocks of the HIV-1 LAI molecular clone (38). For peak-infection analysis, infection was started with virus corresponding to 500 ng CA-p24 in a 20-ml cell culture. Cells were maintained and increased to 250-ml cultures with around 50 to 90 million cells. The infection grade was monitored by fluorescence-activated cell sorter (FACS) analysis, and the cells were harvested if at least 85% of the cells were positive for intracellular CA-p24 (7 to 10 days). For the massive 42-h infections, around 50 to 90 million uninfected cells were collected by centrifugation (5 min, 400⫻g) and resuspended in the supernatant from the peak-infection culture. These infections were maintained for 42 h before harvesting of the cells. Aliquots were taken for intracellular CA-p24 FACS staining and supernatant CA-p24 enzyme-linked immunosorbent assay (ELISA).
Sample preparation.Cells were harvested by centrifugation (5 min, 400⫻g), washed once with 50 ml phosphate-buffered saline (PBS) (Gibco), and resus-pended in 1 ml PBS. The cell suspension was transferred to a 2-ml Eppendorf tube and the cells collected by centrifugation (4 min, 4,000 rpm, Eppendorf centrifuge). The cell pellets were lysed at a ratio of 107cells in 50l of lysis buffer
(30 mM Tris buffer [pH 8.5] containing 7.7 M urea, 2.2 M thiourea, 4% CHAPS {3-[(3-cholamidopropyl)-dimethylammonio]-1-propanesulfonate; Sigma}, and 2 mM dithiothreitol [DTT]). Protein concentrations were determined using the 2-D Quant kit according to the manufacturer’s instructions (GE Healthcare), and protein concentrations were adjusted in lysis buffer to a final concentration of 1.5 mg/ml.
CA-p24 internal staining and FACS analysis.Flow cytometry was performed with RD1 or fluorescein isothiocyanate-conjugated mouse monoclonal anti-CA-p24 (clone KC57; Coulter). Cells from a 1-ml culture sample were collected (4 min, 4,000 rpm, Eppendorf centrifuge) and fixed in 250l 4% formaldehyde for 5 min at room temperature. The cells were washed with 500l BD Perm/Wash buffer (BD Pharmingen) and stained for 30 min at 4°C in 20l of BD Perm/Wash buffer and 5l of the appropriate antibody (1 in 100 diluted). Excess antibody was removed by washing the cells with 500l BD Perm/Wash buffer. The cells were collected, and 750l FACS buffer (PBS with 2% FCS) was added. The cells were analyzed on a FACSCalibur flow cytometer with CellQuest Pro software (BD Biosciences, San Jose, CA). Cell populations were defined based on for-ward/sideward scattering and isotype controls (clone MsIgG-RD1; Coulter) were used to set markers.
CA-p24 ELISA.Culture supernatant was heat inactivated at 56°C for 30 min in the presence of 0.05% Empigen-BB (Calbiochem, La Jolla, CA). The CA-p24 concentration was determined by a twin-site ELISA with D7320 (Biochrom, Berlin, Germany) as the capture antibody and alkaline phosphatase-conjugated anti-p24 monoclonal antibody (EH12-AP) as the detection antibody. Detection was done with the Lumiphos Plus system (Lumigen, MI) in a LUMIstar Galaxy (BMG Lab Technologies, Offenburg, Germany) luminescence reader. Recom-binant CA-p24 expressed in a baculovirus system was used as the reference standard.
Protein labeling with DIGE fluorophores.Sixty micrograms of protein sample was labeled according to the manufacturer’s protocol with 3,200 pmolN -hy-droxysuccinimide esters of cyanine dyes (Cy2, Cy3, or Cy5 Cy dye; GE Health-care) for 30 min in the dark on ice. For each experimental time point, six biological replicates of infected and uninfected control cells were Cy dye labeled, including a dye swap so that three replicates of infected and control cells were labeled with Cy3 and Cy5, respectively, and three replicates with Cy5 and Cy3, respectively. An internal standard of 60g protein consisting of combined equimolar amounts of protein from all six biological replicates of infected and control cells was labeled with Cy2. After quenching the labeling reaction with 8l of 10 mM lysine solution (Sigma), the labeled proteins from control cells, infected cells, and the internal standard were mixed together and adjusted to end concentrations of 1% DTT and 1% IPG buffer in a total volume of 150l with lysis buffer.
2D gel electrophoresis.First-dimension isoelectric focusing (IEF) of the sam-ples was performed using 24-cm precast IPG strips (pH 3 to 11, nonlinear [NL]; GE Healthcare). Samples of 150l were applied by anodic cup loading onto the strips that had been rehydrated overnight with 450l rehydration buffer con-taining 30 mM Tris (pH 8.5), 7.7 M urea, 2.2 M thio-urea, 2 mM DTT, 4% CHAPS 0.5% IPG (pH 3 to 11, NL; GE Healthcare), and 1.2% Destreak reagent (GE Healthcare). IEF of all six strips of one experiment containing the six experimental replicates was carried out in parallel with the IPGPhor equipped
with the Ettan Cup loading manifold (GE Healthcare). The strips were focused at 0.05 mA/IPG strip for approximately 55 kV䡠h at 20°C following a stepwise increase to 150 V for 3 h, a stepwise increase to 300 V for 3 h, a gradient to 1,000 V for 6 h, a gradient of 8,000 V for 5 h, a constant step of 8,000 V for 3 h, and a gradient decrease to 500 V for 0.5 h. After IEF, the strips were sequentially incubated in freshly prepared solutions of 1% DTT and 2% iodoacetamide in 50 mM Tris (pH 8.0), 6 M urea, 30% glycerol, and 2% sodium dodecyl sulfate (SDS) for 15 min. The second-dimension SDS-polyacrylamide gel electrophoresis was performed by mounting the IPG strips onto 12% polyacrylamide gels between low-fluorescent glass plates and running the gels in the Ettan Dalt-six electro-phoresis system (GE Healthcare) for 30 min at 45 mA/gel and overnight at 13 mA/gel at 20°C.
Image acquisition and analysis. After 2D electrophoresis, the gels were scanned on a Typhoon Trio image scanner (GE Healthcare) according to the manufacturer’s protocol at 100-m resolution to produce a Cy2, a Cy3, and a Cy5 image for each gel. After cropping with ImageQuant software (GE Healthcare), the images were subjected to automated difference-in-gel analysis and biological variation analysis (BVA) using Decyder version 6.5 software (GE Healthcare).
Protein identification. After the gel images were acquired, the gels were removed from the glass plates, fixed with 50% methanol and 5% acetic acid, and stained with Coomassie brilliant blue R250 in 50% methanol and 2% acetic acid overnight to visualize the protein spots for isolation and subsequent protein identification. Protein-containing gel spots were digested with unmodified trypsin (Roche Molecular Biochemicals, sequencing grade) and extracted as described by Shevchenko et al. (46). Extracted peptides were concentrated using a Speed-vac, and the pellet was taken up in 6l of 1% formic acid and 60% acetonitrile. A 0.6-l portion of the peptide solution was mixed with an equal volume of 10 mg/ml␣-cyano-4-hydroxycinnamic acid (Sigma Chemical Co.) solution in aceto-nitrile-ethanol (1:1, vol/vol) with 1% trifluoroacetic acid and 1 mM ammonium acetate. Before dissolving, the␣-cyano-4-hydroxycinnamic acid was washed briefly with acetone. Then, 1.2l was spotted on target and allowed to dry at room temperature. Matrix-assisted laser desorption ionization–time-of-flight mass spectra were acquired on a Micromass M@LDI (Micromass, Wythen-shawe, United Kingdom). The resulting peptide spectra were used to search a nonredundant protein sequence database (Swiss-Prot/TREMBL) using the Pro-teinprobe program or using the MASCOT search engine and database.
For annotation, GoMiner (http://discover.nci.nih.gov/gominer/), was used as well as searches in the Swiss-Prot (http://www.expasy.org) and Ensemble (http: //www.ensembl.org) databases and PubMed literature (http://www.ncbi.nlm.nih .gov/Literature/).
RESULTS
Experimental setup.To analyze the influence of HIV-1 in-fection on the cellular host, a 2D-DIGE proteomic approach was set up. As the host cells, we used a uniform cell population of the human T-cell line PM1 because these cells do not display syncytium formation upon virus infection, which could induce unwanted secondary effects. PM1 cells were infected with a virus stock of the molecular clone LAI (38).
For protein analysis, uniform samples contribute to sensitiv-ity. This is particularly important for the analysis of virus in-fections in which asynchronous replication and multiple rounds of infection easily can lead to masking of protein changes. On the other hand, single-round infections with rel-ative high virus titers will minimize such masking but will lead to rapid cytopathic effects and may reduce detection of long-term cellular responses. Furthermore, aspecific short-long-term stress responses can affect the results. Therefore, two different time points in an HIV-1 infection were analyzed: one at the peak of infection (around 7 to 10 days after inoculation) and one for which we used a massive amount of virus and harvested the cells after 42 h. Importantly, we did not observe significant differences in amounts of apoptotic cells between infected and uninfected cell populations (as judged by forward and side scatter plots in the FACS analyses) in either of these settings. The peak-infection experiment resembles a spreading
on November 8, 2019 by guest
http://jvi.asm.org/
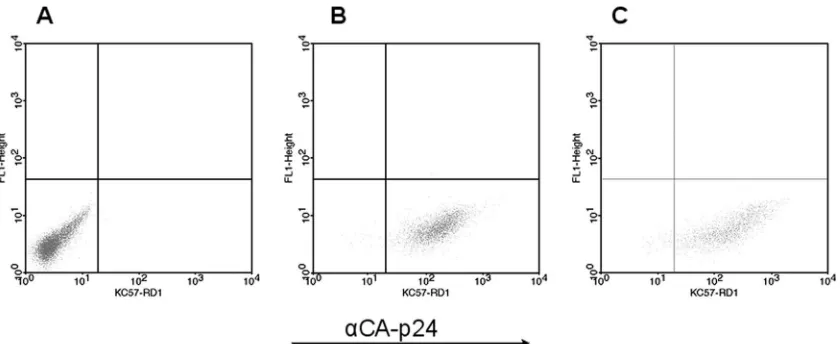
tion and was designed to detect long-term effects of HIV-1 replication. The 42-h infection was used to detect acute infec-tion changes resulting from a massive synchronous infecinfec-tion in a single round of replication. In principle, a comparison of the two experiments would allow us to monitor proteomic changes over time. FACS analyses of PM1 cells with anti-CA-p24 (as an intracellular indicator of viral production) before infection, after 42 h, and at the peak of regular infection are shown in Fig. 1A, B, and C, respectively. This demonstrates that all cells are producing the viral Gag protein.
Proteome changes at peak HIV-1 infection of PM1 cells.To determine accurately which proteins would be differentially expressed at peak infection of PM1 cells we performed DIGE
analysis on six different batches of control cells and six different batches of cells at peak infection. Figure 2 shows a represen-tative Cy2 image of one of the six gels (the master gel). Using the difference-in-gel analysis module of the De-cyder software (GE Healthcare), ratios between expression of proteins in con-trol and infected cells were determined, whereas the biological variance analyses module was used on the six biological repli-cates of control and HIV-1-infected cells to determine which differential expression ratios are considered significant (i.e., to calculate thePvalue).
Out of 1,921 detected protein spots, 288 were designated to be significantly differentially expressed at peak HIV infection using the following criteria.
FIG. 1. FACS analysis of PM1 cells after intracellular staining against HIV-1 CA-p24 without infection (A), at the peak of a regular infection (B), and after 42 h of infection (C). Dot plot analysis with unstained FL1 (yaxis) and anti-CA-p24 fluorescence (KC57-RD1) (xaxis) is shown. For details, see Materials and Methods.
FIG. 2. 2D gel analysis of HIV-1-infected PM1 cells. A representative Cy2 image of a 2D gel of PM1 cells at the peak of a regular infection is shown. First dimension, IEF pH 3 to 11 NL (left to right); second dimension, SDS—12% polyacrylamide gel electrophoresis. For further details see Materials and Methods.
on November 8, 2019 by guest
http://jvi.asm.org/
[image:3.585.138.449.465.695.2]A spot had to be present in at least 9 of the 18 Cy dye images of the peak-infection experiment and changed (up- or down-regulated) at least 1.5-fold with a P value of ⬍0.01 (which applied to 241 spots), changed at least 1.1-fold with aPvalue of ⬍0.001 (adding a further 23 spots), or changed at least 2.0-fold with aPvalue of⬍0.2 (adding a final 24 spots).
Of these 288 differentially expressed protein spots, 106 con-tained enough protein to allow identification by peptide mass fingerprinting. One hundred two protein spots yielded 92 unique proteins, as several proteins were found more than once, and four gel spots contained more than one protein. Of the 92 identified proteins, 27 were significantly downregulated and 65 were upregulated at peak HIV infection. One of the upregulated proteins was identified as the HIV capsid protein CA-p24. In an earlier experiment, we were also able to identify the HIV accessory protein Nef (data not shown). A complete list of all differentially expressed proteins at HIV peak infec-tion with their ratios andPvalues can be found in Table S1 in the supplemental material.
Differentially expressed proteins after single-cycle HIV-1 infection of PM1 cells.At 42 h after massive HIV infection, only 12 protein spots out of 1,955 were designated to be sig-nificantly differentially expressed using the following criteria.
A spot had to be present in at least 9 of the 18 Cy dye images of the 42-h experiment and changed (up- or downregulated) at least 1.5-fold with a P value of ⬍0.01 (which applied to 6 spots), changed at least 1.1-fold with a P value of ⬍0.001 (adding a further 2 spots), or changed at least 2.0-fold with aP value of⬍0.2 (adding a final 4 spots).
We were able to determine the protein identities of nine protein spots by peptide mass fingerprinting, yielding nine unique proteins. Of these nine identified proteins, only one protein was found to be significantly downregulated and eight were upregulated at 42 h after infection. Among the
upregu-lated proteins were the HIV CA-p24 and Nef proteins. Of the six upregulated cellular proteins, five were also identified at peak virus infection (not only the tubulin alpha but also the tubulin beta subunit was found to be upregulated at 42 h). However, the one downregulated protein (DDX3X) was ob-served only in this single-cycle experiment, and the 14-3-3 epsilon protein was upregulated (instead of downregulated as at peak infection). Only 0.6% of proteins that were detected changed in expression level. This further corroborates the ab-sence of apoptosis, as confirmed by FACS analysis. A complete list of all differentially expressed proteins at 42 h of HIV infection with their ratios andPvalues can be found in Table S2 in the supplemental material.
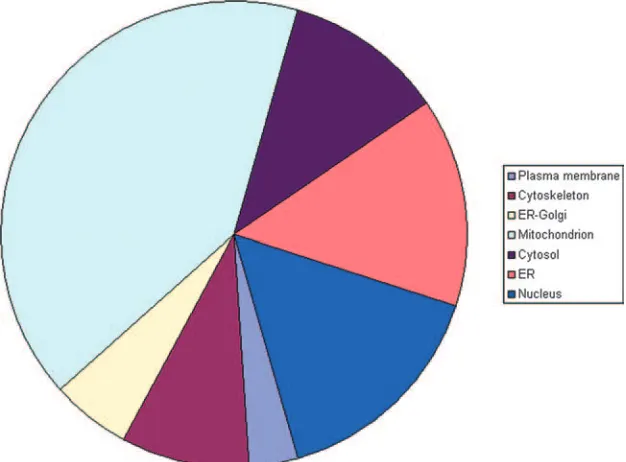
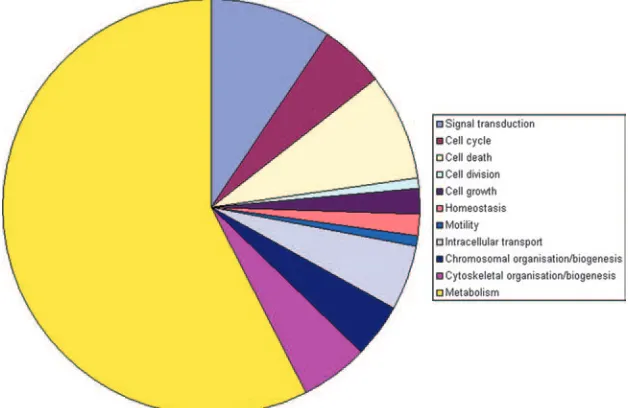
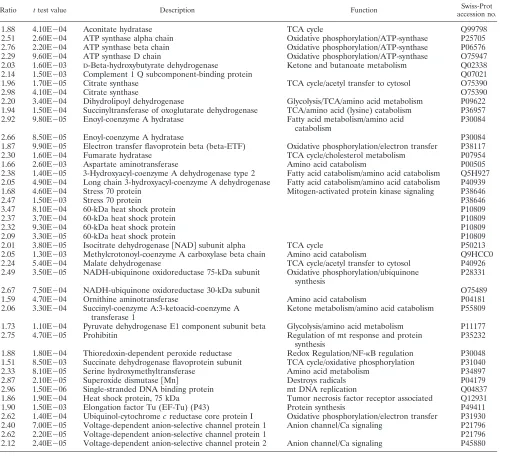
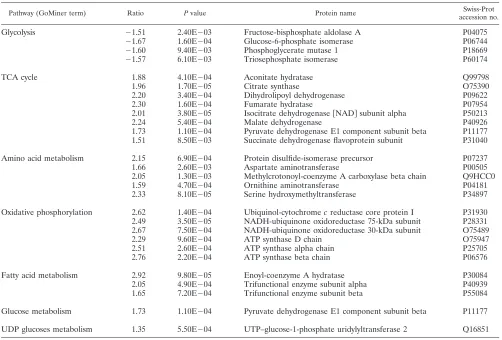
Protein annotation, location, and function. The complete list of proteins was evaluated against the literature and public databases. We were able to assign database accession numbers to all human proteins identified so that all human protein identifications were recognized by GoMiner to perform a gene ontology analysis (57). An overview of the differentially ex-pressed proteins at peak infection, grouped according to gene ontology categories, is given in Table S3 in the supplemental material. This allowed us to rapidly analyze their annotated subcellular location, biological function, and molecular inter-actions. Figure 3 gives an overview of the distribution of the identified proteins over different cellular locations. Figure 4 illustrates the distribution over several main categories of cel-lular processes represented by many of the proteins identified. As can be seen in Fig. 3 and 4, there is a very high proportion of differentially expressed mitochondrial (mt) proteins and a high proportion of differentially expressed metabolic pathway proteins, suggesting that metabolic reprogramming occurs upon HIV infection of the T cell. Table 1 lists the upregulated mt proteins with a short description of their function, which is mainly in the tricarboxylic acid (TCA) cycle, aerobic
respira-FIG. 3. Locations of differentially expressed PM1 proteins. The overall contribution of different cellular locations to the differentially expressed PM1 proteins upon HIV-1 peak infection, as determined using GoMiner, is displayed.
on November 8, 2019 by guest
http://jvi.asm.org/
[image:4.585.136.449.70.301.2]tion, and catabolism of fatty acids and amino acids. Table 2 shows a list of differentially regulated proteins categorized according to major metabolic pathways. Interestingly, all four differentially regulated proteins that are involved in glycolysis are downregulated, whereas all that are involved in other ma-jor metabolic pathways are upregulated. The upregulation of pyruvate dehydrogenase E1 beta (P11177) might seem to con-tradict the downregulation of the glycolytic enzymes, but pyru-vate can also result from amino acid breakdown. One of the specific enzymes leading to the production of pyruvate from these precursors, serine hydroxymethyltransferase, was indeed found to be upregulated (Table 1). Several other enzymes involved in fatty acid oxidation and amino acid catabolism producing substrates for the TCA cycle are upregulated, as well as some of the TCA cycle enzymes themselves. These, of course, provide the substrates for oxidative phosphorylation, and there is a concerted upregulation of proteins involved in this process and thus in the generation of ATP. Many other proteins were found to be differentially expressed upon HIV infection of T cells; the most important ones are highlighted below.
DISCUSSION
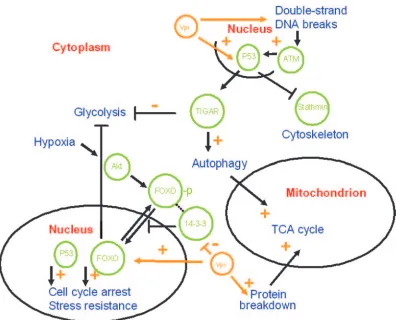
Our proteomic analysis demonstrates that infection of the T-cell line PM1 by HIV-1 gives rise to coordinated changes in protein expression patterns, together representing reprogram-ming of the T cell. In absolute amounts, these changes are less strong than one might have naively expected. However, this result is in agreement with microarray analyses and a recent proteomic analysis of HIV T-cell interactions (9, 34, 52). Such relatively subtle changes in protein levels can be reliably iden-tified by our approach using multiple independent replicates, and this analysis becomes even more convincing given the concerted changes of many proteins within certain metabolic pathways. Metabolic rerouting as shown in Fig. 5 is apparent,
as well as a “tug of war” between host cell and virus with regard to apoptotic signals.
Metabolic rerouting.We observed upregulation of proteins involved in fatty acid oxidation and amino acid catabolism, the TCA cycle, and oxidative phosphorylation. Thus, enzymes in-volved in the generation of ATP from fatty acids (e.g., the beta oxidation trifunctional enzyme alpha and beta subunits) and amino acids are strongly upregulated, which would lead to increased energy production. In striking contrast, all the dif-ferentially regulated proteins that catalyze steps in glycolysis are downregulated: glucose-6-phosphate isomerase, aldolase A, phosphoglycerate mutase 1, and triosephosphate isomerase. HIV apparently induces a metabolic change in the infected cells to decrease energy production from glucose but increases the energy production from amino acids and fatty acids (Tables 1 and 2). That this rerouting represents a highly specific met-abolic program is clear not only from the downregulation of glycolytic enzymes but also from the downregulation of E-FABP, the immune cell-specific fatty acid transport protein that is consistently upregulated in activated immune cells (20). Apart from the specific downregulation of the glycolytic en-zymes, our results agree with the very recent proteomic studies of Chan et al. (9). They describe one enzyme that is (also) involved in glycolysis (pyruvate kinase), which is upregulated. Although they used a totally different technique, similar effects with regard to oxidative phosphorylation, the TCA cycle, and valine, leucine, and isoleucine degradation were observed. However, their findings appear less consistent: indications for a “dysregulated” TCA cycle are presented, and some proteins involved in respiration (such as cytochromecoxidase II) are downregulated.
Several studies have shown effects of HIV on cell metabo-lism. An effect of HIV on glucose metabolism of human intes-tinal epithelial cells was measured (32). HIV infection resulted in a disturbance of glycolytic and oxidative activities. The re-sults indicated an increase in intracellular glucose
concentra-FIG. 4. Gene ontology analyses of differentially expressed PM1 proteins. The contributions of the main cellular process categories represented by differentially expressed PM1 proteins upon HIV-1 peak infection as determined, using GoMiner, are displayed.
on November 8, 2019 by guest
http://jvi.asm.org/
[image:5.585.135.450.71.275.2]tion due to either increased uptake or decreased glycolysis. Glycolytic impairment was detected in neuronal cells upon incubation with HIV gp120 protein only (53). How could “met-abolic rerouting” by the virus be induced at the molecular level? It is known that the retroviral Vpr protein interferes with the suppressive effects of insulin on FOXO transcription factors, which normally stimulate gluconeogenesis by upregu-lating glucose-6-phosphatase and phosphoenolpyruvate car-boxykinase (26). FOXO transcription factors are negatively regulated through phosphorylation by the protein kinase Akt in response to insulin and growth factors and subsequent re-localization from the nucleus into the cytoplasm via interaction with 14-3-3 proteins (25, 26). Vpr is known to interact with 14-3-3 proteins and thus influence their binding specificities. FOXO factors could thus be positively regulated by Vpr, which
[image:6.585.44.552.82.538.2]binds 14-3-3 proteins, allowing FOXO to go to the nucleus. Another way to interfere with nuclear relocalization of certain transcription factors would be downregulation of the 14-3-3 proteins themselves. We indeed find the 14-3-3 gamma, epsi-lon, tau, and zeta proteins to be significantly (all about 1.6-fold) downregulated. The 14-3-3 pathway is also found to be strongly influenced upon HIV-1 infection (9). Besides their role in glucose metabolism, FOXO transcription factors are involved in cell cycle arrest (as are 14-3-3 proteins, mediating Vpr’s cell cycle-arresting activity, e.g., by enhanced binding of Cdc25C [25, 28]), DNA repair, apoptosis, and stress resistance. For instance, FOXO factors stimulate Mn superoxide dis-mutase transcription, and we indeed find it to be upregulated after HIV infection (as would be appropriate given the in-crease in mt oxidation). In muscle cells, repression of FOXO
TABLE 1. mt proteins upregulated upon HIV-1 infection
Ratio ttest value Description Function Swiss-Prot
accession no.
1.88 4.10E⫺04 Aconitate hydratase TCA cycle Q99798
2.51 2.60E⫺04 ATP synthase alpha chain Oxidative phosphorylation/ATP-synthase P25705 2.76 2.20E⫺04 ATP synthase beta chain Oxidative phosphorylation/ATP-synthase P06576 2.29 9.60E⫺04 ATP synthase D chain Oxidative phosphorylation/ATP-synthase O75947 2.03 1.60E⫺03 D-Beta-hydroxybutyrate dehydrogenase Ketone and butanoate metabolism Q02338
2.14 1.50E⫺03 Complement 1 Q subcomponent-binding protein Q07021
1.96 1.70E⫺05 Citrate synthase TCA cycle/acetyl transfer to cytosol O75390
2.98 4.10E⫺04 Citrate synthase O75390
2.20 3.40E⫺04 Dihydrolipoyl dehydrogenase Glycolysis/TCA/amino acid metabolism P09622 1.94 1.50E⫺04 Succinyltransferase of oxoglutarate dehydrogenase TCA/amino acid (lysine) catabolism P36957 2.92 9.80E⫺05 Enoyl-coenzyme A hydratase Fatty acid metabolism/amino acid
catabolism
P30084
2.66 8.50E⫺05 Enoyl-coenzyme A hydratase P30084
1.87 9.90E⫺05 Electron transfer flavoprotein beta (beta-ETF) Oxidative phosphorylation/electron transfer P38117
2.30 1.60E⫺04 Fumarate hydratase TCA cycle/cholesterol metabolism P07954
1.66 2.60E⫺03 Aspartate aminotransferase Amino acid catabolism P00505
2.38 1.40E⫺05 3-Hydroxyacyl-coenzyme A dehydrogenase type 2 Fatty acid catabolism/amino acid catabolism Q5H927 2.05 4.90E⫺04 Long chain 3-hydroxyacyl-coenzyme A dehydrogenase Fatty acid catabolism/amino acid catabolism P40939 1.68 4.60E⫺04 Stress 70 protein Mitogen-activated protein kinase signaling P38646
2.47 1.50E⫺03 Stress 70 protein P38646
3.47 8.10E⫺04 60-kDa heat shock protein P10809
2.37 3.70E⫺04 60-kDa heat shock protein P10809
2.32 9.30E⫺04 60-kDa heat shock protein P10809
2.09 3.30E⫺05 60-kDa heat shock protein P10809
2.01 3.80E⫺05 Isocitrate dehydrogenase关NAD兴subunit alpha TCA cycle P50213
2.05 1.30E⫺03 Methylcrotonoyl-coenzyme A carboxylase beta chain Amino acid catabolism Q9HCC0 2.24 5.40E⫺04 Malate dehydrogenase TCA cycle/acetyl transfer to cytosol P40926 2.49 3.50E⫺05 NADH-ubiquinone oxidoreductase 75-kDa subunit Oxidative phosphorylation/ubiquinone
synthesis
P28331
2.67 7.50E⫺04 NADH-ubiquinone oxidoreductase 30-kDa subunit O75489
1.59 4.70E⫺04 Ornithine aminotransferase Amino acid catabolism P04181
2.06 3.30E⫺04 Succinyl-coenzyme A:3-ketoacid-coenzyme A transferase 1
Ketone metabolism/amino acid catabolism P55809
1.73 1.10E⫺04 Pyruvate dehydrogenase E1 component subunit beta Glycolysis/amino acid metabolism P11177
2.75 4.70E⫺05 Prohibitin Regulation of mt response and protein
synthesis
P35232
1.88 1.80E⫺04 Thioredoxin-dependent peroxide reductase Redox Regulation/NF-B regulation P30048 1.51 8.50E⫺03 Succinate dehydrogenase flavoprotein subunit TCA cycle/oxidative phosphorylation P31040
2.33 8.10E⫺05 Serine hydroxymethyltransferase Amino acid metabolism P34897
2.87 2.10E⫺05 Superoxide dismutase关Mn兴 Destroys radicals P04179
2.96 1.50E⫺06 Single-stranded DNA binding protein mt DNA replication Q04837
1.86 1.90E⫺04 Heat shock protein, 75 kDa Tumor necrosis factor receptor associated Q12931
1.90 1.50E⫺03 Elongation factor Tu (EF-Tu) (P43) Protein synthesis P49411
2.62 1.40E⫺04 Ubiquinol-cytochromecreductase core protein I Oxidative phosphorylation/electron transfer P31930 2.40 7.00E⫺05 Voltage-dependent anion-selective channel protein 1 Anion channel/Ca signaling P21796
2.62 2.20E⫺05 Voltage-dependent anion-selective channel protein 1 P21796
2.12 2.40E⫺05 Voltage-dependent anion-selective channel protein 2 Anion channel/Ca signaling P45880
on November 8, 2019 by guest
http://jvi.asm.org/
activity by Akt signaling induces a decrease in protein degra-dation. Thus, a Vpr-mediated indirect increase in FOXO ac-tivity could lead to enhanced protein degradation, generating substrates for the increased amino acid catabolism that we seem to observe upon HIV infection.
The role of FOXO transcription factors in mediating cell cycle arrest, DNA repair, apoptosis, and stress resistance mim-ics the functions of the tumor suppressor protein p53, and FOXO and p53 seem to be part of a complex regulatory net-work (19, 41). HIV infection indeed activates p53 (15). Re-cently, p53 has also been shown to regulate glucose metabo-lism and autophagy via TIGAR (4, 18). An important role of TIGAR is to redirect glucose from catabolism (energy produc-tion) to anabolism (including synthesis of nucleotides) by blocking glycolysis and activating the pentose phosphate shunt (18). The observed downregulation of glycolysis, leading to an increase in glucose available for ribose precursors, should in-duce the pentose phosphate pathway. This would lead to a concomitant increase in NADPH, which can also be used for the synthesis of new viral particles and which is needed for the stress response. Indeed, we find a twofold upregulation of the purine nucleoside phosphorylase (also called inosine phos-phorylase), a central player in nucleoside metabolism of blood cells, inactivation of which results in severe combined immu-nodeficiency (37). In this context, the slight upregulation of UDPglucose pyrophosphorylase, which plays a central role as
a glucosyl donor, should also be mentioned. This is in agree-ment with studies of HIV infection of human intestinal epi-thelial cells (32), where fructose-1,6-phosphate was found to be decreased. Apart from these possibly indirect p53 effects on metabolism, p53 also downregulates stathmin (the central reg-ulator of proliferative activation of microtubules), which is strongly reduced (2.3-fold) upon HIV infection, in agreement with p53-mediated cell cycle arrest.
[image:7.585.42.544.79.419.2]The activation of p53 might again be mediated by Vpr. p53 has been shown to be activated by Vpr (16). This is possibly a consequence of Vpr-induced DNA double-strand breaks acti-vating ataxia telangiectasia mutated protein-dependent signals such as p53 (36, 48). HIV-1-induced p53 signaling is also in agreement with our observations concerning RuvBL1 and Ru-vBL2, which are part of a large nuclear protein complex con-taining TIP60. This multifunctional complex can act as a tran-scriptional coregulator for several factors, including p53 (44). It can be recruited to double-strand breaks and activate ataxia telangiectasia mutated protein by acetylation and, like FOXO and p53, is also involved in cell cycle regulation and apoptosis (44). The HIV Tat protein, however, is known to suppress TIP60’s apoptotic function, either via inhibition of its acetyla-tion activity or by TIP60 degradaacetyla-tion via polyubiquitinaacetyla-tion (44). The upregulated RuvBL1 and downregulated RuvBL2 proteins (ATP-dependent DNA helicases with 3⬘-to-5⬘ and
TABLE 2. Differentially expressed proteins grouped by metabolic pathway
Pathway (GoMiner term) Ratio Pvalue Protein name Swiss-Prot
accession no.
Glycolysis ⫺1.51 2.40E⫺03 Fructose-bisphosphate aldolase A P04075
⫺1.67 1.60E⫺04 Glucose-6-phosphate isomerase P06744
⫺1.60 9.40E⫺03 Phosphoglycerate mutase 1 P18669
⫺1.57 6.10E⫺03 Triosephosphate isomerase P60174
TCA cycle 1.88 4.10E⫺04 Aconitate hydratase Q99798
1.96 1.70E⫺05 Citrate synthase O75390
2.20 3.40E⫺04 Dihydrolipoyl dehydrogenase P09622
2.30 1.60E⫺04 Fumarate hydratase P07954
2.01 3.80E⫺05 Isocitrate dehydrogenase关NAD兴subunit alpha P50213
2.24 5.40E⫺04 Malate dehydrogenase P40926
1.73 1.10E⫺04 Pyruvate dehydrogenase E1 component subunit beta P11177 1.51 8.50E⫺03 Succinate dehydrogenase flavoprotein subunit P31040 Amino acid metabolism 2.15 6.90E⫺04 Protein disulfide-isomerase precursor P07237
1.66 2.60E⫺03 Aspartate aminotransferase P00505
2.05 1.30E⫺03 Methylcrotonoyl-coenzyme A carboxylase beta chain Q9HCC0
1.59 4.70E⫺04 Ornithine aminotransferase P04181
2.33 8.10E⫺05 Serine hydroxymethyltransferase P34897
Oxidative phosphorylation 2.62 1.40E⫺04 Ubiquinol-cytochromecreductase core protein I P31930 2.49 3.50E⫺05 NADH-ubiquinone oxidoreductase 75-kDa subunit P28331 2.67 7.50E⫺04 NADH-ubiquinone oxidoreductase 30-kDa subunit O75489
2.29 9.60E⫺04 ATP synthase D chain O75947
2.51 2.60E⫺04 ATP synthase alpha chain P25705
2.76 2.20E⫺04 ATP synthase beta chain P06576
Fatty acid metabolism 2.92 9.80E⫺05 Enoyl-coenzyme A hydratase P30084
2.05 4.90E⫺04 Trifunctional enzyme subunit alpha P40939
1.65 7.20E⫺04 Trifunctional enzyme subunit beta P55084
Glucose metabolism 1.73 1.10E⫺04 Pyruvate dehydrogenase E1 component subunit beta P11177 UDP glucoses metabolism 1.35 5.50E⫺04 UTP–glucose-1-phosphate uridylyltransferase 2 Q16851
on November 8, 2019 by guest
http://jvi.asm.org/
5⬘-to-3⬘activity, respectively) indeed play antagonistic roles, thus underlining the coordinated changes that we observe (24, 43). Many HIV-1 effects could be mediated by Vpr through FOXO, p53, and TIP60. These three all share regulation by the p300/CBP nuclear coactivator (19, 25, 41, 44), which contains acetyltransferase and ubiquitin ligase activity (41). p300/CBP is targeted by several viruses, and both HIV Vpr and Tat can bind and influence this coactivator (7, 12, 22, 27).
An apoptotic “tug of war.”Although p53 activation by HIV-1 could trigger apoptosis by a mt pathway (8, 15), viral proteins can actively suppress apoptotic programs (12, 35). In fact, many pro-teins that are (in)directly involved in apoptosis are differen-tially expressed upon infection. Chaperonins, mostly associated with antiapoptotic activity, are upregulated, including mt HSP60 and GRP75 (Mortalin) and endoplasmic reticulum (ER)-located GRP94 and GRP78, the latter being involved in virion binding (14). Some mt regulators of apoptopsis are up-regulated, including BAG-2 and prohibitin, which is associated with cell cycle arrest. On the other hand, the proapoptotic mt VDAC1 protein is strongly upregulated (as is VDAC2), while antiapoptotic 14-3-3 gamma, Cofilin-1, and high-mobility-group protein B1 are all 1.5-fold downregulated. Clearly, the virus does not suppress all apoptotic signals. Many proteins involved in cell cycle regulation and apoptosis do so via
ubiq-uitination and subsequent proteolysis. Complex changes in the amounts of such proteins are described in this study (see Table S1 in the supplemental material) as well as in the liquid chro-matography-tandem mass spectrometry (LC-MS/MS)-based proteomic study (9).
hnRNPs and stress responses.The heterogeneous nuclear ribonucleoproteins (hnRNPs) are a group of proteins sharing common structural domains, which seem to have roles in DNA repair, telomere biogenesis, cell signaling, RNA export and splicing, and regulation of gene expression. We find hnRNPs K and A1 to be downregulated. The hnRNP A1 protein regulates HIV-1 Tat mRNA splicing and seems to be involved in HIV-1 mRNA export from the nucleus (49). However, hnRNP H, which is also involved in HIV-1 mRNA splicing (6), is upregu-lated. Another “anomaly” is obtained with the regulation of protein breakdown, in which we find the general ubiquitin-activating enzyme E1 to be downregulated, whereas the pro-teasome beta type 4 subunit is upregulated nearly fourfold. Its regulatory subunit 13 (PSMD13) is also increased. The latter two proteins are involved in the HIV-1 Vpu-mediated degra-dation of CD4 (33).
[image:8.585.94.490.77.397.2]Proteins involved in stress responses are also strongly influ-enced by HIV infection and virus replication. The first one detected, in the “single” 42-h infection, is the cytoplasmic beta
FIG. 5. Metabolic rerouting of T cells upon HIV-1 infection. A highly schematic overview of pathways and proteins possibly involved in metabolic rerouting of T cells as a result of HIV-1 infection is shown. Cellular proteins are in green, cellular locations in red, and cellular processes in blue. Some of the overall effects of Vpr on the given cellular pathways are indicated (orange). For details, see the text.
on November 8, 2019 by guest
http://jvi.asm.org/
subunit of HSP90. Not surprisingly, many chaperonins (mostly ER located) are upregulated in the peak infection, including GRP 78 (BIP), ERp44, GRP 94 (endoplasmin), ERp 29 and mt HSP60. Many ER protein disulfide isomerases (such as A3, A4, and A6) are also upregulated, as are the alpha subunit of glucosidase II, heme oxygenase 2, and the 150-kDa hypoxia-upregulated protein 1 (HYOU1). The last two could be up-regulated because of the increased mt oxidation of fatty acids and amino acids described above. This could explain the up-regulation of the mt [Mn] superoxide dismutase as well. Inter-estingly, hypoxia can signal via Akt (already mentioned above as the protein kinase that can negatively regulate FOXO tran-scription factors; see also Fig. 5), and indications for the acti-vation of this pathway have been found as well (9). Surpris-ingly, AHSA1, the 38-kDa activator of the ER-located 90-kDa heat shock protein, is slightly downregulated. It is known to interact with the cytoplasmic tail of the vesicular stomatitis virus glycoprotein (45), but interactions with HIV proteins have not been found so far. However, such interactions have been documented for two of our upregulated ER stress pro-teins, endoplasmin and cyclophilin B (a peptidyl-prolyl
cis-trans-isomerase). Endoplasmin, which can also be induced by
hypoxia, seems to be bound by the virion (10, 55), although the specific interaction is still unknown. Cyclophilins interact with Vpr; although this has been shown much more convincingly for cyclophilin A (21, 56). These interactions probably are impor-tant for virus routing and packaging, as are the interactions of the virus with cytoskeletal (associated) proteins.
Our observations confirm known interactions with HIV-1 proteins in the case of p21-activated kinase 2, which is bound by Nef to inhibit Bad-mediated apoptotic death and increase virus production (30, 54), and of eIF-5A, the eukaryotic trans-lation initiation factor bound by Rev, which is involved in the nuclear export of Rev and HIV-1 replication (5). Both p21-activated kinase 2 and eIF-5A are downregulated.
Proteins involved in cellular transport.Some of the proteins involved in cellular transport are strongly influenced by the virus. The most strongly upregulated (almost fivefold) cellular protein that we find is beta-actin, while alpha-tubulin, one of the major constituents of microtubules, is also 2.5-fold upregu-lated. Ezrin, which is probably involved in connecting cytoskel-etal structures to the plasma membrane; microtubule-associ-ated protein RP/EB family member 1 (a negative regulator of microtubular polymerization); and Rho GDP-dissociation in-hibitor 2, which is involved in actin cytoskeleton organization, are all downregulated (as is stathmin, the regulator of micro-tubular activation, mentioned above). Also downregulated are adenylyl cyclase-associated protein 1, which binds actin mono-mers and is involved in filament dynamics; the actin binding lymphocyte cytosolic protein 1; and alpha actinine 1, an actin cross-linking protein. Interestingly, Rab GDP dissociation in-hibitor beta, a protein involved in the regulation of vesicle-mediated cellular transport, is almost fourfold upregulated (3). In agreement with our findings, the previous proteomic study of (9) found the RAN regulation pathway, involved in nucle-ocytoplasmic transport, to be influenced by the infection pro-cess. How all these changes fit in with cell cycle arrest, viral production, and/or transport remains to be established.
Concluding remarks.More than 30 mt proteins are differ-entially expressed upon HIV-1 infection, and all of these are
upregulated. We do not think this stems from a systematic artifact, as we find an upregulation not of all mt proteins but of only a small subclass and because the magnitude of upregula-tion observed varies among proteins. Of these upregulated mt proteins, two remain to be mentioned: the glycoprotein gC1qBP/P33, of unknown function, which can interact with rubella virus capsid protein, and SSB, a single-stranded DNA binding protein (which is known to interact with viral proteins). The production of HIV proteins is seen more strongly (CA-p24 is more upregulated and Nef can also be detected) after 42 h (see Table S2 in the supplemental material). The six upregu-lated cellular proteins at 42 h are all also detected at peak infection, but the downregulated DDX3X was detected only in this experiment. Recent studies showed that DEAD box pro-tein RNA helicases, such as DDX3 and DDX1, are important for HIV infection by facilitating the export of singly spliced or even unspliced HIV RNAs from the nucleus via the CRM1-Rev pathway. Of the DEAD box protein family, DDX3 showed the strongest mRNA downregulation upon HIV-1 replication (at 24 h after induction of replication), in agreement with our observation at the protein level (29).
To study the T-cell–virus interaction, we used transformed PM1 cells cultured in vitro, which likely differ in several ways from primary T cells found in vivo. It is currently not clear how the observed PM1 changes compare to cellular changes in vivo or whether direct cytopathicity of HIV-1 is enhanced in vitro, although large-scale apoptosis was not observed. How the ob-served changes relate to pathogenicity for the infected individ-ual is also unclear. Though superficially the cellular proteome seems relatively stable, PM1 cells are reprogrammed upon HIV-1 infection. This reprogramming begins early on in infec-tion and has funcinfec-tions, among others, at the level of general metabolism, cytoskeletal organization, and primary suppres-sion of apoptotic responses. Many of these processes are known to be affected by the viral Vpr protein, subverting cel-lular pathways involved in their regulation at many different levels (Fig. 5). Our DIGE analysis is, for the most part, in agreement with the recent findings (9) in a HIV–T-cell inter-action study using LC-MS/MS. There are even many instances in which the findings perfectly complement each other (e.g., upregulation of components of the TCA cycle or the pyruvate dehydrogenase complex in both studies, but with different sets of proteins). There are three notable differences. We observed downregulation of glycolytic enzymes, upregulation of proteins involved in fatty acid breakdown (whereas the previous study [9], e.g., found a strong increase in fatty acid synthase), and a much more consistent increase in TCA cycle enzymes. Possi-bly, these variations result from differences in the cell types used, infection procedures, and harvest times. More likely the differences are due to the different methods used, with LC-MS/MS yielding more candidate proteins but at the cost of more false positives. This first DIGE analysis of changes in the T-cell proteome upon HIV-1 infection not only un-covered specific reprogramming of T cells but also allowed us to identify (and verify) many proteins potentially involved in the virus-host interactions. Upon verification of these new cofactors of HIV-1 replication, they may become future drug targets.
on November 8, 2019 by guest
http://jvi.asm.org/
ACKNOWLEDGMENTS
We thank Stef Heynen for performing the CA-p24 ELISA experi-ments and Tony de Ronde for critical reading of the manuscript.
This research was supported by grants from the Dutch Cancer So-ciety (KWF Kankerbestrijding, AMC 2000-210), the EU project Hid-den HIV Challenge (FP6-012182), and the AIDS Fund (2007028). This study was further supported by the Academic Medical Center Anton Meelmeijer Fund.
REFERENCES
1.Alban, A., S. O. David, L. Bjorkesten, C. Andersson, E. Sloge, S. Lewis, and I. Currie.2003. A novel experimental design for comparative two-dimen-sional gel analysis: two-dimentwo-dimen-sional difference gel electrophoresis incorpo-rating a pooled internal standard. Proteomics3:36–44.
2.Auersperg, N.1964. Long-term cultivation of hypodiploid human tumor cells. J. Natl. Cancer Inst.32:135–163.
3.Bachner, D., Z. Sedlacek, B. Korn, H. Hameister, and A. Poustka.1995. Expression patterns of two human genes coding for different rab GDP-dissociation inhibitors (GDIs), extremely conserved proteins involved in cellular transport. Hum. Mol. Genet.4:701–708.
4.Bensaad, K., A. Tsuruta, M. A. Selak, M. N. Vidal, K. Nakano, R. Bartrons, E. Gottlieb, and K. H. Vousden.2006. TIGAR, a p53-inducible regulator of glycolysis and apoptosis. Cell126:107–120.
5.Bevec, D., H. Jaksche, M. Oft, T. Wohl, M. Himmelspach, A. Pacher, M. Schebesta, K. Koettnitz, M. Dobrovnik, R. Csonga, F. Lottspeich, and J. Hauber.1996. Inhibition of HIV-1 replication in lymphocytes by mutants of the Rev cofactor eIF-5A. Science271:1858–1860.
6.Caputi, M., and A. M. Zahler.2002. SR proteins and hnRNP H regulate the splicing of the HIV-1 tev-specific exon 6D. EMBO J.21:845–855. 7.Caron, C., E. Col, and S. Khochbin.2003. The viral control of cellular
acetylation signaling. Bioessays25:58–65.
8.Castedo, M., J. L. Perfettini, M. Piacentini, and G. Kroemer.2005. p53—a pro-apoptotic signal transducer involved in AIDS. Biochem. Biophys. Res. Commun.331:701–706.
9.Chan, E. Y., W. J. Qian, D. L. Diamond, T. Liu, M. A. Gritsenko, M. E. Monroe, D. G. Camp, R. D. Smith, and M. G. Katze.2007. Quantitative analysis of human immunodeficiency virus type 1-infected CD4⫹cell pro-teome: dysregulated cell cycle progression and nuclear transport coincide with robust virus production. J. Virol.81:7571–7583.
10.Chertova, E., O. Chertov, L. V. Coren, J. D. Roser, C. M. Trubey, J. W. Bess, Jr., R. C. Sowder, E. Barsov, B. L. Hood, R. J. Fisher, K. Nagashima, T. P. Conrads, T. D. Veenstra, J. D. Lifson, and D. E. Ott.2006. Proteomic and biochemical analysis of purified human immunodeficiency virus type 1 pro-duced from infected monocyte-derived macrophages. J. Virol.80:9039–9052. 11.Coiras, M., E. Camafeita, T. Urena, J. A. Lopez, F. Caballero, B. Fernandez, M. R. Lopez-Huertas, M. Perez-Olmeda, and J. Alcami.2006. Modifications in the human T cell proteome induced by intracellular HIV-1 Tat protein expression. Proteomics.6(Suppl. 1):S63–S73.
12.Col, E., C. Caron, C. Chable-Bessia, G. Legube, S. Gazzeri, Y. Komatsu, M. Yoshida, M. Benkirane, D. Trouche, and S. Khochbin.2005. HIV-1 Tat targets Tip60 to impair the apoptotic cell response to genotoxic stresses. EMBO J.24:2634–2645.
13.Das, A. T., B. Klaver, and B. Berkhout.1999. A hairpin structure in the R region of the human immunodeficiency virus type 1 RNA genome is instru-mental in polyadenylation site selection. J. Virol.73:81–91.
14.Earl, P. L., B. Moss, and R. W. Doms. 1991. Folding, interaction with GRP78-BiP, assembly, and transport of the human immunodeficiency virus type 1 envelope protein. J. Virol.65:2047–2055.
15.Genini, D., D. Sheeter, S. Rought, J. J. Zaunders, S. A. Susin, G. Kroemer, D. D. Richman, D. A. Carson, J. Corbeil, and L. M. Leoni.2001. HIV induces lymphocyte apoptosis by a p53-initiated, mitochondrial-mediated mecha-nism. FASEB J.15:5–6.
16.Giri, M. S., M. Nebozhyn, L. Showe, and L. J. Montaner.2006. Microarray data on gene modulation by HIV-1 in immune cells: 2000–2006. J. Leukoc. Biol.80:1031–1043.
17.Gomez, C., and T. J. Hope.2005. The ins and outs of HIV replication. Cell. Microbiol.7:621–626.
18.Green, D. R., and J. E. Chipuk.2006. p53 and metabolism: inside the TIGAR. Cell126:30–32.
19.Greer, E. L., and A. Brunet.2005. FOXO transcription factors at the inter-face between longevity and tumor suppression. Oncogene24:7410–7425. 20.Hashimoto, S., T. Suzuki, H. Y. Dong, S. Nagai, N. Yamazaki, and K.
Matsushima.1999. Serial analysis of gene expression in human monocyte-derived dendritic cells. Blood94:845–852.
21.Hatziioannou, T., D. Perez-Caballero, S. Cowan, and P. D. Bieniasz.2005. Cyclophilin interactions with incoming human immunodeficiency virus type 1 capsids with opposing effects on infectivity in human cells. J. Virol.79:
176–183.
22.Hottiger, M. O., and G. J. Nabel.1998. Interaction of the human
immuno-deficiency virus type 1 Tat with the transcriptional coactivators p300 and CREB binding protein. J. Virol.72:8252–8256.
23.Jensen, O. N.2006. Interpreting the protein language using proteomics. Nat. Rev. Mol. Cell Biol.7:391–403.
24.Kanemaki, M., Y. Kurokawa, T. Matsu-ura, Y. Makino, A. Masani, K. Okazaki, T. Morishita, and T. A. Tamura.1999. TIP49b, a new RuvB-like DNA helicase, is included in a complex together with another RuvB-like DNA helicase, TIP49a. J. Biol. Chem.274:22437–22444.
25.Kino, T., and G. P. Chrousos.2004. Human immunodeficiency virus type-1 accessory protein Vpr: a causative agent of the AIDS-related insulin resis-tance/lipodystrophy syndrome? Ann. N. Y. Acad. Sci.1024:153–167. 26.Kino, T., M. U. De Martino, E. Charmandari, T. Ichijo, T. Outas, and G. P.
Chrousos.2005. HIV-1 accessory protein Vpr inhibits the effect of insulin on the Foxo subfamily of forkhead transcription factors by interfering with their binding to 14-3-3 proteins: potential clinical implications regarding the in-sulin resistance of HIV-1-infected patients. Diabetes54:23–31.
27.Kino, T., A. Gragerov, O. Slobodskaya, M. Tsopanomichalou, G. P. Chrou-sos, and G. N. Pavlakis. 2002. Human immunodeficiency virus type 1 (HIV-1) accessory protein Vpr induces transcription of the HIV-1 and glu-cocorticoid-responsive promoters by binding directly to p300/CBP coactiva-tors. J. Virol.76:9724–9734.
28.Kino, T., A. Gragerov, A. Valentin, M. Tsopanomihalou, G. Ilyina-Grag-erova, R. Erwin-Cohen, G. P. Chrousos, and G. N. Pavlakis.2005. Vpr protein of human immunodeficiency virus type 1 binds to 14-3-3 proteins and facilitates complex formation with Cdc25C: implications for cell cycle arrest. J. Virol.79:2780–2787.
29.Krishnan, V., and S. L. Zeichner.2004. Alterations in the expression of DEAD-box and other RNA binding proteins during HIV-1 replication. Ret-rovirology1:42.
30.Linnemann, T., Y. H. Zheng, R. Mandic, and B. M. Peterlin.2002. Interac-tion between Nef and phosphatidylinositol-3-kinase leads to activaInterac-tion of p21-activated kinase and increased production of HIV. Virology294:246– 255.
31.Lusso, P., F. Cocchi, C. Balotta, P. D. Markham, A. Louie, P. Farci, R. Pal, R. C. Gallo, and M. S. Reitz, Jr.1995. Growth of macrophage-tropic and primary human immunodeficiency virus type 1 (HIV-1) isolates in a unique CD4⫹T-cell clone (PM1): failure to downregulate CD4 and to interfere with cell-line-tropic HIV-1. J. Virol.69:3712–3720.
32.Lutz, N. W., N. Yahi, J. Fantini, and P. J. Cozzone.1997. Perturbations of glucose metabolism associated with HIV infection in human intestinal epi-thelial cells: a multinuclear magnetic resonance spectroscopy study. AIDS
11:147–155.
33.Margottin, F., S. P. Bour, H. Durand, L. Selig, S. Benichou, V. Richard, D. Thomas, K. Strebel, and R. Benarous.1998. A novel human WD protein, h-beta TrCp, that interacts with HIV-1 Vpu connects CD4 to the ER deg-radation pathway through an F-box motif. Mol. Cell1:565–574.
34.Mitchell, R., C. Y. Chiang, C. Berry, and F. Bushman.2003. Global analysis of cellular transcription following infection with an HIV-based vector. Mol. Ther.8:674–687.
35.Moon, H. S., and J. S. Yang.2006. Role of HIV Vpr as a regulator of apoptosis and an effector on bystander cells. Mol. Cell21:7–20.
36.Nakai-Murakami, C., M. Shimura, M. Kinomoto, Y. Takizawa, K. Toku-naga, T. Taguchi, S. Hoshino, K. Miyagawa, T. Sata, H. Kurumizaka, A. Yuo, and Y. Ishizaka.2007. HIV-1 Vpr induces ATM-dependent cellular signal with enhanced homologous recombination. Oncogene26:477–486. 37.Pannicke, U., P. Tuchschmid, W. Friedrich, C. R. Bartram, and K. Schwarz.
1996. Two novel missense and frameshift mutations in exons 5 and 6 of the purine nucleoside phosphorylase (PNP) gene in a severe combined immu-nodeficiency (SCID) patient. Hum. Genet.98:706–709.
38.Peden, K., M. Emerman, and L. Montagnier. 1991. Changes in growth properties on passage in tissue culture of viruses derived from infectious molecular clones of HIV-1LAI, HIV-1MAL, and HIV-1ELI. Virology185:661–
672.
39.Perez, O. D., and G. P. Nolan.2001. Resistance is futile: assimilation of cellular machinery by HIV-1. Immunity15:687–690.
40.Pradet-Balade, B., F. Boulme, H. Beug, E. W. Mullner, and J. A. Garcia-Sanz.2001. Translation control: bridging the gap between genomics and proteomics? Trends Biochem. Sci.26:225–229.
41.Prives, C., and P. A. Hall.1999. The p53 pathway. J. Pathol.187:112–126. 42.Roeth, J. F., and K. L. Collins.2006. Human immunodeficiency virus type 1
Nef: adapting to intracellular trafficking pathways. Microbiol. Mol. Biol. Rev.
70:548–563.
43.Rottbauer, W., A. J. Saurin, H. Lickert, X. Shen, C. G. Burns, Z. G. Wo, R. Kemler, R. Kingston, C. Wu, and M. Fishman.2002. Reptin and pontin antagonistically regulate heart growth in zebrafish embryos. Cell111:661– 672.
44.Sapountzi, V., I. R. Logan, and C. N. Robson.2006. Cellular functions of TIP60. Int. J. Biochem. Cell. Biol.38:1496–1509.
45.Sevier, C. S., and C. E. Machamer.2001. p38: A novel protein that associates with the vesicular stomatitis virus glycoprotein. Biochem. Biophys. Res. Commun.287:574–582.
46.Shevchenko, A., M. Wilm, O. Vorm, and M. Mann.1996. Mass spectrometric
on November 8, 2019 by guest
http://jvi.asm.org/
sequencing of proteins on silver-stained polyacrylamide gels. Anal. Chem.
68:850–858.
47.Sierra, S., B. Kupfer, and R. Kaiser.2005. Basics of the virology of HIV-1 and its replication. J. Clin. Virol.34:233–244.
48.Tachiwana, H., M. Shimura, C. Nakai-Murakami, K. Tokunaga, Y. Takizawa, T. Sata, H. Kurumizaka, and Y. Ishizaka. 2006. HIV-1 Vpr induces DNA double-strand breaks. Cancer Res.66:627–631.
49.Tange, T. O., C. K. Damgaard, S. Guth, J. Valcarcel, and J. Kjems.2001. The hnRNP A1 protein regulates HIV-1 tat splicing via a novel intron silencer element. EMBO J.20:5748–5758.
50.Unlu, M., M. E. Morgan, and J. S. Minden.1997. Difference gel electro-phoresis: a single gel method for detecting changes in protein extracts. Electrophoresis18:2071–2077.
51.Unwin, R. D., C. A. Evans, and A. D. Whetton.2006. Relative quantification in proteomics: new approaches for biochemistry. Trends Biochem. Sci.31:473–484. 52.Van’t Wout, A., G. K. Lehrman, S. A. Mikheeva, G. C. O’Keeffe, M. G. Katze,
R. E. Bumgarner, G. K. Geiss, and J. I. Mullins.2003. Cellular gene expres-sion upon human immunodeficiency virus type 1 infection of CD4⫹T-cell lines. J. Virol.77:1392–1402.
53.Vignoli, A. L., I. Martini, K. G. Haglid, L. Silvestroni, G. Augusti-Tocco, and S. Biagioni.2000. Neuronal glycolytic pathway impairment induced by HIV envelope glycoprotein gp120. Mol. Cell. Biochem.215:73–80.
54.Wolf, D., V. Witte, B. Laffert, K. Blume, E. Stromer, S. Trapp, P. D’Aloja, A. Schurmann, and A. S. Baur.2001. HIV-1 Nef associated PAK and PI3-kinases stimulate Akt-independent Bad-phosphorylation to induce anti-apoptotic signals. Nat. Med.7:1217–1224.
55.Xu, A., A. R. Bellamy, and J. A. Taylor.1998. BiP (GRP78) and endoplasmin (GRP94) are induced following rotavirus infection and bind transiently to an endoplasmic reticulum-localized virion component. J. Virol.72:9865–9872. 56.Zander, K., M. P. Sherman, U. Tessmer, K. Bruns, V. Wray, A. T. Prechtel, E. Schubert, P. Henklein, J. Luban, J. Neidleman, W. C. Greene, and U. Schubert.2003. Cyclophilin A interacts with HIV-1 Vpr and is required for its functional expression. J. Biol. Chem.278:43202–43213.
57.Zeeberg, B. R., W. Feng, G. Wang, M. D. Wang, A. T. Fojo, M. Sunshine, S. Narasimhan, D. W. Kane, W. C. Reinhold, S. Lababidi, K. J. Bussey, J. Riss, J. C. Barrett, and J. N. Weinstein.2003. GoMiner: a resource for biological interpretation of genomic and proteomic data. Genome Biol.4:R28.