1
Teacher Workload
Survey 2019
Technical report
October 2019
2
Contents
List of tables
3
1
Introduction
6
2
Sampling
7
3
Piloting and cognitive testing
10
4.
Final questionnaire
16
5
Cooperation and response rates
41
6
Data processing and tabulation
43
7
Weighting
44
8
Data tables
49
9
Modelling the factors which impact on teachers’ working hours
95
3
List of tables
Table 1: Changes made to the TWS 2019
12
Table 2: School cooperation rates
41
Table 3: Teacher response rates, within participating schools
42
Table 4: Weighting using entropy balancing to match sample to underlying population 46
Table 5: Perceptions of the amount of time spent on non-teaching tasks by phase and
school type
49
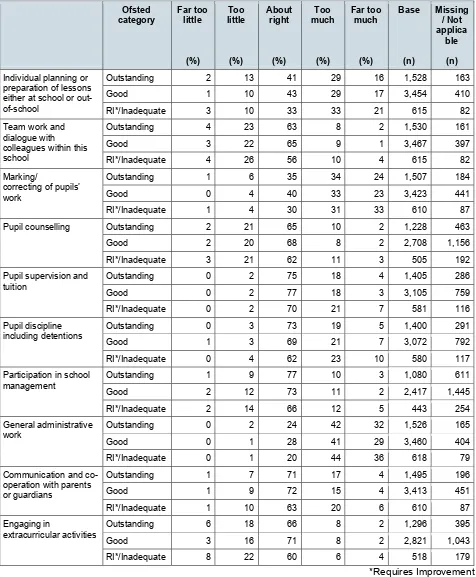
Table 6: Perceptions of the amount of time spent on non-teaching tasks by Ofsted
category
52
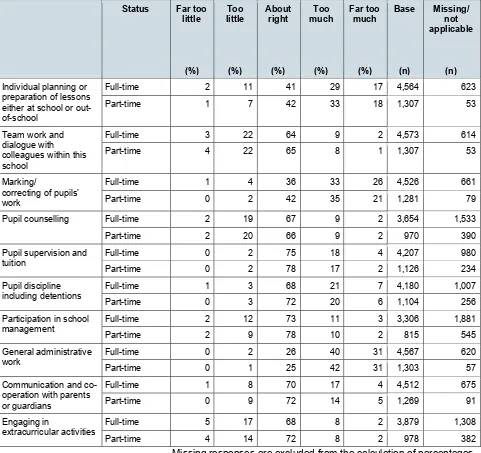
Table 7: Perceptions of the amount of time spent on non-teaching tasks by full-time or
part-time status
53
Table 8: Perceptions of the amount of time spent on non-teaching tasks by role
54
Table 9: Perceptions of the amount of time spent on non-teaching tasks by experience 55
Table 10: Perceptions of the amount of time spent on support and management, and
administrative activities by phase and school type
57
Table 11: Perceptions of the amount of time spent on support and management, and
administrative activities by full-time or part-time status
59
Table 12: Perceptions of the amount of time spent on support and management, and
administrative activities by Ofsted category
60
Table 13: Perceptions of the amount of time spent on support and management, and
administrative activities by role
61
Table 14: Perceptions of the amount of time spent on support and management, and
administrative activities by experience
62
Table 15: Perceptions of the amount of time spent on leadership tasks by phase and
school type
63
Table 16: Perceptions of the amount of time spent on leadership tasks by school Ofsted
category
66
Table 17: Perceptions of the amount of time spent on leadership tasks by full-time or
4
Table 18: Strategies used by senior leaders to manage and plan professional time by
phase and school type
68
Table 19: Strategies used by senior leaders to manage and plan professional time by
school Ofsted category
69
Table 20: Proportion of all teachers viewing workload as a problem by teacher and
school level variables
70
Table 21: Differences in teachers’ and middle leaders’ levels of agreement on statements
about working hours by phase and school type
71
Table 22: Differences in teachers’ and middle leaders’ levels of agreement on statements
about working hours by school Ofsted category
72
Table 23: Differences in teachers’, middle leaders’ and senior leaders’ levels of
agreement on statements about working hours by role
73
Table 24: Differences in teachers’, middle leaders’ and senior leaders’ levels of
agreement on statements about working hours by experience
74
Table 25: Differences in teachers’, middle leaders’ and senior leaders’ views on their
school’s working environment by phase and school type
75
Table 26: Differences in teachers’, middle leaders’ and senior leaders’ views on their
school’s working environment by school Ofsted category
76
Table 27: Differences in teachers’, middle leaders’ and senior leaders’ views on the
effects of revisions to schools’ policies and approaches by school type
77
Table 28: Differences in teachers’, middle leaders’ and senior leaders’ views on the
effects of revisions to schools’ policies and approaches by school Ofsted category
79
Table 29: Differences in teachers’, middle leaders’ and senior leaders’ views on the
effects of revisions to schools’ policies and approaches by role
80
Table 30: Differences in teachers’, middle leaders’ and senior leaders’ views on
professional development by school type
81
Table 31: Differences in teachers’, middle leaders’ and senior leaders’ views on
professional development by school Ofsted category
82
Table 32: Differences in teachers’, middle leaders’ and senior leaders’ views on
professional development by role
83
Table 33: Differences in teachers’, middle leaders’ and senior leaders’ views on
5
Table 34: Differences in teachers’, middle leaders’ and senior leaders’ views on
professional development by experience
85
Table 35: Differences in teachers’ and middle leaders’ views on line management by
school type
86
Table 36: Differences in teachers’ and middle leaders’ views on line management by
school Ofsted category
88
Table 37: Differences in teachers’ and middle leaders’ views on line management by role
89
Table 38: Differences in teachers’ and middle leaders’ views on line management by
experience
90
Table 39: Differences in senior leaders’ views on line management by school type
91
Table 40: Differences in senior leaders’ views on line management by school Ofsted
category
93
Table 41: Differences in senior leaders’ views on line management by full-time and
part-time status
94
Table 42: Final model of classroom teachers / middle leaders’ total working hours
99
6
1 Introduction
This technical report describes the methodology and analysis undertaken as part of
the administration of the Teacher Workload Survey (TWS) 2019. The findings are
presented in a separate report. The TWS is a large-scale nationally representative
survey of teachers, middle leaders and senior leaders
1first conducted in 2016. The
2019 survey is based closely on the TWS 2016, and was conducted between 11-29
March 2019. The survey helps act as a national ‘barometer’ for teachers’, middle
leaders’ and senior leaders’ working conditions and forms a key part of the
Department for Education’s (DfE) commitment to improving the evidence base on
what drives unnecessary teacher workload and what works to reduce it. The survey
was conducted by the National Foundation for Educational Research (NFER). A DfE
Steering Group and an Advisory Group of practitioners and teaching unions advised
the research team.
1
Teachers refers to ‘Classroom Teachers’, Middle leaders include ‘Heads of Department/Subject’, ‘Heads
7
2 Sampling
This section describes the process of selecting the sample of schools that were invited to
take part in the TWS 2019.
Design considerations
The key sampling design consideration was to use the same sampling approach as the
TWS 2016 (Higton
et al.,
2017), which was Probability Proportional to Size (PPS). The
two stages of PPS are traditionally:
1. Stratify the primary sampling unit (PSU) by some measure of size, then by other
strata of interest. In the case of the TWS, the PSU was the school and the
measure of size was the headcount of teachers.
2. Randomly select the same number of participants within each selected school to
take part in the study. This stage of the survey was removed from the TWS 2016
for several reasons:
•
Requiring schools to draw a sub-sample of teachers on a random basis
within their school would add a significant amount of workload for the
school and hence would likely decrease the cooperation rate and eventual
number of survey responses achieved.
•
Response rates per school would differ meaning non-response weighting
would be required. In the TALIS survey, thresholds were set stipulating
minimum response rates and significant resource was in place to ensure
these thresholds were met. The budget required for this level of support
would have been disproportionate for the TWS.
•
The variation in the size of the schools (in terms of the number of teachers)
varies markedly by school. The only way to achieve an equal selection
weight by teachers would be to set a very small target per school and
sample far more schools. Given the time constraints and value for money,
this was unrealistic.
•
Disproportionate sampling by phase was an important element of the
sampling process. Without this, far more primary schools would have been
selected than secondary. As a result, most of the secondary teacher
responses would have come from a small number of schools, which may
have introduced significant bias.
Thus, rather than sample teachers in a second stage of PPS, a census was taken within
the randomly selected schools instead.
8
Workforce Census (SWC), which was the most recent available dataset at the time of
sampling. Secondary schools are larger cluster units than primary, so the design ensured
a large enough number of secondary clusters were present. Without oversampling, there
was a significant chance of bias at the secondary school level, because too few PSUs
would have been selected. The oversampling was corrected through weighting. This
overall approach had both the advantage of remaining comparable with the previous
workload survey, as well as ensuring there was a sufficient number of secondary schools
and secondary teachers in the achieved sample of schools.
Teachers’ responses within these randomly selected schools were self-selecting and the
sampling method does not correct for the unequal selection probabilities that result from
selecting schools by the size of the teaching body. As noted above, this design is a
deviation from the ideal two-stage approach and leads to unequal selection probabilities
for teachers which were subsequently corrected through weighting. This is justified by a
larger achieved sample size and a much simpler process of administration for schools,
resulting in improvements in response rates.
The practicalities of research in schools
Some support and guidance activity with schools was undertaken in the current research
to maximise response rates. This included engaging with schools during the recruitment
phase and providing a large amount of explanatory materials to gain support and buy-in
prior to the fieldwork going live. During survey administration, chasing activity via email
and phone to schools was undertaken and reminder emails drafted for school
coordinators to send to their teaching staff.
For each phase, a set of main samples (682 primaries, 481 secondaries and 40 special)
and reserve samples (170 primaries, 120 secondaries and 10 special) were drawn.
These sample sizes ensured that, based on conservative assumptions of response rates,
the analysis was highly likely to be robust. In the end, the achieved sample exceeded
these conservative estimates of response rates by a significant margin, hence
guaranteeing the robustness of the analysis. All of the schools in the main and reserve
samples were invited to take part.
Sampling
The sampling procedure originated from a complete list of all schools in England
obtained from Get Information About Schools. From this, any non-relevant school types
were removed, leaving the following school types:
•
Academy Converter
9
•
Community School
•
Community Special School
•
Foundation School
•
Foundation Special School
•
Free Schools
•
Free Schools Special
•
Studio Schools
•
Voluntary Aided School
•
Voluntary Controlled School.
Any schools marked as “closed” or “proposed to open” were removed, followed by any
schools specified only as “16 plus” or “Nursery” in the Phase field.
Separately, the SWC 2017 was used to aggregate the number of teachers currently at
every school. The Unique Reference Number (URN) for every school served as a unique
identifier to merge this information in with the master dataset.
At this point, any school with no information on the number of teachers in the school was
given a value of the median number of teachers within that school’s phase. The median
number of teachers was used, instead of the average number of teachers, to avoid
outliers upwardly or downwardly biasing the number of teachers within each phase. This
was 13 teachers for primary schools, 18 teachers for special schools and 64 teachers for
secondary schools. This imputation was made for 73 primary schools, 8 special schools
and 31 secondary schools.
10
3 Piloting and cognitive testing
This section describes the process of piloting and cognitively testing the TWS and
supporting materials.
Selection of schools and teachers
The schools approach letter, information sheet and privacy notice were piloted with a
senior school leader in a primary school, secondary school and special school in
December 2018.
The survey has separate routing for teachers/middle leaders and senior leaders. To test
whether the questions for these two groups were performing as expected, the instrument
was cognitively tested with a senior leader and a classroom teacher or middle leader in
each of three different schools (a primary school, a secondary school and a special
school) between January and February 2019. All pilot participants were recruited via
NFER’s School Leader Panel.
Testing process
The purpose of piloting was to ensure that the schools approach letter was sufficiently
clear and persuasive, and that the information sheet and privacy notice were giving
school leaders all the information they needed to decide whether or not their schools
should take part in the survey. The documents were emailed to participating
headteachers and responses were collected via a short one page question and answer
sheet.
The purpose of cognitively testing the survey instrument was to check that respondents
interpreted the survey questions and instructions correctly. The process involved a
researcher visiting each of the three schools, and sitting with the senior leader and
classroom teacher or middle leader as they completed an online version of the
questionnaire. Participants were tested separately, and asked to sound out their thoughts
as they read through and answered each question in turn. Supplementary questions
were asked about the clarity of the questionnaire at the end of this process.
Feedback from testing
11
12
Changes made as part of the questionnaire development phase
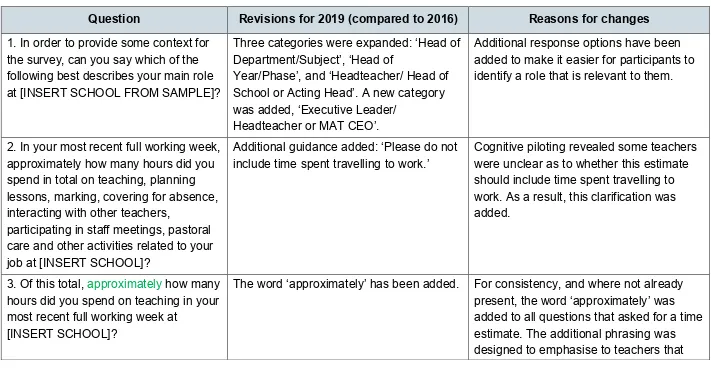
[image:12.842.70.781.164.533.2]Following cognitive testing, a number of changes were made to the questionnaire, as can be seen in Table 1 below.
Table 1: Changes made to the TWS 2019
Question
Revisions for 2019 (compared to 2016)
Reasons for changes
1. In order to provide some context for
the survey, can you say which of the
following best describes your main role
at [INSERT SCHOOL FROM SAMPLE]?
Three categories were expanded: ‘Head of
Department/Subject’, ‘Head of
Year/Phase’, and ‘Headteacher/ Head of
School or Acting Head’. A new category
was added, ‘Executive Leader/
Headteacher or MAT CEO’.
Additional response options have been
added to make it easier for participants to
identify a role that is relevant to them.
2. In your most recent full working week,
approximately how many hours did you
spend in total on teaching, planning
lessons, marking, covering for absence,
interacting with other teachers,
participating in staff meetings, pastoral
care and other activities related to your
job at [INSERT SCHOOL]?
Additional guidance added: ‘Please do not
include time spent travelling to work.’
Cognitive piloting revealed some teachers
were unclear as to whether this estimate
should include time spent travelling to
work. As a result, this clarification was
added.
3. Of this total,
approximately
how many
hours did you spend on teaching in your
most recent full working week at
[INSERT SCHOOL]?
13
Question
Revisions for 2019 (compared to 2016)
Reasons for changes
‘estimates’ were required, as cognitive
piloting revealed that some teachers were
spending a lot of time trying to calculate
the correct number of hours, which was
adding to the survey completion time.
4.
Approximately
how many hours did
you spend on the following activities
other than teaching in your most recent
full working week at [INSERT
SCHOOL]?
The word ‘approximately’ has been added. See question 3 above.
6.
Approximately
how many hours did
you spend on the following specific
support and management activities in
your most recent full working week at
[INSERT SCHOOL]?
The word ‘approximately’ has been added. See question 3 above.
7.
Approximately
how many hours did
you spend on the following specific
administrative activities in your most
recent full working week at [INSERT
SCHOOL]?
The word ‘approximately’ has been added. See question 3 above.
10. In your most recent full working
week, approximately how many hours
did you spend in total on school
management, staff supervision,
Additional guidance added: ‘Please do not
14
Question
Revisions for 2019 (compared to 2016)
Reasons for changes
interacting with other teachers, teaching
and on other tasks related to your job at
[INSERT SCHOOL]?
travelling to work. As a result, this
clarification was added.
11.
Approximately
how many hours did
you spend on the following activities in
your most recent full working week at
[INSERT SCHOOL]?
The word ‘approximately’ has been added. See question 3 above.
14. In the last two years, have any of the
following school policies or approaches
been revised in your school as part of a
specific attempt to reduce workload?
New question.
16. You said earlier that you worked
[INSERT RESPONSE FROM Q2 OR
Q10] hours in your last working week.
Approximately
how many of those hours
were spent working during weekends,
evenings or other out-of-school hours?
The word ‘approximately’ has been added. See question 3 above.
19. To what extent do you agree or
disagree with the following statements
about the way you are managed?
Where reference is given to a ‘manager’
in the options below, we mean the
person you report to.
Clarification added regarding what we
mean by ‘manager’. Response option
removed: ‘I am satisfied with the number of
hours I usually work’. Response options
added: ‘My manager supports my
well-being’; ‘The senior leadership team support
staff well-being across the school’; ‘The
Cognitive piloting revealed some teachers
were unclear about what was meant by the
term ‘manager’. As a result, this
15
Question
Revisions for 2019 (compared to 2016)
Reasons for changes
governing body/board support staff
well-being across the school’; ‘My governing
body/board support my well-being’.
teachers due to the addition of new
options, and to avoid duplication.
28. Which of the following subjects do
you teach on a regular basis?
Added response option: ‘I don’t teach a
subject’.
Some secondary senior leaders do not
actually teach a subject. As a result, this
response option was added.
29. Are you any of the following?
Question changed from ‘Are you a…?’
Response options added: ‘A trainee
teacher’; ‘A recently qualified teacher
(RQT)’.
This question was reconfigured to help
capture the views of teacher trainees and
RQTs.
30. How many years have you been
working in…?
Expanded third response option to make
clear role being referred to was the one
given in Q1: ‘…your current role as a
[INSERT RESPONSE TO Q1]’.
16
4. Final questionnaire
INTRODUCTION – Show to all
Teacher Workload Survey
Thank you for agreeing to complete this short survey, which should take no more than 15-20 minutes to complete. The ‘Teacher Workload Survey’ forms a key part of the Department for Education’s (DfE’s) commitment to improving the evidence base on what drives excessive teacher workload and what works to reduce it. The National Foundation for Educational Research (NFER) is delivering the 2019 Teacher Workload Survey on behalf of the DfE and we are very grateful for your support in completing it.
If you have any queries about the completion of this survey, please contact NFER at [email protected]
You can find more details about the research and how we will use the data you provide on the project information site: https://www.nfer.ac.uk/for-schools/participate-in-research/teacher-workload-survey-2019/
Please use the buttons at the bottom of the page to move through the survey, please do not use your browser’s forward and back buttons.
Please note that if the survey is left inactive for over 20 minutes you will be timed out. If you exit the survey before the end, any answers that you have given may still be analysed.
Once submitted you will not be able to go back and change any of your answers.
2
‘Force’ refers to the question being configured so that respondents have to give an answer.
Q1 – Single response, Ask all, Force
21. In order to provide some context for the survey, can you say which of the following best describes your main role at [INSERT SCHOOL FROM SAMPLE]?
Please
select one 1.1 Classroom Teacher 1.2 Head of Department/Subject
1.3 Head of Year/Phase
1.4 Deputy or Assistant Head
1.5 Headteacher/Head of School or Acting Head
1.6 Executive Leader/Headteacher or MAT CEO
17
Working hours questions– TEACHER route
Introduction for Teachers
Working hours
The first questions cover the activities that are most common for classroom teachersand middle leaders (for example, heads of department/year or phase leaders).
Some questions will ask for an estimate of time spent in hours in your most recent full working week. “Full working week” means your last working week covering Monday to Sunday that was not shortened by illness, religious breaks or public holidays.
Q2 – Open Response, Ask all, Prompt
32. In your most recent full working week, approximately how many hours did you spend in total on teaching, planning lessons, marking, covering for absence, interacting with other teachers, participating in staff meetings, pastoral care and other activities related to your job at [INSERT SCHOOL]?
Please include tasks that took place during weekends, evenings or other out-of-school hours. Please do not include time spent travelling to work.
Round to the nearest half hour. As an example, three and a half hours would be recorded as 3.5 below. (numeric response)
Q3 – Open Response, Ask all, Prompt
3. Of this total, approximately how many hours did you spend on teaching in your most recent full working week at [INSERT SCHOOL]?
Please only count actual teaching time.
Time spent on preparation, marking, etc. will be recorded later in the survey.
Round to the nearest half hour. As an example, three and a half hours would be recorded as 3.5 below. Please record a 0 (zero) if you spent no time on teaching in your most recent full working week.
(numeric response)
3
‘Prompt’ refers to the question being configured so that respondents are given a reminder to
18
Q4 – Multiple response, Ask all, Randomise order (4.11 remains fixed), prompt all except 4.11
4. Approximately how many hours did you spend on the following activities other than teaching in your most recent full working week at [INSERT SCHOOL]?
Include activities that took place during weekends, evenings or other off classroom hours. Please exclude all time spent teaching.
Again, round to the nearest half hour. Please record a 0 (zero) if you spent no time on a listed activity.
4.1 Individual planning or preparation of lessons either at school or out of school
(Numeric response)
4.2 Team work and dialogue with colleagues within this school (Numeric response)
4.3 Marking/correcting of pupils’ work (Numeric response)
4.4 Pupil counselling (including career guidance and virtual
counselling) (Numeric response)
4.5 Pupil supervision and tuition (including lunch supervision) (Numeric response)
4.6 Pupil discipline including detentions (Numeric response)
4.7 Participation in school management (Numeric response)
4.8 General administrative work (including communication, paperwork, work emails and other clerical duties you undertake in your job as a teacher)
(Numeric response)
4.9 Communication and co-operation with parents or guardians (Numeric response)
4.10 Engaging in extracurricular activities (e.g. sports and cultural
activities after school) (Numeric response)
19
Q5 – Grid single response per row, Ask all, prompt all except 5.11
5. Across the whole school year, is the amount of time you spend on the activities outlined in the last question too little, too much or about right?
Statements Far too
little Too little About right much Too Far too much applicable Not
5.1 Individual planning or preparation of lessons either at school or out of school
5.2 Team work and dialogue with colleagues within this school
5.3 Marking/correcting pupils’ work
5.4 Pupil counselling (including career guidance and virtual counselling)
5.5 Pupil supervision and tuition (including lunch supervision)
5.6 Pupil discipline including detentions
5.7 Participation in school management
5.8 General administrative work (including communication, paperwork, work emails and other clerical duties you undertake in your job as a teacher)
5.9 Communication and co-operation with parents or guardians
5.10 Engaging in extracurricular activities (e.g. sports and cultural activities after school)
20
Information for all
The next two questions ask about more detailed activities relating to support, management and administration. When answering, it does not matter if you included any of the following in earlier responses you made.
Q6 – Multiple response, Ask all, Ask 6.5 to Secondary Only, Randomise order, prompt all
6. Approximately how many hours did you spend on the following specific support and
management activities in your most recent full working week at [INSERT SCHOOL]?
Round to the nearest half hour. Please record a 0 (zero) if you spent no time on a listed activity.
6.1 Non-regular teaching cover for absent colleagues within
school's timetabled day (numeric response)
6.2 Appraising, monitoring, coaching, mentoring and training other teaching staff
(numeric response)
6.3 Contact with people or organisations outside of school other than parents
(numeric response)
6.4 Organising resources and premises, setting up displays,
setting up/tidying classrooms (numeric response)
6.5 Timetabled tutor time (numeric
response)
6.6 Staff meetings (numeric
response)
Q7 – Multiple response, Randomise order, ask all, prompt all
7. Approximately how many hours did you spend on the following specific administrative
activities in your most recent full working week at [INSERT SCHOOL]?
Round to the nearest half hour. Please record a 0 (zero) if you spent no time on a listed activity.
7.1 School policy development and financial planning (numeric
response)
7.2 Recording, inputting, monitoring and analysing data in relation
to pupil performance and for other purposes (numeric response)
21
Q8– Grid single response per row, ask all, ask 8.5 to Secondary Only, prompt all
8. Across the whole school year, is the amount of time you spend on the support and management activities outlined in the last questions too little, too much or about right?
Statements Far too
little Too little About right much Too Far too much applicable Not
8.1 Non-regular teaching cover for absent colleagues within school's timetabled day
8.2 Appraising, monitoring, coaching, mentoring and training other teaching staff
8.3 Contact with people or organisations outside of school other than parents
8.4 Organising resources and premises, setting up displays, setting up/tidying classrooms
8.5 Timetabled tutor time
22
Q9– Grid single response per row, ask all, prompt all
9. Across the whole school year, is the amount of time you spend on the administrative activities outlined in the last questions too little, too much or about right?
Statements Far too
little Too little About right much Too Far too much applicable Not
9.1 School policy development and financial planning
9.2 Recording, inputting, monitoring and analysing data in relation to pupil performance and for other purposes
9.3 Planning, administering and reporting on pupil
23
Working hours questions – HEADTEACHER route
Introduction for Headteachers
Working hours
The first questions cover the activities that are most common for school leaders. If you are leading more than one school, please answer the questions in relation to the school we contacted you at.
Some questions will ask for an estimate of time spent in hours in your most recent full working week.
“Full working week” means your last working week covering Monday to Sunday that was not shortened by illness, religious breaks or public holidays.
Q10 – Open Response, Ask all, prompt
10. In your most recent full working week, approximately how many hours did you spend in total on school management, staff supervision, interacting with other teachers, teaching and on other tasks related to your job at [INSERT SCHOOL]?
Please include tasks that took place during weekends, evenings or other out-of-school hours. Please do not include time spent travelling to work.
Round to the nearest half hour. As an example, three and a half hours would be recorded as 3.5 below.
24
Q11 – Multiple response, Ask all, Do Not Randomise, prompt all
11. Approximately how many hours did you spend on the following activities in your most recent full working week at [INSERT SCHOOL]?
Please include tasks that took place during weekends, evenings or other out-of-school hours. Again, round to the nearest half hour.
Please record a 0 (zero) if you spent no time on a listed activity. 11.1 Leadership and management within the school
Including strategic planning, preparing for and participating in governing board meetings, staff meetings and other school-centred management activities, such as those associated with the management of federated schools.
(numeric response)
11.2 Administration within the school
Including applying regulations to the school, reporting, school budget, preparing timetables and class composition.
(numeric response)
11.3 Administrative and management with external bodies Including responding to requests from local, regional, or national education officials
(numeric response)
11.4 Performance management of staff
Including human resource/personnel issues, classroom observations, mentoring, initial teacher training and continuing professional development
(numeric response)
11.5 Teaching and related tasks
Including covering for teacher absences, lesson planning, assessing and marking pupils’ work and student assessment
(numeric response)
11.6 Curriculum planning
Including developing curriculum and student evaluation
(numeric response)
11.7 Data analysis
Including analysis performance data at the level of the teacher and the school and record keeping for external bodies / regulatory purposes
(numeric response)
11.8 Student interactions
Including counselling and conversations outside structured learning activities, discipline
(numeric response)
11.9 Parent or guardian interactions Including formal and informal interactions
(numeric response)
11.10 Recruitment
For teaching and support staff
(numeric response)
11.11 Other activities (numeric
25
Q12 – Grid single response per row, Ask All, prompt all
12. Across the whole school year, is the amount of time you spend on the activities outlined in the last question too little, too much or about right?
Statements Far too
little Too little About right much Too Far too much applicable Not
12.1 Leadership and management within the school
12.2 Administration within the school
12.3 Administrative and management with external bodies
12.4 Performance management of staff
12.5 Teaching and related tasks
12.6 Data analysis
12.7 Curriculum planning
12.8 Student interactions
12.9 Parent or guardian interactions
26
Q13 – Grid single response per row, Ask All, Randomise Order (13.6 remains fixed), prompt
all except 13.6
13. Does [INSERT SCHOOL] have any of the following strategies in place for managing and planning professional time?
Strategy Yes No Not sure
13.1 Protected blocks of non-teaching time to plan lessons and/or mark work (PPA)
13.2 Working collaboratively with other staff to plan schemes of work and/or share resources
13.3 Existing schemes of work and associated lesson plans that can be adapted by teaching staff
13.4 Computer software that effectively helps with administrative tasks
13.5 A committee in place that monitors teachers’ workload
27
New Question 14 – Grid single response per row, Ask All, Randomise Order, except 14.8,
In the last two years, have any of the following school policies or approaches been revised in your school as part of a specific attempt to reduce workload?
Yes, but it has
added to my workload
Yes, and it has reduced
my workload
Yes, and it has made
no difference to
my workload
No revisions
made Not sure if revisions have been
made
14.1 Marking and feedback policy
14.2 Approach to lesson planning
14.3 School behaviour policy
14.4 Teacher appraisal policy
14.5 Communications protocols (internal and/or external)
14.6 Data tracking/monitoring of students’ progress
14.7 Policies to support flexible working practices, such as special
leave/absence policies
28
Heading: Perceptions and drivers of workload
Q15 – Grid single response per row, Ask All, Randomise Order, prompt all
15. To what extent do you agree or disagree with the following statements about your working hours?
Q15 Statements Strongly
disagree disagree Tend to agree nor Neither disagree
Tend to agree
Strongly agree
15.1 I can complete my assigned workload during my contracted working hours
15.2 I have an acceptable workload
15.3 Overall, I achieve a good balance between my work life and my private life
Q16 –
Open Response, Ask all, Insert response from Q2 or Q10 into this question, prompt
16. You said earlier that you worked [INSERT RESPONSE FROM Q2 OR Q10] hours in your last working week. Approximately How many of those hours were spent working during weekends, evenings or other out-of-school hours?
Round to the nearest half hour. As an example, three and a half hours would be recorded as 3.5 below.
29
Q17 – Grid single response per row, Ask All, Randomise Order, prompt all
17. To what extent do you agree or disagree with the following statements about the working environment within [INSERT SCHOOL]?
Statements Strongly
disagree disagree Tend to agree nor Neither disagree
Tend to
agree Strongly agree
17.1 Teaching staff collaborate effectively to address disciplinary problems
17.2 Lesson observations carried out in
[INSERT SCHOOL] are an effective part of professional development activity
17.3 Teaching assistants are effectively deployed at [INSERT SCHOOL]
30
Q18 – Grid single response per row, Ask All, Randomise Order, prompt all
18. To what extent do you agree or disagree with the following statements about professional development and support?
Statements Strongly
disagree disagree Tend to agree nor Neither disagree
Tend to
agree Strongly agree
18.1 I have enough time to keep informed on changes to guidance and rules affecting professional practice
18.2 I have the necessary Information and Communication Technology (ICT) skills to perform data recording and analysis tasks
18.3 [INSERT SCHOOL] supports continuing professional development for teachers
18.4 I have time during my contracted working hours to take part in professional development activities
31
Q19 – Grid single response per row, VERSION FOR TEACHERS, Randomise 19.1 to 19.4,
prompt all
19. To what extent do you agree or disagree with the following statements about the way you are managed? Where reference is given to a ‘manager’ in the options below, we mean the person you report to.
Statements Strongly
disagree disagree Tend to agree nor Neither disagree
Tend to
agree Strongly agree
19.1 My manager is considerate of my life outside work
19.2 My manager supports my well-being
19.3 The senior leadership team support staff well-being across the school
19.4 My manager recognises when I have done my job well
19.5 I think that my performance is evaluated fairly
32
Q19 – Grid single response per row, VERSION FOR HEADTEACHERS, Randomise 19.1 to 19.6, prompt
all
19. To what extent do you agree or disagree with the following statements about the way you are managed? By ‘manager’, we mean the person you report to.
Statements Strongly
disagree disagree Tend to agree nor Neither disagree
Tend to
agree Strongly agree applicable Not
19.1 My manager is considerate of my life outside work
19.2 My manager supports my well-being
19.3 The senior leadership team support staff well-being across the school
19.4 The governing body/board support staff well-being across the school
19.5 My governing body/board support my well-being
19.6 My manager recognises when I have done my job well
19.7 I think that my performance is evaluated fairly
Q20 – Single response, reverse 20.1 to 20.4, Ask all, prompt
20. To what extent, if at all, do you consider teacher workload to be a serious problem in your school?
Please
select one 20.1 Workload is not a serious problem at all 20.2 Workload is not a very serious problem
20.3 Workload is a fairly serious problem
20.4 Workload is a very serious problem
33
Introduction for all
Linking to the School Workforce Census
The following two questions ask whether you would be happy to provide some personal details so that we can link your answers to information stored in the School Workforce Census (SWC) database. This means that you wouldn’t need to answer another set of questions that ask about details already contained in the SWC database.
It also means we can explore how teacher workload affects issues such as teacher retention further down the line, which will in turn help DfE to develop policies based on robust evidence. DfE would keep this data until 31st August 2022.
Please be assured that your responses will only be used for the purposes of this research and for no other purpose. Only aggregated statistics will be produced with this information. No individual or school will be identified in any analysis or report that results from the use of this data.
Further information on how your data will be used, and your privacy protected, is available in the privacy notice https://www.nfer.ac.uk/media/3207/dfws_privacy_notice.pdf.
Q21 – Single response, Ask all , Force
21. Do you give permission for NFER to match your survey answers to information in the School Workforce Census, for the purpose of analysis?
Please select one
21.1 Yes [-> Go to Q22]
34
Q22 – Single response, show Q22 for those who said yes at Q21, Force
22. Do you give permission for NFER to provide your survey responses and personal details to the DfE to enable analysis of how teacher workload affects teacher retention?
Please
select one 22.1 Yes [-> Go to Q23]
22.2 No[-> Go to Q23]
Q23 – Multiple Response, Ask if yes for Q21, prompt 23.1, 23.2 and 24.4
23. In order for us to link to the School Workforce Census, can you please provide the following details:
Information required Response – Allow or Refuse Details
23.1 First name [open response]
23.2 Last name [open response]
23.3 Maiden name/former last name (leave blank
if not applicable) [open response]
23.4 Date of birth (dd/mm/yyyy) [date field]
23.5 Seven digit Teacher Reference Number (If known, otherwise please leave blank)
This is your 7 digit number. Please ignore any initial letters such as RP. For example,
If your number is “68/12345” just enter
“6812345
35
Q26 –
Ask if no for Q21 or did not provide 23.1, 23.2 and 23.4 for matching, prompt
26. Please provide the number of hours per week for which you are contracted to work at [INSERT SCHOOL]?If your contract is variable and/or term-time only, please write in the typical hours you work per school week.
(numeric response)
Q24– Single response, Ask if no for Q21 or did not provide 23.1, 23.2 and 23.4 for matching,
prompt
24. Into which of the following age bands do you fall?
Please select one
24.1 Under 25
24.2 25 to 29
24.3 30 to 34
24.4 35 to 39
24.5 40 to 44
24.6 45 to 49
24.7 50 to 54
24.8 55 to 59
24.9 60 or older
24.10 Prefer not to say
Q25 – Single response, Ask if no for Q21 or did not provide 23.1, 23.2 and 23.4 for
matching, prompt
25. What is your gender? Please
select one
25.1 Female
25.2 Male
36
Q27 – Single response, Ask if no for Q21 or did not provide 23.1, 23.2 and 23.4 for
matching, prompt
27. Which of the following best describes your employment contract at [INSERT
SCHOOL]?
Please
select one 27.1 Permanent employment (an on-going contract with no fixed end-point before the age of retirement)
27.2 Fixed-term contract for a period of more than 1 school year
27.3 Fixed-term contract for a period of 1 school year or less
37
Q28 – Multiple response, Alphabetical order, Drop down menu, Ask all Secondary, prompt
28. Which of the following subjects do you teach on a regular basis?
Please select all that apply
28.1 I don’t teach a subject 28.2 Applied Business Studies 28.3 Art and Design / Art
28.4 Biology / Botany / Zoology / Ecology
28.5 Chemistry
28.6 Commercial and Business Studies/Education/Management 28.7 Design and Technology
28.8 Design and Technology - Food Technology
28.9 Design and Technology - Resistant Materials
28.10 Drama
28.11 English
28.12 French
28.13 Geography
28.14 German
28.15 Health and Social Care
28.16 History
28.17 Humanities
28.18 Information and Communication Technology/Computer Science
28.19 Mathematics / Mathematical Development (Early Years)
28.20 Media Studies
28.21 Music
28.22 Personal Social and Health Education (PSHE)
28.23 Physical Education / Sports
28.24 Physics
28.25 Primary Curriculum
28.26 Psychology
28.27 Religious Education
28.28 Science
28.29 Sociology
28.30 Spanish
28.31 Other (Please specify)
38
Q29 – Grid single response per row, Ask TEACHERS All, Ask HEADTEACHERS 29.4 only,
prompt
29. Are you any of the following?
Role Yes No
29.1 A trainee teacher
(i.e. you are training to be a teacher but have not yet gained Qualified Teacher Status)
29.2 A newly qualified teacher (NQT)
(i.e. you have gained Qualified Teacher Status, and begun but not completed your statutory induction (or NQT) period)
29.3 A recently qualified teacher (RQT)
(i.e. you have gained Qualified Teacher Status and are in your second or third year of teaching)
29.4 An SEN Coordinator
Q30 – Multiple response, Ask All 30.1, 30.3 and 30.4. ONLY ASK HEADTEACHERS 30.2,
prompt all
31. How many years have you been working in...?
Please record the time in years to the nearest half year.
30.1 …the teaching profession (numeric
response)
30.2 …a role that places you in the Leadership Group Pay Range (numeric response)
30.3 …your current school (numeric
response)
30.4 …your current role as a [INSERT RESPONSE TO Q1] (numeric
39
Introduction, show text to all
Permission to Contact You for Further Research
The DfE may wish to contact you again in the next 18 months to ask you to take part in other research studies about teaching and workload issues. (Please note that, if contacted, you will be under no obligation to take part). Further information on how your privacy will be protected is available here:
https://www.nfer.ac.uk/media/3207/dfws_privacy_notice.pdf
The DfE may contact you directly or appoint an approved contractor. Your details would not be shared with any other third parties.
Q31 – Single response, Ask all - Mandatory
31. Do you provide permission for NFER to pass on a copy of your survey responses plus your personal details to the DfE for this purpose?
Please
select one 31.1 Yes, the DfE, or an approved contractor, may contact me to learn more about my survey responses and/or to invite me to take part in further research on this issue
31.2 No
Q32 – Multiple Response, ask if yes at Q21 and yes at Q31, all prompt
32. Could you please provide details of how we can contact you for further research on teachers’ workload? Note your contact details will not be used for any other purpose.
Information required Response – Allow or Refuse Details
32.1 Telephone Number [telephone number]
32.2 Work email address [email field]
40
Q33– Multiple Response, ask if no at Q21 and yes at Q31, all prompt
33. Please provide some contact details so we can contact you for further research on teachers’ workload. Note your contact details will not be used for any other purpose.
Information required Response – Allow or Refuse Details
33.1 Full Name [open response]
33.2 Date of birth [date field]
33.3 Telephone number [telephone number]
33.4 Work email address [email field]
33.5 Personal email address [email field]
CLOSING STATEMENT – Show to all
Teacher Workload Survey Complete
41
5 Cooperation and response rates
This section summarises the rate of school cooperation after being invited to participate
in the TWS 2019, and the response rates among teachers in those schools.
School cooperation rate
Based on prior experience and conservative assumptions about potential co-operation
and response rates, it was estimated that a minimum sample of 1,500 schools including
both main and reserve samples (850 primary schools, 600 secondary schools and 50
special schools) would be required. The timeframe of the study meant that there would
be little time to draw a reserve sample once the cooperation rate was known. As a result,
the reserve sample was drawn at the same time as the main sample. The main sample of
1,200 schools was invited to participate. After reviewing the interim cooperation rate, a
further 300 reserve sample schools were also invited to take part in the research.
In total, 449 schools (251 primary, 181 secondary and 17 special schools) agreed to take
part in the study while 32 schools (2 per cent) refused to take part in the study. At least
one survey response was received from 405 schools. Of the 1,500 schools invited, Table
2 shows the cooperation rates by school in total and between phases. The cooperation
rate achieved for the full sample was 27 per cent; the cooperation rate for the sample
excluding refusals was 28 per cent. The total cooperation rate in the 2016 wave of the
TWS was 24 per cent; the cooperation rate for the sample excluding refusals in TWS
2016 was 28 per cent.
Table 2: School cooperation rates
Primary Secondary
Special
Total
n
%
n
%
n
%
n
%
Total sampled schools
850 100 600 100
50 100 1,500
100
Refused
18
2
14
2
0
0
32
2
Sample excluding refused
832
98 586
98
50 100 1,468
98
Agreed to participate
251
30 181
30
17
34
449
30
Schools with participating
teachers
220
26 168
28
17
34
405
27
Full sample co-operation rate
26
28
34
27
Sample excluding refusals
42
Teachers’ response rate
As shown in Table 2, at least one survey response was received from 405 schools. The
teacher response rate was calculated by dividing the number of responses received (in
total and by school phase) by the total number of teachers present in these schools
(based on figures in the SWC 2017).
The response rate in each school ranged from 1 per cent to 100 per cent. Of the 405
participating schools, just 12 schools had a response rate of less than 10 per cent. Table
3 shows that the overall teacher-level response rate within participating schools was 40
per cent. The teacher-level response rate was 45 per cent in primary schools, 38 per cent
in secondary schools and 35 per cent in special schools.
Table 3: Teacher response rates, within participating schools
Primary Secondary Special Total
Teachers present in participating schools
(n)
4,461
13,551
401 18,413
Responding teachers (n)
2,060
5,291
149
7,500
43
6 Data processing and tabulation
Cleaning
Data were kept as similar as possible to the TWS 2016 for consistency and clarity of
comparison. Data cleaning was performed for question 1 (role): a small number of
respondents gave different job titles to the responses specified, which were re-classified
into classroom teacher, middle leader or senior leader.
Additional data cleaning was performed where respondents had misinterpreted the
question, such as Q26 (number of contracted hours per week). Here, where people had
given responses less than one (such as 0.6) it was reasonable to assume they had given
their hours proportional to full-time hours (FTE equivalent). These were cleaned by
multiplying their response by 32.5. This was done in order to derive a consistent figure in
hours for as many respondents as possible.
Data matching
Additional publicly-available existing data was matched for all schools where available,
such as Ofsted rating and region classification, from Get Information About Schools
4.
Teacher-level data from the SWC was also included where the teacher gave consent in
Q21. Consenting teachers were matched by DfE to their SWC 2018 records using their
name, date of birth, school ID and (where collected) TRN. There was a small group of
teachers who could not be matched to the SWC and hence were without characteristics
for analysis (740 out of the 4,949 who consented to be matched).
Processing and tabulating
The resulting cleaned data file had the weighting variable matched into it (see Annex 7:
Weighting). Cross-tabulations of the data were run in SPSS. Tabulations were run both
unweighted and weighted and then quality assured and validated for accuracy. This
double-check ensured full confidence in data analysis.
44
7 Weighting
Weighting was necessary to account for the unequal selection probabilities resulting from
the sampling process (see chapter 2) and hence to ensure that the achieved sample was
representative of the teacher population in England. Entropy balancing, a statistical
technique that adjusts the mean and variance of multiple characteristic variables
simultaneously to match the sample of responses to a target population, was undertaken
on the achieved sample
5. The balancing procedure included the following variables:
1. Phase of School. This made the largest contribution to the weights. The design
of the study ensured enough secondary schools were present and, as a result,
there were a disproportionately large number of secondary teachers in the sample
compared to primary.
2. Size of school. The second variable that made a large contribution to the
weighting was the size of the school. The PPS sampling design led to an
over-representation of teachers from larger schools compared to the total population of
all teachers. The size of school variable (small/medium/large) was defined by
creating three equally sized groups (tertiles) in terms of teachers’ headcount from
the SWC 2018 for primary and secondary schools separately, then using the
minimum and maximum number of teachers for each of the six groups to classify
the sample into these groups.
3. Role. A binary classification of teachers and middle leaders (classroom
teachers, heads of department, heads of year) versus senior leaders (assistant
headteacher upwards).
4. Gender. Responses by gender were broadly representative of the teacher
population.
5. Age. Age bands were included in the balancing: under 25, 25 to 29, 30 to 34,
35 to 39, 40 to 44, 45 to 49, 50 to 54, 55 to 59 and 60 or older. Responses by age
were broadly representative of the teacher population.
6. Contract. A binary classification between those on permanent contracts (an
on-going contract with no fixed end-point before the age of retirement) and a
45
term contract (either for a period of 1 school year or less or for a period of more
than 1 school year). This was broadly representative of the population.
7. Working arrangements. Responses by full-time and part-time contracted staff
were broadly representative of the population. Part-time was defined from the
questionnaire as respondents reportedly working less than 28 hours or through the
SWC 2018 (a pre-specified variable). Values of contracts greater than 40 hours
per week were excluded from the analysis to remain consistent with TWS 2016.
There were no cases where the two definitions disagreed, as information came
either from the survey or from the SWC.
8. Urban/rural denomination. Responses by urban and rural schools were
broadly representative of the population. Urban schools were classified as: urban
city and town, urban city and town in a sparse setting, urban major conurbation or
urban minor conurbation. Rural schools were classified as: rural hamlet and
isolated dwellings, rural hamlet and isolated dwellings in a sparse setting, rural
town and fringe, rural town and fringe in a sparse setting, rural village, or rural
village in a sparse setting.
9. Ofsted rating. Split by ‘outstanding’, ‘good’, ‘requires improvement’/
‘inadequate’ (these categories were combined due to small sample sizes) and ‘not
inspected yet’. ‘Outstanding’ schools were slightly over-represented compared to
the population.
10. Government Office Region code (GOR). GOR was classified as: London,
East Midlands, West Midlands, North East, North West, South East, South West,
Yorkshire and the Humber and the East of England. Responses by region were
broadly representative of the population.
11. School type. Another binary classification between academies and local
authority maintained schools. Academy schools were disproportionally
represented in the achieved sample, although this is likely to reflect the phase
difference highlighted above as secondary schools are more likely to be
academies and were over-sampled.
12. Free school meal eligibility in the last 6 years (FSMever) quintiles. The
percentage of children in a school with FSMever was split into five equal groups
(quintiles). The two lowest quintiles were slightly over-represented in the achieved
sample.
13. English as an additional language (EAL). The percentage of children in a
school with EAL was broadly representative of the population.
Whilst data for all respondents existed for all the school-level weighting variables (as this
was information about their school which formed part of the sample), not all 7,287
46
working arrangements and contract. The required values were imputed randomly using
proportions from the underlying distribution of the population. For example, 28 per cent of
all teaching staff in the population were male according to SWC 2018. If an individual’s
gender was missing due to non-response in the survey or it was not possible to match
the individual to the SWC; then for the purpose of weighting they were randomly
assigned a gender with probability of 28 per cent of being male and 72 per cent of being
female. Once values were imputed for all the required teacher characteristics, weights
were then applied to all respondents so that the sample matched the underlying
population on all of the above variables. This was a statistically valid procedure because
the school-level characteristics formed the most significant part of the resulting weights,
as shown in Table 4. In other words, it made little difference to the resulting weights
whether an individual with missing gender was randomly assigned to be male or female,
as the weights were largely determined by school-level characteristics, for which there
was no missing data.
Table 4: Weighting using entropy balancing to match sample to underlying
population
Variables
Categories
Pre-weighting
raw
averages
with
imputations
(%)
Post-weighting
averages
with
imputations
(%)
SWC
averages
(%)
Under 25
3
3
3
25-29
17
16
16
30-34
18
18
18
35-39
16
16
16
Age
40-44
14
14
14
45-49
14
13
13
50-54
10
10
10
55-59
6
7
7
60 or older
2
3
3
Gender
Male
28
24
24
Female
72
76
76
Contract
Permanent
94
90
90
47
Variables
Categories
Pre-weighting
raw
averages
with
imputations
(%)
Post-weighting
averages
with
imputations
(%)
SWC
averages
(%)
Role
Teacher/ middle leader
90
86
86
Senior leader
10
14
14
Working
arrangements
Full-time
79
77
77
Part-time
21
23
23
School size
Small
5
17
17
Medium
28
34
34
Large
67
49
49
Phase
Primary
27
51
51
Secondary
73
49
49
Rural
denomination
Urban
89
86
86
Rural
11
14
14
Ofsted-category
Outstanding
23
18
18
Good
53
57
57
Requires Improvement/
Inadequate
10
12
12
Not yet inspected by
Ofsted
14
13
13
Geographical
region
London
16
16
16
North East
2
5
5
East Midlands
9
8
8
East of England
14
11
11
North West
14
14
14
South East
18
16
16
South West
7
9
9
West Midlands
9
11
11
48
Variables
Categories
Pre-weighting
raw
averages
with
imputations
(%)
Post-weighting
averages
with
imputations
(%)
SWC
averages
(%)
School type
LA maintained
40
50
50
Academy
60
50
50
Percentage of pupils with English as an
additional language
19
19
19
Free school
meal
eligibility
quintiles
Highest
29
22
22
2
ndhighest
25
21
21
Middle
20
19
19
2
ndlowest
13
20
20
Lowest
13
18
18
There were also six individuals that had duplicate SWC records (and had therefore
submitted more than one survey response). Their weight was divided by two to account
for this, ensuring that both sets of responses were taken into account (as they may not
have been identical) but that these responses were treated as pertaining to one
49
8 Data tables
This section presents the data from the subgroup analyses in chapters 4 and 5 of the
main report.
Chapter 4
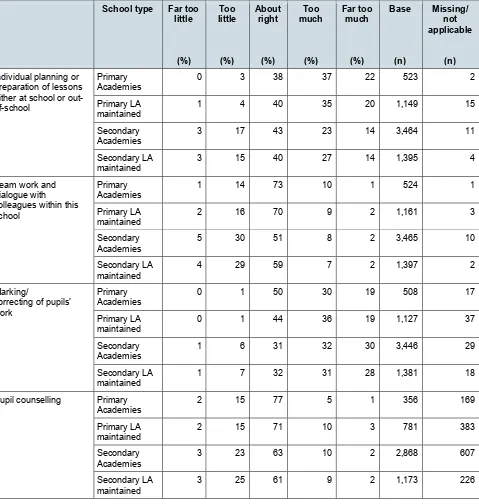
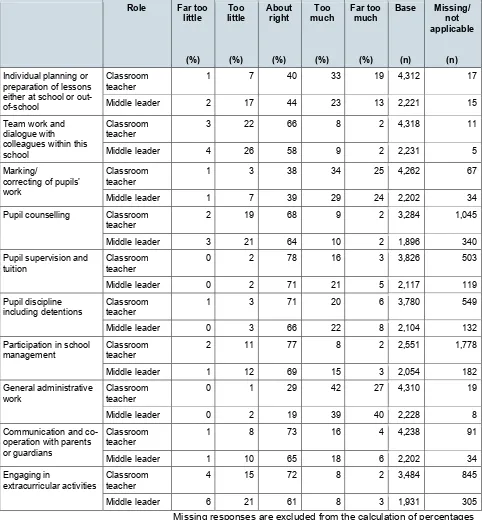
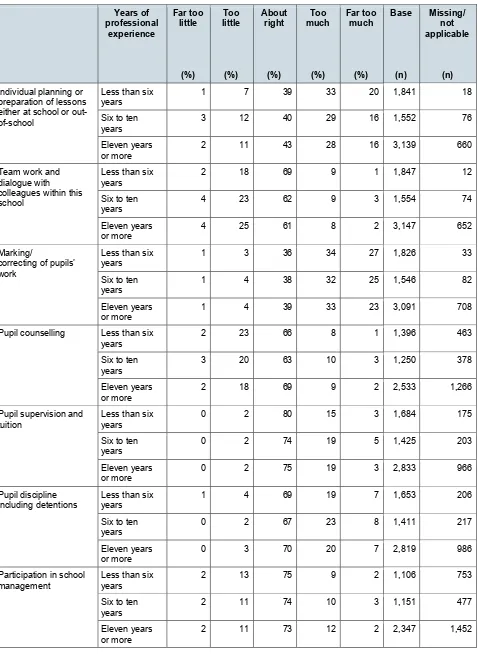
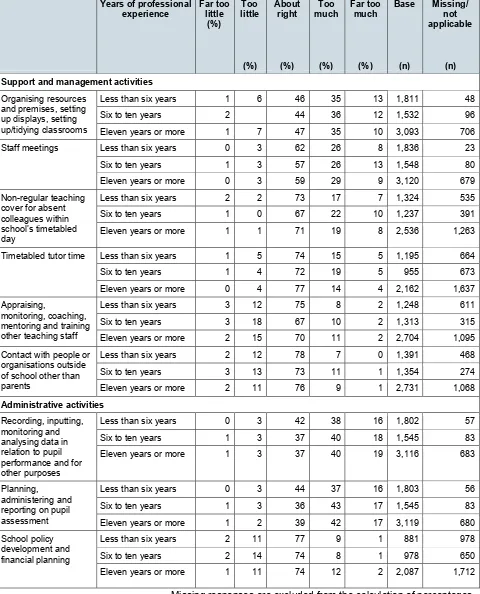
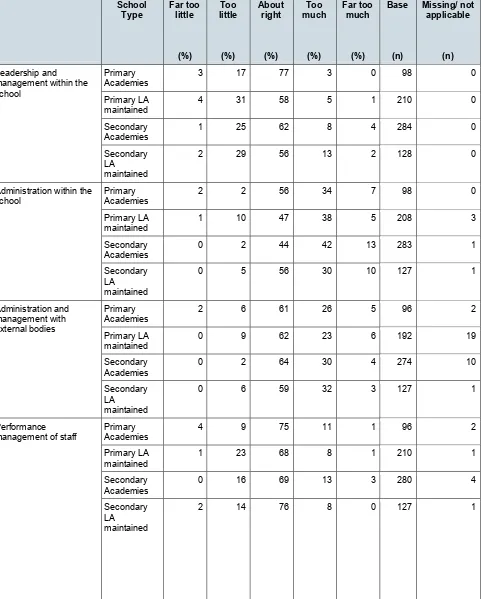
[image:49.595.66.545.272.776.2]Differences in perceptions on the amount of time spent on
non-teaching tasks by teacher and school characteristics
Table 5: Perceptions of the amount of time spent on non-teaching tasks by phase
and school type
School type Far too little (%) Too little (%) About right (%) Too much (%) Far too much (%) Base (n) Missing/ not applicable (n) Individual planning or
preparation of lessons either at school or out-of-school
Primary
Academies 0 3 38 37 22 523 2
Primary LA
maintained 1 4 40 35 20 1,149 15
Secondary
Academies 3 17 43 23 14 3,464 11
Secondary LA
maintained 3 15 40 27 14 1,395 4
Team work and dialogue with colleagues within this school
Primary
Academies 1 14 73 10 1 524 1
Primary LA
maintained 2 16 70 9 2 1,161 3
Secondary
Academies 5 30 51 8 2 3,465 10
Secondary LA
maintained 4 29 59 7 2 1,397 2
Marking/
correcting of pupils’ work
Primary
Academies 0 1 50 30 19 508 17
Primary LA
maintained 0 1 44 36 19 1,127 37
Secondary
Academies 1 6 31 32 30 3,446 29
Secondary LA
maintained 1 7 32 31 28 1,381 18
Pupil counselling Primary
Academies 2 15 77 5 1 356 169
Primary LA
maintained 2 15 71 10 3 781 383
Secondary
Academies 3 23 63 10 2 2,868 607
Secondary LA
50
School type Far too little
(%)
Too little
(%)
About right
(%)
Too much
(%)
Far too much
(%)
Base
(n)
Missing/ not applicable
(n) Pupil supervision and
tuition Primary Academies 0 2 84 12 3 441 84
Primary LA
maintained 0 2 81 15 2 931 233
Secondary
Academies 0 3 71 21 5 3,255 220
Secondary LA
maintained 1 3 71 21 4 1,323 76
Pupil discipline
including detentions Primary Academies 0 2 85 11 2 387 138
Primary LA
maintained 1 2 77 17 3 862 302
Secondary
Academies 0 3 61 25 10 3,310 165
Secondary LA
maintained 1 5 65 20 9 1,323 76
Participation in school
management Pr