Management Information
Initial Teacher Training Performance Profiles: academic
year 2012 to 2013
Date 23 October 2014
Coverage England
Theme Initial Teacher Training
Issued by Department for Education, Sanctuary Buildings, Great Smith Street, London SW1P 3BT
Press office 020 7925 6789
Public enquiries 0370 000 2288
Statistician Sally Mercer
Phone 0207 340 7077
Email [email protected]
Internet https://www.gov.uk/government/collections/statistics-teacher-training
33,985
Total number of first year publicly funded trainees1 on a course in the academic year 2012 to 201335,667
Total number of final year publicly funded trainees on a course in the academic year 2012 to 201331,017
Total number of final year publicly funded trainees who were awarded Qualified Teacher Status after they completed their course92%
The proportion of those awarded qualified teacher status and responded to a
survey, who were employed in a teaching role within six months of completing their teacher training course2.
1 Excludes Teach First trainees. See Methodology for more details
2 For more information on the methodology for this calculation please see page 14. Figure is 85% under historic
1.
Background
This Management Information provides figures on the number of trainees commencing or completing an initial teacher training (ITT) course leading to qualified teacher status in England in the academic year 2012 to 20133. The initial teacher training (ITT) performance profiles are designed to:
• help potential trainee teachers make an informed choice about where to train
• monitor the performance of the organisations accredited to provide initial teacher training
• support and inform the evaluation and benchmarking of initial teacher training organisations.
There are differences between “providers” and “routes” and definitions are given below. In this academic year there were: 80 universities, 103 organisations delivering employment-based initial teacher training, 57 school-centred initial teacher training organisations and one further education college providing mainstream initial teacher training. Compared to the academic year 2011 to 2012, the mix is broadly similar.
The difference between these providers is:
Employment based initial teacher training (EBITT)
These providers are led by schools that select candidates they need and lead on work centred teacher training. (Now closed to new entrants)
School centred initial teacher training (SCITT)
These providers are for postgraduates and are led by a group of schools in partnership with universities and teaching colleges. They aim to give students a chance to put teaching theory learnt at university, into practise.
Higher education institutions (HEI)
These provide undergraduate or postgraduate courses at university.
These providers had four main routes into the teaching profession and figures include trainees that have not yet completed their course. The rest of the document focuses on first year trainees and final year trainees:
• 351 trainees took the school direct route
• 5,400 trainees took the employment-based initial teacher training route
• 13,476 trainees in total were on the undergraduate route
• 24,066 trainees took the postgraduate route
3 There are some groups of people excluded from the figures presented here. For more information please see
The difference between these routes is:
School direct (SD) This is a new route for postgraduates and is led by schools that select the candidates they need and lead on work-centred teacher training. Trainees can either receive a salary and be employed by the school or pay their own fees.
Employment based initial teacher training (EBITT)
This is mainly a postgraduate route and is led by schools that select candidates they need and lead on work centred teacher training. (Now closed to new entrants)
Undergraduate route This route is for students who choose to go on a three or four year teaching course as part of their first degree.
Postgraduate route This route offers one year courses at university for postgraduates who have achieved a good first degree.
In addition, this release also provides statistics on the number of people in their first and final years of initial teacher training in the academic year 2012 to 2013.
For people in their first year of teacher training there is information on:
• Providers and routes – method of teacher training as listed above
• Course type or phase - broadly divided into
o primary4
o secondary
Also, into more detailed specialist subjects
• Demographic characteristics
o gender
o ethnicity
o age
o disability
• Qualifications on entry to initial teacher training
4 Primary covers pupils aged between five and 11. Secondary covers pupils aged between 11 and 16, it also
For people in their final year of teacher training there is information on:
• Route – method of teacher training as listed above Also more detail on specialist subjects
• Outcomes – qualified teacher status and employment status
High level information is presented in the tables that accompany this report with more detailed information by provider / route also provided and supplementary information. For school direct, information is for the lead school in the partnership, although the teacher training may also occur with other schools in the partnership.
The initial teacher training performance profiles are also available online: Performance profiles
The website includes earlier datasets about initial teacher training from the academic year 1996 to 1997 through academic year 2012 to 2013.
2.
Number of first year trainees by entry route and provider to the
teaching profession and trainees’ subject specialisms
(Table 1 to 2)This section describes information on publicly funded first year trainees in the academic year 2012 to 2013. There were 33,985 trainees starting an initial teaching training programme, who were publicly funded. The number of first year trainees has been broadly stable for the last ten years, ranging from 31,577 in the academic year 2005 to 2006 to 33,985 in the academic year 2012 to 2013.
First year trainees by entry route to the teaching profession
There were 33,985 first year trainees in the academic year 2012 to 2013. Of these, 84% were training to teach at a university (provider led) either on a postgraduate route or an under-graduate teaching course. A further 15% were training to teach using the employment based initial teacher training route. The remaining 1% chose the school direct training route. Table 1 contains summary information on the number of trainees on each route and course type.
Table 1: Number of first year trainees by route and course
type, academic year 2012 to 2013
Note: These figures exclude some trainees; see section 7 for more details
Primary Secondary5 TOTAL
All trainees6 20,116 13,869 33,985
Postgraduate
Of which: Provider led 11,359 10,715 22,074 Employment based Initial Teacher Training 2,533 2,487 5,020 School Direct 88 263 351
Undergraduate 6,136 404 6,540
Over time there has been a shift away from provider led teacher training towards more school centred routes. Prior to the academic year 2008 to 2009, all first year trainees entered a provider led route. By the academic year 2012 to 2013, it had fallen to 84%.
Table 1 shows that 59% of total first year trainees were primary trainees. Provider led and employment based routes were also around the 60% mark for primary trainees. However, school direct had a much lower proportion of primary trainees with 25% training to be primary school teachers in the academic year 2012 to 2013.
5 Secondary includes those training at key stage 2/3
First year trainees by provider type
The largest provider of initial teacher training are higher education institutions, 80% trainees used these providers. The second largest was school centred initial teacher training, 6% trainees used school centred providers. The rest, 15%, were in employment based initial teacher training, which is simultaneously a provider and a route, in the academic year 2012 to 2013. These are now closed to new trainees.
Long term trend in primary and secondary numbers
Chart 1: First year trainees by key stage - academic year
2003 to 2004 to academic year 2012 to 2013
While the long term trend in the total number of first year trainees is stable, from academic year 2010 to 2011 onwards there have been more people training as primary school teachers, rather than secondary which was historically the higher group. The link below provides further evidence on the growth in primary school numbers.
NATIONAL PUPIL PROJECTIONS: FUTURE TRENDS IN PUPIL NUMBERS 2013
Subjects taken by first year trainees
Of the 33,985 first year trainees in 2012 to 2013, over half, 59%, were training to be primary teachers, a further 41% were training to be secondary teachers, including key stage 2/3.
In the academic year 2012 to 2013 in secondary schools, including key stage 2/3, there is more specialism. There were 2,129 mathematics trainees, 1,779 English trainees, 1,078 chemistry trainees and 745 physics trainees. There were a further 778 other science trainees.
Table 2: Number of first year postgraduate specialism
subjects by course type, academic year 2012 to 2013
Note: These figures exclude some trainees; see section 7 for more details
Primary Secondary TOTAL
All Trainees 13,980 13,465 27,445
Mathematics 121 2,129 2,250 English - 1,779 1,779 Chemistry - 1,078 1,078 Physics - 745 745
Modern languages 307 1,507 1,814 Other sciences - 778 778
[image:7.595.72.441.198.348.2]3.
First year trainees by qualifications on entry to teacher training
courses
(Tables 3 to 5)The initial teacher training performance profiles include information about the qualifications on entry held by first year trainees. In the academic year 2012 to 2013 there were 6,540 first year trainees at undergraduate level and 27,445 at postgraduate level. This varied by course type with 97% of secondary courses and 69% of primary course trainees being at postgraduate level.
The qualifications on entry of trainees are collected and used as an indicator of trainee quality. The classification of UK degree is the measure used for postgraduate courses and the University and Colleges Admission Service (UCAS) tariff score7 is used for undergraduate courses.
The qualifications on entry are not the same as the entry requirements, and Universities, colleges, schools and other organisations accredited to provide initial teacher training set their own minimum entry requirements and qualifications.
Postgraduate trainees
The majority (96%) of first year trainees on postgraduate level courses had a UK degree in the academic year 2012 to 2013. This has increased slightly from 95% in the academic year 2011 to 2012. Of those trainees with a UK degree, 71% had a 2:1 or better classified degree in the academic year 2012 to 2013 compared with 62% in the academic year 2009 to 2010 and 67% in the academic year 2011 to 2012. Of these, 14% had a first class degree which in broadly in line with the proportion, 13%, of all graduates in England (Source: Higher Education Statistics Agency).
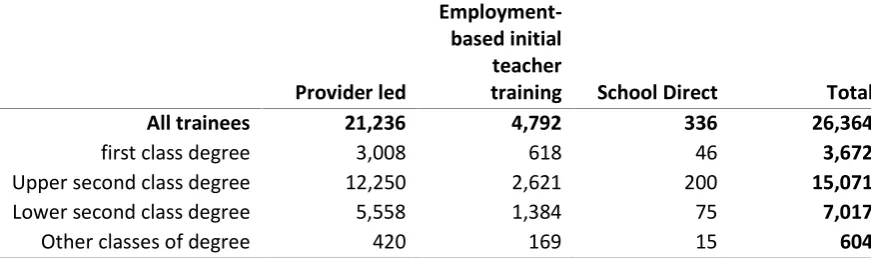
Table 3: Classification of UK degrees held by first year
trainees on postgraduate level courses, academic year
2012 to 2013
Provider led
Employment-based initial teacher
training School Direct Total
All trainees 21,236 4,792 336 26,364
first class degree 3,008 618 46 3,672
Upper second class degree 12,250 2,621 200 15,071
Lower second class degree 5,558 1,384 75 7,017
Other classes of degree 420 169 15 604
School centred initial teacher training providers had trainees with slightly lower proportions having an upper second class degree or better, 67% compared with 72% in higher education institution providers.
7 The UCAS tariff scores qualifications held by students on undergraduate courses.
[image:8.595.76.512.518.647.2]Table 4: Classification of UK degrees held by first year
trainees on postgraduate level courses by subject
specialisms, academic year 2012 to 2013
First class
Upper second class honours
Lower second class honours
Other classes of
degrees All trainees
All Subjects 14% 57% 27% 2% 26,364
Primary 11% 59% 29% 2% 13,622
Science 17% 48% 30% 4% 2,488
Mathematics 21% 42% 31% 6% 1,991
English 14% 68% 16% 2% 1,815
Modern languages 17% 62% 19% 2% 1,172
Other specialisms 16% 58% 24% 2% 5,269
Missing - - - 100% 7
Table 4 shows that there was variation in the proportion of people with first and upper second class degrees. Trainees who were training to teach mathematics and science subjects, had a slightly different distribution than that for all trainees. They had a higher proportion of first class degrees, lower second class and below, whilst they had a lower proportion of upper second class degrees.
Chart 2: Trends in qualifications of first year postgraduate
trainees, academic year 2002 to 2003 through academic
year 2012 to 2013
[image:9.595.72.493.402.714.2]Undergraduate trainees
[image:10.595.69.441.270.348.2]Of the 6,540 trainees on undergraduate courses in the academic year 2012 to 2013, 66% had A or A/S levels, this has increased by 3 percentage points from the academic year 2011 to 2012. A further 26% of first year trainees had other qualifications (for example, HND or BTec) and this has decreased slightly from 27% in the academic year 2011 to 2012. The remaining 8% had an Access to Higher Education Diploma, which is a qualification which prepares people without traditional qualifications for study at university.
Table 5: Qualifications on entry held by first year trainees
on undergraduate level courses, academic year 2012 to
2013
Primary Secondary8 TOTAL
All trainees 6,136 404 6,540
A or AS level 4,054 241 4,295 Access 483 40 523 Other 1,599 123 1,722
4.
Characteristics of first year trainees
(Tables 6 to 7)This section describes the characteristics of first year trainees in the academic year 2012 to 2013. Of the 33,985 first year trainees in academic year 2012 to 2013, 27% were male; this has been broadly stable since the academic year 2003 to 2004. However, this has varied by type of training, with 20% of primary trainees being males, compared to 37% secondary trainees in the academic year 2012 to 2013.
Overall, 48% of first year trainees were aged 25 and over, a slight fall compared to the academic year 2011 to 2012.
Where ethnicity was declared by the first year trainees9, 12% declared themselves to be from an ethnic minority background. Again this figure is in line with previous years.
Where information was provided10, 8% of first year trainees declared themselves to be disabled compared with 6% in the academic year 2009 to 2010 and 7% in the academic year 2011 to 2012.
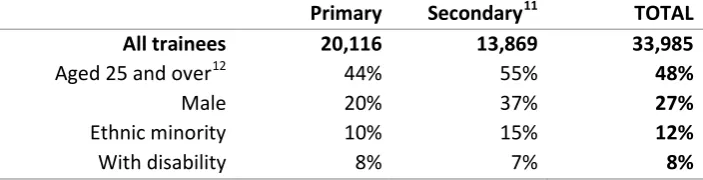
Table 6: Number of first year trainees by characteristics
and course type, academic year 2012 to 2013
Note: These figures exclude some trainees; see section 7 for more details
Primary Secondary11 TOTAL
All trainees 20,116 13,869 33,985
Aged 25 and over12 44% 55% 48%
Male 20% 37% 27%
Ethnic minority 10% 15% 12%
With disability 8% 7% 8%
9 Ethnicity was provided for 98% of first year trainees
10 A disability outcome was recorded in almost 100% of first year trainees, with less than 1% stating they
‘preferred not to say’.
[image:11.595.88.440.376.466.2]Table 7: Number of first year trainees by characteristics
and subject specialism, academic year 2012 to 2013
Note: These figures exclude some trainees; see section 7 for more details
Male minority Ethnic disability With Aged over 25 Trainees All
All Subjects 27% 12% 8% 48% 33,985
Primary 20% 10% 8% 44% 20,116
Science 44% 17% 7% 59% 2,656
Mathematics 48% 25% 6% 54% 2,224
English 23% 12% 6% 52% 1,899
Modern languages 20% 14% 4% 69% 1,507
[image:12.595.79.544.431.758.2]Other subjects 38% 11% 10% 51% 5,583
Table 7 shows that first year trainees with certain characteristics were more likely to apply to teach certain subjects. Males and ethnic minorities were more likely to train to teach mathematics and science than be a primary or language teacher. Trainees who were aged 25 and over were much more likely to train to teach modern languages and mathematics. Trainees with a disability were most likely to specialise in other subjects or train as primary school teachers.
5.
The outcome of final year trainees
(Tables 8 to 9)This section describes information on final year trainees in the academic year 2012 to 2013. There were 35,667 trainees in total. The number of final year trainees has been broadly stable for the last ten years.
Award of qualified teacher status for final year trainees
There were 35,667 final year trainees in the academic year 2012 to 2013, of which 64 were assessment based. This is broadly stable with previous years. Overall, 87% of final year trainees in the academic year 2012 to 2013 achieved qualified teacher status, this was down slightly from 89% in the academic year 2011 to 201213. The longer term trend is broadly stable (chart 4).
There was slight variation in the proportion of final year trainees being awarded qualified teacher status, 86% of undergraduate trainees received qualified teacher status, compared to 87% of postgraduate trainees.
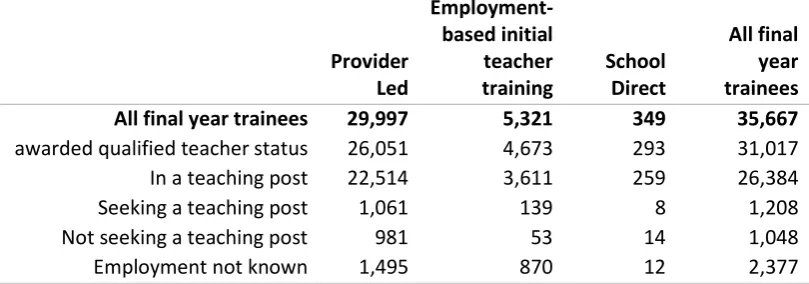
Table 8: Employment status of final year trainees,
academic year 2012 to 2013
Note: These figures exclude some trainees; see section 7 for more details Provider Led Employment-based initial teacher
training School Direct
All final year trainees
All final year trainees 29,997 5,321 349 35,667
awarded qualified teacher status 26,051 4,673 293 31,017 In a teaching post 22,514 3,611 259 26,384 Seeking a teaching post 1,061 139 8 1,208 Not seeking a teaching post 981 53 14 1,048 Employment not known 1,495 870 12 2,377
Of the 31,017 final year trainees awarded qualified teacher status in the academic year 2012 to 2013 and then excluding employment not known, 92%14 were employed in a teaching post within six months of completing their initial teacher training in by January 2014. This was an increase on the academic year 2011 to 2012 figure of 91%, the highest figure in a decade15. A further 4% indicated they were seeking a teaching post and 4% indicated they were not seeking a teaching post.
13 Note: from 2012, a number of changes were introduced to skills tests, including a limit of two resits, which
may have an impact on the qualified teacher status award rate going forward.
14 This excludes trainees with an unknown employment status. With the unknowns included the figure is 85%.
[image:13.595.74.479.404.546.2]Alternative methodology to calculate proportion employed within 6 months
When looking at the proportion of trainees employed in England within six months of finishing their training the following options are available for those who have obtained qualified teacher status; In a teaching post, Seeking a teaching post, NOT seeking a teaching post, not known/not identified.
Up to the academic year 2011 to 2012, to calculate those in a teaching post as a proportion of those awarded qualified teacher status, we used those in a teaching post divided by total awarded qualified teacher status.
Using the numbers in table 8, under this methodology (option 1): 26,384/31,017 = 85%
From the academic year 2012 to 2013, we exclude not known/not identified from the baseline (denominator) because we have no information on their employment status. Looking at the 2012 to 2013 cohort we know that many of those unknown are from NI, Scotland, Wales and other domiciles.
Using the numbers in table 8, under the alternative methodology (option 2): 26,384/(31,017-2,377) = 92%
Chart A: Difference between option 1 and option 2 methodology from academic year 2002 to 2003 through to 2012 to 2013
Chart 5 and table 9 uses the alternative methodology for all outcomes and years, however both sets of data are provided in the supplementary tables for transparency.
We would welcome comments from users on the options.
Chart 4: Trends in the award of QTS for final year trainees,
academic year 2002 to 2003 through academic year 2012
to 2013
Chart 4 shows that over the last ten years, trends in the award of QTS for final year trainees have been broadly flat.
Chart 5: Trends in the outcome of final year trainees,
academic year 2002 to 2003 through academic year 2012
to 2013
Chart 5 shows that over the last ten years, trends in the outcome of trainees have been broadly flat.
0% 10% 20% 30% 40% 50% 60% 70% 80% 90% 100%
20
Characteristics of final year trainees awarded qualified teacher
status and their outcomes
Ethnic minority groups had a lower proportion achieving qualified teacher status, 76%, compared to 87% for all trainees. A slightly higher proportion of trainees with disabilities, 79% achieved qualified teacher status. Likewise, 83% of males and 84% of those over 25 achieved qualified teacher status compared to 87% for all trainees.
Table 9: Demographics of trainees achieving qualified
teacher status and their employment status, academic year
2012 to 2013
Note: These figures exclude some trainees; see section 7 for more details
Male minorityEthnic 16 disability Has a over 25 Age
All final year trainees
All final year trainees 9,594 4,331 2,799 18,403 35,667
awarded qualified teacher status 83% 76% 79% 84% 87%
Of those awarded qualified teacher status:
In a teaching post 92% 89% 91% 91% 92%
Seeking a teaching post 4% 6% 5% 5% 4%
Not seeking a teaching post 4% 4% 4% 4% 4%
6.
List of tables
The following tables are available in excel format on the department’s statistics website: statistics: initial teacher training
Main tables: Tables 1 to 6
1 Summary of first and final year trainees in the academic year 2012 to 2013.
2 Characteristics (gender, ethnicity, age and disability) of first year trainees in the academic year 2012 to 2013.
2a Characteristics of first year trainees in the academic years 2002 to 2003 through academic year 2012 to 2013
3 Qualifications on entry of first year post -graduates in the academic year 2012 to 2013
3a Qualifications on entry - First year postgraduates with a UK degree in the academic years 2002 to 2003 through academic year 2012 to 2013
4 Qualifications on entry of first year undergraduates in the academic year 2012 to 2013
4a Qualifications on entry - First year undergraduates, academic years 2002 to 2003 through academic year 2012 to 2013 5 Outcomes (award of qualified teacher
status) and early employment (within six months of completion of training) of final year undergraduates and postgraduates in academic year 2012 to 2013
5a Outcome and employment status of final year trainees in the academic years 2002 to 2003 through academic year 2012 to 2013
6 Outcomes (award of qualified teacher status) and early employment (within six months of completion of training) of final year trainees by subject in the academic year 2012 to 2013 for selected routes.
Provider level data:
7 Provider level data: This contains all the provider level data on one sheet so the intake and outcomes can be easily analysed. Data for some providers are suppressed so that individuals cannot be identified and in some cases there is secondary suppression. However, there is information where there are more than 5 trainees.
7.
Methodology
Data collection
The data used in this report is collected from providers and compiled together using online systems managed by the National College for Teaching and Leadership (NCTL).
The majority of data from the universities that deliver initial teacher training is collected by the Higher Education Statistics Agency (HESA) under a long-standing data sharing agreement. HESA supply an extract from their student level collection and their destination of leavers in higher education survey (DLHE).
The data from non-university providers of initial teacher training are collected directly using bespoke online systems managed by the NCTL.
Data are collected at trainee level and are aggregated at provider and course level for publication in the performance profiles. Data about trainees that achieved qualified teacher status through assessment only are excluded from this summary, although included and separately identified in the data set.
Time series and revisions
For this year’s publication ten years worth of time series information has been included following feedback from users. This information has been re-extracted from a live database, as such there slight differences between the information presented here and that published historically.
Confidentiality
Trainees excluded from this report
There are a number of groups excluded from this analysis who may be involved in initial teacher training. This is because the programmes are either already contributing towards the target or are excluded from the target. The figures presented in this report exclude those on:
Assessment based (First
year only) This route is for experienced teachers with a degree and those with a teaching qualification from different countries, who have not yet received qualified teacher status in England. It allows teachers to do the necessary assessment and skills tests to qualify for qualified teacher status. They are deemed to be already in the workforce and therefore excluded from the analysis here.
Teach first Teach first is a charity that runs two year teacher training programmes in schools. Successful trainees receive a Post Graduate Certificate of Education (PGCE) in the first year of the Leadership Development Programme. And also gain qualified teacher status. However, these programmes are funded by trainees with salaries received from working in schools.
Self funded This includes oversees trainees that are not entitled to any UK financial support. Includes trainees who fund themselves. These are excluded from the analysis here.
Troops to teach This programme recruits former Service personnel (Service leavers) into teaching. It is a two-year undergraduate school-based initial teacher training route that involves four days in a school and one day set aside for academic study. At the end of the programme successful candidates gain Qualified Teacher Status. These are excluded from the analysis here.
Filters applied to the database for tables in the document
The filters applied for management information tables 1 to 7 is as follows:
• Trainee status = included
• First year = yes
• Route ~= teach first
Additional filters were applied to tables 3 to 5 to filter out undergraduates and postgraduates. The filters applied for management information tables 8 and 9 is as follows:
• Trainee status = included
• Final year = yes
• Route ~= teach first
8.
Further information
If from the media Press Office News Desk, Department for Education, Sanctuary Buildings, Great Smith Street, London SW1P 3BT.
© Crown copyright 2014
You may re-use this information (excluding logos) free of charge in any format or medium, under the terms of the Open Government Licence. To
view this licence, visit Open Government Licence or e-mail:
Where we have identified any third party copyright information you will need to obtain permission from the copyright holders concerned.
Any enquiries regarding this publication should be sent to us at:
Performance and Analysis Division, National College for Teaching & Leadership Department for Education, Sanctuary Buildings Great Smith Street, London, SW1P 3BT