3D Printed Miniaturised Analytical Devices
(3D MADe)
Vipul Gupta
B.Pharm, MSSchool of Physical Sciences
A dissertation submitted in partial fulfilment of the requirements for the
Doctor of Philosophy
(Chemical Sciences)
University of Tasmania
Statement of Co-Authorship
The following people and institutions contributed to the publication of work undertaken as part of this thesis:
Vipul Gupta, Australian Centre for Research on Separation Science (ACROSS) and ARC Centre of Excellence for Electromaterials Science, School of Physical Sciences, University of Tasmania, Australia = Candidate
Brett Paull, Australian Centre for Research on Separation Science (ACROSS) and ARC Centre of Excellence for Electromaterials Science, School of Physical Sciences, University of Tasmania, Australia = Author 1 (Primary Supervisor)
Pavel N. Nesterenko, Australian Centre for Research on Separation Science (ACROSS), School of Physical Sciences, University of Tasmania, Australia = Author 2 (Co-Supervisor)
Gordon G. Wallace, ARC Centre of Excellence for Electromaterials Science, Intelligent Polymer Research Institute, University of Wollongong, Australia = Author 3
Sara Sandron, Australian Centre for Research on Separation Science (ACROSS), School of Physical Sciences, University of Tasmania, Australia = Author 4
Brendan Heery, Australian Centre for Research on Separation Science (ACROSS), School of Physical Sciences, University of Tasmania, Australia = Author 5
Stephen Beirne, ARC Centre of Excellence for Electromaterials Science, Intelligent Polymer Research Institute, University of Wollongong, Australia = Author 6
Mohammad Talebi, Australian Centre for Research on Separation Science (ACROSS), School of Physical Sciences, University of Tasmania, Australia = Author 7
Fletcher Thompson, Australian Centre for Research on Separation Science (ACROSS), School of Physical Sciences, University of Tasmania, Australia = Author 8
Jeremy Deverell, Australian Centre for Research on Separation Science (ACROSS), School of Physical Sciences, University of Tasmania, Australia = Author 9
David A. Collins, Marine Environmental Sensing Technology Hub (MESTECH), Dublin City University, Ireland = Author 10
Ekaterina P. Nesterenko, Marine Environmental Sensing Technology Hub (MESTECH), Dublin City University, Ireland = Author 11
Dermot Brabazon, Advanced Processing Technology Research Centre, Dublin City University, Ireland= Author 12
Fiona Regan, Marine Environmental Sensing Technology Hub (MESTECH), Dublin City University, Ireland = Author 13
Author details and their roles:
Paper 1, 3D printed metal columns for capillary liquid chromatography:
Located in Chapter 2
Candidate performed most of the experimental investigation and contributed to the formalisation, development, and presentation of the work. (Approximate candidate contribution to the total work = 40%)
Author 1 and author 2 contributed to the inception of the idea and formalisation, development, and presentation of the work
Author 3, author 10, author 11, author 12, and author 13 contributed to the inception of the idea Author 4 and author 5 performed the preliminary investigation and contributed to the formalisation, development, and presentation of the work
Author 6, author 7, and author 8 offered general laboratory assistance
Paper 2, 3D printed titanium micro-bore columns containing polymer monoliths for reversed-phase liquid chromatography:
Located in Chapter 3
Candidate performed all the experimental investigation, and with author 1, author 2, and author 3 contributed to the inception of the idea and to the formalisation, development, and presentation of the work. (Approximate candidate contribution to the total work = 75%)
Author 4, author 5, author 6, author 7, author 8, and author 9 offered general laboratory assistance Paper 3, Investigating the effect of column geometry on separation efficiency using 3D printed liquid chromatographic columns containing polymer monolithic phases:
Located in Chapter 4
Candidate performed all the experimental and theoretical investigation, and with author 1, author 2, and author 3 contributed to the inception of the idea and to the formalisation, development, and presentation of the work. (Approximate candidate contribution to the total work = 75%)
Author 6 offered general laboratory assistance
Paper 4, A new 3D printed radial flow-cell for chemiluminescence detection: Application in ion chromatographic determination of hydrogen peroxide in urine and coffee extracts:
Located in Chapter 5
Candidate performed all the experimental and theoretical investigation, and with author 1, author 2, and author 3 contributed to the inception of the idea and to the formalisation, development, and presentation of the work. (Approximate candidate contribution to the total work = 75%)
ACKNOWLEDGEMENT
I would like to extend my sincere thanks to my advisors, friends, and family members for all
their help, support, and encouragement throughout my doctoral and pre-doctoral studies to
enable me today to present this thesis.
I cannot express enough thanks to my PhD supervisors Prof. Brett Paull and Prof. Pavel N.
Nesterenko to give me an opportunity to work under their guidance, be available at every step
of the PhD, always provide useful advice, and be always supportive and encouraging towards
my attempts to try new ideas and projects. They have always encouraged my personal and
scientific growth by allowing me to explore new avenues and opportunities and guiding my
way throughout the process. I would also like to thank my Masters’ Degree supervisor Prof.
Matthew R. Linford for training me and guiding me through the basic elements of scientific
research and for his valuable advice during several PhD projects.
This interdisciplinary work would not have been possible without a close collaboration with
various individuals, namely Gordon G. Wallace, Stephen Beirne, Fletcher Thompson, Parvez
Mahbub, Tom Kazarian, Mohammad Talebi, Sara Sandron, Brendan Heery, Jeremy Deverell,
David A. Collins, Ekaterina P. Nesterenko, Dermot Brabazon, and Fiona Regan. I would like
to thank them all for their help and support during respective projects.
I would like to express my gratitude to the financial support provided by the University of
Tasmania, Tasmanian Graduate Research Scholarship (TGRS), Australian Research Council
(Grant number CE140100012), and additive fabrication facilities provided by the Australian
National Fabrication Facility (ANFF) Materials Node.
I am grateful to Prof. Jason A Smith, Murray Frith, Dr. Petr Smejkal, Jennifer Nield, and
operations. I would like to extend my sincere thanks to Prof. Charles Lucy, Prof. Joe Foley,
Dr Kevin Thomas, and Paul Worsfold for having a healthy discussion and providing me with
valuable guidance during their visit to the Australian Centre for Research on Separation
Science (ACROSS).
I thank my friends Benjamin Savarear, Manish Khandagale, Chowdhury Kamrul Hasan,
Mohammad Rahbar, Sumit Sahni, and Tushar Tomar for their help and advice on various
occasions.
Most importantly, I would like to thank my family; my wife (Arushi Manchanda Gupta), my
parents (Mrs. Brij Bala Gupta and Mr Pushkar Gupta), my in-laws (Mrs. Arti Manchanda and
Dr Subhash Manchanda), and my brother (Mohit Gupta) for their undying support,
never-ending encouragement, making me laugh when I am sad, picking me up when I am down,
and standing with me during each sad and happy phase of my life. None of this would have
ABSTRACT
3D printing has gained popularity in almost every field of research, development, and
manufacturing due to its ability to fabricate complex three-dimensional prototypes and
functional devices with relative ease, which was unimaginable in the past. Herein, different
3D printing techniques have been studied to understand their capabilities and potential to
miniaturise and increase the performance of analytical devices. In particular, selective laser
melting and PolyJet 3D printing techniques have been used to develop new functional 3D
printed miniaturised analytical devices with three-dimensional micro- and milli-fluidic
channels.
An initial study was undertaken to assess the ability of selective laser melting technique to
fabricate 600 mm long, 0.9 mm I.D. stainless steel (316L) and titanium alloy (Ti-6Al-4V)
columns within a footprint of 5 × 30 × 30 mm. The 3D printed stainless steel column was
slurry packed with octadecyl silica particles, and it was used for liquid chromatographic
separations of small molecules. This study provided a proof of concept for the use of
selective laser melting technique to fabricate miniaturised metallic capillary liquid
chromatographic columns. However, these 3D printed columns resulted in a channel wall
roughness of 20 µm, which limited the chromatographic performance of the slurry packed
liquid chromatographic columns. Accordingly, the 3D printed titanium column was
functionalised with in-column thermally polymerised poly(butyl methacrylate-co-ethylene
glycol dimethacrylate) (BuMA-co-EDMA) monolith to circumvent the limitation of channel
wall roughness. Silanisation of thermally oxidised titanium channel walls allowed a
The prepared monolithic column was successfully used for reversed-phase liquid
chromatographic (RPLC) separations of intact proteins and peptides. The use of a Peltier
thermoelectric module based heating/cooling system allowed the generation of rapid
temperature gradients to further improve the RPLC separations of the intact proteins.
The initial study was then extended to explore the ability of 3D printing techniques to design
and fabricate geometrically complex 3D column geometries. Three different column
geometries were designed and 3D printed in titanium, namely 2D serpentine, 3D spiral, and
3D serpentine. These columns were used to perform an investigation into the effect of 3D
column geometry on the liquid chromatographic efficiencies of monolithic columns. All three
columns allowed successful in-column thermal polymerisation of mechanically stable and
uniform poly(BuMA-co-EDMA) monoliths. Van Deemter plots indicated higher liquid
chromatographic efficiencies of the chromatographic columns with higher aspect ratio turns
at higher linear velocities and smaller analysis time as compared to their counterpart columns
with lower aspect ratio turns. Computational fluid dynamic (CFD) simulations of a basic
monolithic structure indicated 44%, 90%, 100%, and 118% higher flow through narrow
channels in the curved monolithic configuration as compared to the straight monolithic
configuration at linear velocities of 1 mms-1, 2.5 mms-1, 5 mms-1, and 10 mms-1, respectively.
An improvement in the interaction between wide and narrow channels in high aspect ratio
coiled columns offers a possible explanation behind the above-mentioned trends in the Van
Deemter plots. Use of the highly convoluted 3D serpentine column at higher flow rates as
compared to the less convoluted 3D spiral column allowed 58% reduction in the analysis time
and 74% increase in the peak capacity for the isocratic separations of the small molecules and
In addition to the use of the selective laser melting 3D printing technique to fabricate metallic
miniaturised analytical devices, the use of the PolyJet 3D printing technique was also
explored to fabricate polymeric miniaturised analytical devices. The PolyJet 3D printing
technique was successfully used to fabricate a new transparent polymer radial flow-cell for
chemiluminescence detection (CLD). The PolyJet 3D printed radial flow-cell resulted in an
increase in both the signal magnitude and duration for CLD of H2O2. The new flow-cell
design provided an average increase in the peak height of 63% and 58%, in peak area of 89%
and 90%, and in peak base width of 41% and 42%, as compared to its coiled-tubing spiral
flow-cell and PolyJet 3D printed spiral flow-cell, respectively. CFD simulations indicated
that the higher spatial coverage near the inlet and the lower linear velocities in the radial
flow-cell could be contributing towards its higher signal magnitude and higher signal
duration, respectively. The PolyJet 3D printed radial flow-cell was applied within a
developed selective, sensitive, and reproducible ion chromatography coupled
chemiluminescence detection (IC-CLD) assay for the determination of H2O2 (a biomarker) in
TABLE OF CONTENTS
List of figures xiii
List of tables xx
List of abbreviations xxii
Chapter 1: Introduction 1
Types of 3D printing techniques 2
Current status of the 3D printing techniques 9
Research aims 11
Overview of the thesis research chapters 13
References 17
Chapter 2: 3D printed metal columns for capillary liquid chromatography 20
Conclusions 25
Acknowledgements 25
Notes and references 25
Supplementary information 27
Chapter 3: 3D printed titanium micro-bore columns containing polymer monoliths for
reversed-phase liquid chromatography 34
Abstract 35
Introduction 36
Experimental section 37
Results and discussion 38
Conclusions 43
Acknowledgement 44
References 44
Chapter 4: Investigating the effect of column geometry on separation efficiency using 3D printed liquid chromatographic columns containing polymer monolithic
phases 50
Abstract 51
Experimental section 52
Results and discussion 53
Conclusions 58
Associated content 58
Author information 58
Acknowledgments 59
References 59
Supplementary information 60
Chapter 5: A new 3D printed radial flow-cell for chemiluminescence detection:
Application in ion chromatographic determination of hydrogen peroxide in urine and
coffee extracts 68
Abstract 69
Introduction 69
Materials and methods 70
Results and discussion 71
Conclusions 78
Acknowledgement 79
References 79
Supporting information 81
LIST OF FIGURES
Chapter 1
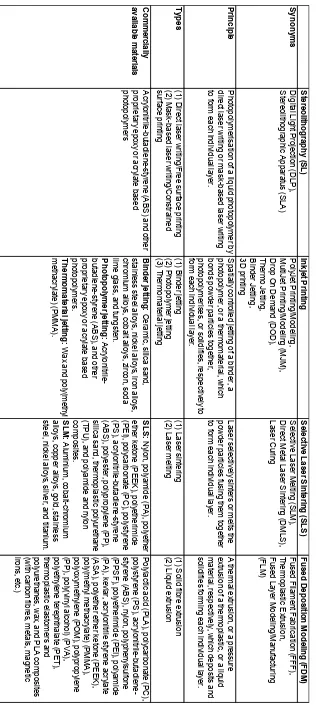
Figure 1. A schematic diagram of the selective laser sintering/melting printer. 6
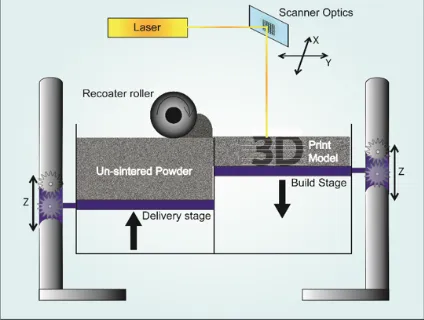
Figure 2. Schematic diagrams of inkjet printers: (a) binder jetting printer and (b) photopolymer
jetting printer. 8
Chapter 2
Figure 1 (a) Representation of spiral columns printed in stainless steel (SS) and titanium, and (b–d) images of exposed internal channels from sectioned SS coiled columns showing surface
roughness of approximately 40 mm. 23
Figure 2 (a) Separation of the phenone mixture: benzophenone, acetophenone, propiophenone, butyrophenone, and valerophenone on ODS packed 3D printed SS columns (0.9 mm I.D. X 60 mm L). Mobile phase: 40% ACN in water, Flow rate: 25 µL min-1, UV detection at 254 nm, Injected volume: 1 µL. (b) The effect of temperature on retention and efficiency of uracil and acetophenone for a 5 µm packed SS column. Temperature was applied through direct contact
Peltier TEC module. 24
Figure 3 (a) BuMA-co-EDMA monolith housed within 3D printed titanium coiled column (at inlet) and (b) the separation of uracil and acetophenone on the 0.8 mm X 60 mm BuMA-co -EDMA polymer monolith. Mobile phase: 70% ACN in water, Flow rate: 5 µL min-1, UV detection at 245 nm, Column temperature: 45 ºC, Injected volume: 10 µL. 24
Figure ESI1. 3D metal printing-selective laser melting (SLM). 27
Figure ESI2. Printed column heating system (version 1), control system and power supply not
shown. Here fitted with SS printed column. 29
Figure ESI3. Printed column heating system (version 2), here fitted with polymer printed
column. 30
Figure ESI4. Van Deemter plot for stainless steel column packed with 5, 10, 20, and 50 μm
particles. 31
Figure ESI5. Separations of phenone mixture upon the SS printed column packed with 5 and
20 μm ODS particles with either 35 or 40% ACN containing mobile phases (25 μL min-1). 32
Figure ESI6. Loading capacity (injection volume) for ODS packed SS printed coiled column (Flow rate: 0.3 µL min-1, Mobile Phase: 35% ACN, Temperature: 65 ºC, Peaks: uracil and
Chapter 3
Figure 1. Design of titanium alloy column hardware: (a) image of the 3D printed column hardware, (b) clear view of the design demonstrating the double handed spiral channel, (c) transverse section demonstrating the three-dimensional orientation of the channel. 39
Figure 2. Channel cross-section and surface roughness profile of the channels: (a) channel dimensions based on approximate circular cross-section, (b) digital microscopic image of the channel, (c) 3D surface profile of the channel obtained from interferometer profilometer
indicating Ra of 23.55 ± 1.14 µm. 39
Figure 3. Direct contact computer controlled Peltier thermoelectric heating/cooling system with triply stacked 30 X 30 mm PTMs and pseudo PID controller providing a Δt max of 200
ºC. 39
Figure 4. Temperature profile for the PTM column heater/cooler platform with attached titanium column (a-b) and stainless steel column (c-d) demonstrating: near real time bidirectional temperature control capability of the system (a and c), magnified view of the step
from 35 ºC to 45 ºC (b and d). 40
Figure 5. SEM imaging of the in-situ prepared poly(BuMA-co-EDMA) monolith in the 3D printed titanium alloy column hardware: (a) transverse section of the column indicating uniform presence of monolith throughout the channel, (b) SEM image of a single channel section indicating conformal coverage of the monolith over rough channel surface, (c) SEM image of the monolithic stationary phase and column wall, (d) SEM image of the monolith structure showing micro globules with interspersed through pores. 42
Figure 6. Column backpressure generated with respect to linear velocity for three different mobile phases: acetonitrile, water, and methanol at 44 ºC. 42
Figure 7. Separation of intact proteins using Δφ = 0-0.40 ACN with tG = 30 min at a flow rate of 0.4 mL min-1 and a temperature of 44 ºC, UV detection was performed at 280 nm. Proteins: ribonuclease A, trypsin inhibitor, cytochrome C, lysozyme, trypsinogen, α-lactalbumin, transferrin, myoglobin, β-lactoglobulin A, β-lactoglobulin B. 42 Fig. 8. Effect of temperature on adjusted retention times for all 10 proteins as follows: ribonuclease A, trypsin inhibitor, cytochrome C, lysozyme, trypsinogen, α-lactalbumin,
transferrin, myoglobin, β-lactoglobulin A, β-lactoglobulin B. 43 Fig. 9. Separation of intact proteins under inverse thermal step gradient with 58 ºC for 0-14 min and 35 ºC for 14-40 min using Δφ = 0-0.40 ACN with tG = 30 min at a flow rate of 0.4 mL min-1 and UV detection at 280 nm: (a) Peltier surface temperature with respect to time, (b) system back-pressure profile reflecting actual change in internal column temperature, (c) chromatogram obtained under given conditions. Proteins: ribonuclease A, trypsin inhibitor,
cytochrome C, lysozyme, trypsinogen, α-lactalbumin, transferrin, myoglobin, β-lactoglobulin
A, β-lactoglobulin B. 44
Figure S.1. A calibration plot of achieved column’s top face temperature with respect to programmed temperature for direct contact computer controlled Peltier thermoelectric
heating/cooling system. 47
Figure S.2. Effect of temperature on separation of intact proteins using Δφ = 0-0.40 ACN with tG = 30 min at a flow rate of 0.4 mL min-1 and indicated temperatures, UV detection was performed at 280 nm. Proteins: ribonuclease A, trypsin inhibitor, cytochrome C, lysozyme, trypsinogen, α-lactalbumin, transferrin, myoglobin, β-lactoglobulin A, β-lactoglobulin B.
48
Figure S.3. Separation of E.coli digest using Δφ = 0-0.60 ACN with tG = 45 min at a flow rate of 0.4 mL min-1 and indicated temperatures. UV detection was performed at 210 nm. 49
Chapter 4
Figure 1. Column renders for the (a) 2D serpentine column, (b) 3D spiral column, and (c) 3D
serpentine column. 53
Figure 2. Column back pressures observed at different linear velocities of MeOH, water, and ACN mobile phases at a column temperature of 44 °C for (a) V1 2D serpentine, 3D spiral, and 3D serpentine monolithic columns and (b) V2 3D spiral and 3D serpentine monolithic columns.
54
Figure 3. Imaging of the BuMA-co-EDMA monolith in the 2D serpentine, 3D spiral, and 3D serpentine columns. Optical image of a transverse section of the 2D serpentine (a), 3D spiral (b), and 3D serpentine (c) columns. SEM micrograph of a channel cross-section of the 2D serpentine (d), 3D spiral (e), and 3D serpentine (f) columns. SEM micrographs of the monolithic bed in the 2D serpentine columns’ channel I (aI), channel II (aII), and channel III
(aIII), 3D spiral columns’ channel I (bI), channel II (bII), and channel III (bIII), and 3D serpentine columns channel I (cI), channel II (cII), and channel III (cIII). 55
Figure 4. Van Deemter plots for (a) V1 2D serpentine, 3D spiral, and 3D serpentine monolithic columns for benzene and acetophenone using 55% ACN/45% water as the mobile phase and (b) V2 3D spiral and 3D serpentine monolithic columns for benzene, acetophenone, xylene, and thiourea using 35% ACN/65% water as the mobile phase. The column temperature was 58 °C and the results were obtained at 254 nm wavelength. 56
Figure 5. Kinetic plots (semilog scale) for V1 2D serpentine, 3D spiral, and 3D serpentine monolithic columns for benzene and acetophenone using 55% ACN/45% water as the mobile phase and a maximum operating pressure of 10 MPa. The column temperature was 58 °C and
the results were obtained at 254 nm wavelength. 56
Figure 6. Computational fluid dynamic simulations in the artificial monolith: (a) artificial monolith in a straight configuration, (b) artificial monolith in a curved configuration, (c) simulated velocity streamlines in the straight monolithic configuration at an inlet velocity of 1 mms−1, and (d) simulated velocity streamlines in the curved monolithic configuration at an inlet
velocity of 1 mms−1. 57
mixture using 55% ACN/45% water, (b) isocratic separations of phenone derivatives mixture using 55% ACN/45% water, (c) gradient separations of benzene derivatives mixture using Δφ = 0.45−0.70 ACN with tG = 30 min, and (d) gradient separations of phenone derivatives mixture
using Δφ = 0.45−0.85 ACN with tG = 25 min. A flow rate of 30 μL min−1 and a column temperature of 58 °C were used. The results were obtained at 254 nm wavelength. Benzene derivatives: benzene, toluene, o-xylene, and naphthalene. Phenone derivatives: acetophenone, propiophenone, butyrophenone, and valerophenone. 57
Figure 8. Separations with the V1 3D serpentine and 3D spiral columns at flow rates of 70 and
30 μL min−1, respectively: (a) isocratic separations of a small molecules mixture using 55% ACN/ 45% water at a column temperature of 67 °C and results obtained at 254 nm wavelength. Small molecules: thiourea, acetophenone, propiophenone, butyrophenone, toluene, o-xylene, and naphthalene and (b) gradient separations of proteins mixture using Δφ = 0−0.50 ACN with tG = 60 min at a column temperature of 58 °C and results obtained at 210 nm wavelength. Proteins: ribonuclease A, cytochrome C, lysozyme, α-lactalbumin, myoglobin, β-lactoglobulin
A, and β-lactoglobulin B. 58
Figure S- 1. Peltier thermoelectric module based heater/cooler system with three peltier chips
programmed through pseudo PID controller. 62
Figure S- 2. Thermal images of the column platform at different time intervals during heating and cooling cycles from 0 °C to 100 °C and 100 °C to 0 °C, respectively. 62
Figure S- 3. Column platform’s (a) rate of heating and a linear model fit and (b) rate of cooling
and an exponential model fit. 62
Figure S- 4. Rate of heating and cooling of 3D printed titanium and 3D printed stainless steel
liquid chromatographic column. 63
Figure S- 5. Imaging of the BuMA-co-EDMA monolith in the 3D serpentine column: Optical image of a transverse section of the 3D serpentine column (a). SEM micrographs of the monolithic bed in the 3D serpentine columns’ channel IV (aIV), channel V (aV), and channel
VI (aVI). 63
Figure S- 6. Computational fluid dynamic simulated velocity contour plots and velocity profiles at a Re of 225: (a) velocity contour plot at midplane of the open tubular 2D serpentine column, (a1) velocity profile at the transverse section marked by 1 in the (a) sub figure, (a2) velocity profile at the transverse section marked by 2 in the (a) sub figure, (b) velocity contour plot at both the planes of the open tubular 3D spiral column, (b1) velocity profile at the transverse section marked by 1 in the (b) sub figure, (b2) velocity profile at the transverse section marked by 2 in the (b) sub figure, (c) velocity contour plot at two of the planes of the open tubular 3D serpentine column, (c1) velocity profile at the transverse section marked by 1 in the (c) sub figure, and (c2) velocity profile at the transverse section marked by 2 in the (c) sub figure.
64
toluene, o-xylene, and naphthalene. Phenone derivatives: acetophenone, propiophenone,
butyrophenone, and valerophenone. 65
Figure S- 8. Isocratic separations of (a) benzene derivatives mixture and (b) phenome derivatives mixture with the V2 3D serpentine and 3D spiral columns as indicated using 35% ACN/65% water as the mobile phase at a flow rate of 10 µL min-1 and a column temperature of 58 °C. The results were obtained at a 254 nm wavelength. Benzene derivatives: benzene, toluene, o-xylene, and naphthalene. Phenone derivatives: acetophenone, propiophenone,
butyrophenone, and valerophenone. 65
Figure S- 9. Isocratic separations of (a) benzene derivatives mixture and (b) phenone derivatives mixture with the V2 3D serpentine and 3D spiral columns as indicated using 35% ACN/65% water as the mobile phase at a flow rate of 30 µL min-1 and a column temperature of 58 °C. The results were obtained at a 254 nm wavelength. Benzene derivatives: benzene, toluene, o-xylene, and naphthalene. Phenone derivatives: acetophenone, propiophenone,
butyrophenone, and valerophenone. 66
Figure S- 10. Gradient separations of (a) benzene derivatives mixture and (b) phenome derivatives mixture with the V2 3D serpentine and 3D spiral columns as indicated using Δφ = 0.20−0.60ACN with tG = 30 min at a flow rate of 30 µL min-1 and a column temperature of 58 °C. The results were obtained at a 254 nm wavelength. Benzene derivatives: benzene, toluene, o-xylene, and naphthalene. Phenone derivatives: acetophenone, propiophenone,
butyrophenone, and valerophenone. 66
Figure S- 11. Gradient reversed-phase liquid chromatographic separations of a mixture of seven proteins using the V1 monolithic columns. The chromatographic separations were performed
using Δφ = 0-0.50 ACN with tG = 60 min at a flow rate of 30 µL min-1 and a column temperature of 58 °C. The results were obtained at a 210 nm wavelength. Proteins: ribonuclease A, cytochrome C, lysozyme, α-lactalbumin, myoglobin, β-lactoglobulin A, and β-lactoglobulin B.
67
Chapter 5
Figure 1. Chemiluminescence flow-cells: (a) render of the 3D printed radial flow-cell and (b)
render of the 3D printed spiral flow-cell. 72
Fig. 2. UV-VIS transmittance of the PolyJet 3D printed 1 mm and 0.1 mm thick chips. 73
Figure 3. Successive FIA injections of 10 µM H2O2 using the PolyJet 3D printed (a) radial
flow-cell and (b) spiral flow-cell. 74
Figure 4. Chemiluminescence FIA system: (a) schematic of the experimental FIA CLD setup, (b) observed chemiluminescence peaks at different luminol concentrations as indicated in mM for three successive injections, (c) observed chemiluminescence peaks at different carrier/reagent pneumatic pressure ratios as indicated for three successive injections, (d) observed chemiluminescence peaks at different carrier and reagent pneumatic pressures in kPa as indicated by the numeral preceding C and R for the carrier and the reagent streams,
Figure 5. Chemiluminescence peak characteristics for the 3D printed radial flow-cell, the coiled-tubing spiral flow-cell, and the 3D printed spiral flow-cell: (a) peak heights at different H2O2 concentrations, the inset shows the magnified view of the peak height v/s concentration plot for the 100, 200, and 400 nM H2O2 concentrations, (b) peak base widths at different H2O2 concentrations, (c) peak return times at different H2O2 concentrations, and (d) representative chemiluminescence peaks at 100 nM, 800 nM, and 3.2 mM as indicated for the 3D printed radial flow-cell, the coiled-tubing spiral flow-cell, and the 3D printed spiral flow-cell. 75
Fig. 6. Computational fluid dynamic simulated velocity streams and velocity contour plots at an inlet flow rate of 800 µL min-1: (a) velocity streamlines in the radial flow-cell design and the representative flow at simulated 0.25 s is marked by velocity colour coded balls, (b) velocity streamlines in the spiral flow-cell design and the representative flow at simulated 0.25 s is marked by velocity colour coded balls, (c) velocity contour plot at mid plane of the radial flow-cell design, and (d) velocity contour plot at mid plane of the spiral flow-flow-cell design. 77
Figure 7. Representative chemiluminescence chromatograms for H2O2 standards with the developed IC-CLD system: 1.25 mM, 2.5 mM, 5 mM, 20 mM, 40 mM, 60 mM, 80 mM, and
100 mM. 77
Figure 8. Effects of different sample treatment steps in the analysis of urinary H2O2: (a) chemiluminescence peaks obtained after direct injection of a fresh urine sample in the FIA CLD system for three successive injections, (b) chemiluminescence chromatogram obtained after direct injection of a fresh urine sample in the IC-CLD system, (c) chemiluminescence chromatogram obtained after injection of the supernatant from a centrifuged urine sample, and (d) chemiluminescence and UV recorded chromatograms obtained after injection of a 5-sulfosalicylic acid protein precipitated supernatant of a centrifuged urine sample. 78
Figure 9. Chemiluminescence and UV recorded chromatograms obtained after injection of a fresh coffee extract sample in the IC-CLD system. 79
Figure S-1. 3D printed flow-cell black box’s two halves and the flow cell in the open and the
closed configuration. 82
Figure S-2. Chemiluminescence peak height at different H2O2 concentrations for the 3D printed radial flow-cell, the coiled-tubing spiral flow-cell, and the 3D printed spiral flow-cell. 82
by 11 in the (a) sub figure, (m) velocity profile at the transverse section marked by 12 in the (a) sub figure, (n) velocity profile at the transverse section marked by 13 in the (a) sub figure, (o) velocity profile at the transverse section marked by 14 in the (a) sub figure, (p) velocity profile at the transverse section marked by 15 in the (a) sub figure, (q) velocity profile at the transverse section marked by 16 in the (a) sub figure. 89
Figure S- 5. Computational fluid dynamic simulated velocity contour plots and velocity profiles in the spiral flow-cell design at an inlet flow rate of 800 µL min-1: (a) velocity contour plot at the midplane, (b) velocity profile at the transverse section marked by 1 in the (a) sub figure, (c) velocity profile at the transverse section marked by 2 in the (a) sub figure, (d) velocity profile at the transverse section marked by 3 in the (a) sub figure, (e) velocity profile at the transverse
section marked by 4 in the (a) sub figure. 91
Figure S- 6. Analysis of an unknown H2O2 sample with the FOX assay and the here developed
List of Tables
Chapter 1
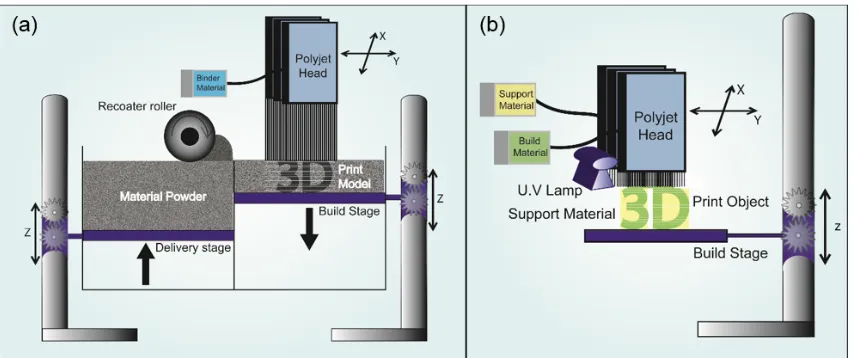
Table 1. Properties of the stereolithography, inkjet printing, selective laser sintering, and
fused deposition modeling 3D printing techniques. 3
Chapter 2
Table 1. Plates per meter and optimal flow rate per particle size for ODS packed 3D printed
SS columns (0.9 mm I.D. X 60 mm L). 23
Chapter 3
Table 1. Solvent characteristics and permeability coefficients for prepared titanium housed
BuMA-co-EDMA monolith at 44 ºC. 41
Table 2. Change in resolution between consecutive pair of proteins with the change in
temperature. 43
Chapter 4
Table 1. Linear velocity based permeability coefficients (Kp,f) of monoliths in the 2D serpentine, 3D spiral, and 3D serpentine columns using MeOH, Water, and ACN Mobile
Phases. 54
Table 2. Resolutions obtained between each pair of the adjoining peaks with the V1 3D serpentine and 3D spiral columns for the small molecules mixture and the proteins mixture
under conditions as per Figure 7. 58
Table S- 1. Slopes and intercepts for the linear fit (R2 > 0.99) of the back pressures observed for the 2D serpentine column (V1), 3D spiral column (V1), 3D serpentine column (V1), 3D spiral column (V2), and 3D serpentine column (V2) with respect to different linear velocities
of MeOH, water, and ACN mobile phases. 63
Table S- 2. Resolutions between each pair of the adjoining peaks for the benzene derivatives mixture and the phenome derivatives mixture with the V1 3D serpentine, 3D spiral, and 2D serpentine columns. Isocratic separations were performed using 55% ACN/45% water as the
mobile phase, a flow rate of 30 μL min-1, and a column temperature of 58 °C. The results
were obtained at a 254 nm wavelength. 65
of 30 μL min-1, and a column temperature of 58 °C was used. The results were obtained at a
254 nm wavelength. 66
Chapter 5
Table 1. Comparison of the peak characteristics obtained with the 3D printed radial flow-cell, the coiled-tubing spiral flow-cell, and the 3D printed spiral flow-cell at six different H2O2
concentrations. 75
LIST OF ABBREVIATIONS
3D MADe: 3D printed miniaturised analytical devices
BuMA-co-EDMA: poly(butyl methacrylate-co-ethylene glycol dimethacrylate) PS-DVB: poly(styrene-co-divinylbenzene)
RPLC: reversed-phase liquid chromatography HPLC: high-performance liquid chromatography GC: gas chromatography
CE: capillary electrophoresis CZE: capillary zone electrophoresis CFD: computational fluid dynamic CLD: chemiluminescence detection
IC-CLD: ion chromatography coupled chemiluminescence detection SL: stereolithography
SLS: selective laser sintering SLM: selective laser melting FDM: fused deposition modeling ABS: acrylonitrile butadiene styrene PLA: poly(lactic acid)
SS: stainless steel
FSC: fused silica capillary
ϒ-MAPS: 3-trimethoxysilylpropyl methacrylate AIBN: azobisisobutyronitrile
PTFE: polytetrafluoroethylene ODS: octadecyl silica
α-Lal: α-lactalbumin Tf: transferrin My: myoglobin β-Lac: β -lactoglobulin
PTM: Peltier thermoelectric module PID: proportional–integral–derivative UNF: unified fine pitch threads
RANS: Reynolds-averaged Navier-Stokes SST: shear stress transport
FIA: flow injection analysis PMT: photomultiplier tube
FOX: ferrous oxidation-xylenol orange 3DP RFC: 3D printed radial flow-cell SFC: spiral flow-cell
Chapter 1:
INTRODUCTION
The miniaturisation of analytical devices continues to receive significant research interest,
because of the widespread potential of such miniaturised analytical devices in various
applications, which in recent times has included real-time environmental monitoring1-2,
detection of explosives and other warfare agents at sensitive sites3, personal medical
diagnosis4, and online monitoring of various processes parameters and hazards5. The
production of these functional miniaturised analytical devices often requires fabrication of
three-dimensionally oriented micro- and milli-fluidic channels. However, conventional
manufacturing techniques, such as photolithography, milling, etching, and injection moulding
demand alignment and bonding of multiple components to achieve these goals. This renders
the conventional fabrication process cumbersome, and often inefficient in terms of the time
and cost. Moreover, lithographic techniques require (1) the use of hazardous chemicals, (2)
long processing times, (3) expensive clean-room facilities, and (4) highly skilled labour. A
relatively recent technology that looks set to revolutionise such procedures is that of 3D
printing. 3D printing techniques can offer (1) the ability to directly fabricate complex
three-dimensionally oriented geometries, (2) cost and time effective production, (3) relative ease of
use, (4) minimisation of the material wastage, (5) hazardous chemicals free procedure, (6) a
“fail fast and often”6 approach for prototyping, customisation, and testing, and (7) the
production of monolithically integrated devices. This makes 3D printing a potentially highly
3D printing was first patented by Charles Hull in 19867, and following its introduction, this
technique has been extensively used in almost all fields of research and manufacturing, such
as biotechnology and life sciences8-9, engineering10, robotics11, arts12, and food sciences13, to
name but a few. Whitesides group reported the first use of a 3D printing technique (PolyJet
printing) to fabricate three-dimensional microfluidic devices14 in 2002. Since then different
3D printing techniques have been increasingly used in the wider fields of chemical sciences15.
Types of 3D Printing Techniques
The most commonly and widely used 3D printing techniques to-date are stereolithography
(SL), inkjet printing, selective laser sintering (SLS), and fused deposition modeling (FDM).
The details and principles behind each of these techniques are compared and contrasted in
Table 1. Apart from the above-listed techniques, other less commonly used 3D printing
techniques include, but are not limited to, laminated object manufacturing, two-photon
lithography, micro-3D writing, and direct-ink writing. In this research work, two of the
above-mentioned 3D printing techniques, namely SLS and inkjet printing were used, which
Selective laser sintering
Selective laser sintering/melting (SLS/M) techniques employ laser rastering on a powder bed
to sinter or melt the required powder particles to fuse them together, as shown in Figure 1. An
SLS/M process starts by rolling a layer of powder particles, which is then exposed to a laser
as per the desired layer geometry. The laser increases the local bed temperature to either
slightly below the melting point (for sintering) or above the melting point (for melting) of the
powder particles. The sintered or melted powder particles fuse together to form the solid
components of a layer, and the unfused particles act as a support material for the following
layers. Completion of each individual layer is followed by lowering of the build platform and
rising of the delivery platform by a specified step size, which is defined by the layer
thickness. This allows the next layer of powder particles to be rolled down to repeat the same
process for the consecutive layers, hence forming the desired 3D structure as shown in Figure
1. The final printed part is obtained from the powder bed, and it is post-processed to remove
the unbound particles by dusting off with compressed air, blasting off with sand particles or
glass beads, and/or taping and sonication.
As indicated above, the SLS 3D printing technique can be classified as selective laser
sintering (SLS) or selective laser melting (SLM) techniques. As the name suggests, the
former involves sintering of the powder particles (usually polymers), and the latter involves
melting of the powder particles (usually metals). In both SLS and SLM techniques, the x and
y resolution is dependent on the size of the powder particles and the laser spot, and the z
resolution is dependent on the step size. These techniques offer various advantages, such as
(1) the ability to print in a wide range of polymeric and metallic materials, (2) the high purity
and high mechanical strength of the printed parts due to a strong thermal fusion between their
techniques also suffer from a few limitations, such as (1) the higher cost of SLS/M printers
and materials as compared to other 3D printing techniques, (2) the shrinkage and/or
[image:29.595.191.403.212.372.2]deformation of the printed parts, because of high thermal stress17, and (3) a slow printing process.
Figure 1. A schematic diagram of the selective laser sintering/melting printer.
Inkjet printing
3D inkjet printers are based on the similar principles to those of the most commonly used 2D
inkjet printers. They both modulate the spatial and temporal jetting of inks from their
respective print heads. However, 3D inkjet printer’s print heads can supply a liquid binder, a
photopolymer, or a thermomaterial on pre-specified spots in a layer-by-layer fashion. Based
on the type of inks used, 3D inkjet printers can be classified as binder jetting, photopolymer
jetting, or thermomaterial jetting printers.
Binder jetting printers are powder-based systems, similar to the SLS/M printers. Their print
process begins by rolling a fine layer of powder from the powder bed onto the build platform
with the help of rollers as shown in Figure 2 (a). The powder layer is then selectively exposed
powder particles together to form the solid components of a layer. The unbound powder
particles act as a support material for the following layers. Completion of each individual
layer is followed by lowering of the build platform and rising of the delivery platform by a
specified step size, which is defined by the layer thickness. This allows the next layer of
powder particles to be rolled down to repeat the same process for the consecutive layers,
hence forming the desired 3D structure as shown in Figure 2 (a). The binder jetting printers
offer an advantage that they allow the use of a wide variety of print materials (as listed in
Table 1), because of their ability to use foreign binder liquids. However, they suffer from
various limitations, such as (1) the x and y resolutions are dependent on the particle size of
the powders (50 – 100 µm), and the z resolution is typically 200 µm18, (2) the physical and chemical properties of the binders dominate the properties of the printed object, and (3) the
printed objects suffer from material heterogeneity and bulk defects, because of the
incomplete binding of powder particles, which limits their optical clarity and mechanical
strength19.
The photopolymer and thermomaterial jetting printers allow higher print resolution as
compared to the binder jetting printers, because of their use of liquid precursors as opposed to
the powder particles. These printers provide an x and y resolution of ca. 40 µm and a z
resolution of ca. 16 µm20. A photopolymer or thermomaterial printing process starts with the jetting of build and support materials from their respective print heads as per the desired layer
geometry. The jetted photopolymer or thermomaterial is UV polymerised or allowed to cool
down on the build platform, respectively to form the solid components a layer. Completion of
each individual layer is followed by lowering of the build platform to repeat the same process
for the consecutive layers, hence forming the desired 3D structure as shown in Figure 2 (b).
compared to the binder jetting printers, (2) ease of multi-material and multi-colour printing,
via their ability to switch between different materials by using multiple print heads, (3) the
ability to fabricate complex structures, from the use of dense support materials, and (4) the
ability to fabricate mechanically more robust and optically more transparent parts, resulting
from their better polymerisation and higher resolution capabilities as compared to the binder
jetting printers. However, both photopolymer and thermomaterial jetting printers also suffer
from a few limitations, such as (1) the limited availability of build materials, (2) the limited
material customisation capabilities, because of the risk of blocking print heads, and (3) the
requirement of long and tedious post-processing steps to remove the dense support material
[image:31.595.86.516.374.553.2]from complex geometries21.
Figure 2. Schematic diagrams of inkjet printers: (a) binder jetting printer, (b) photopolymer
jetting printer.
Most of the 3D printing techniques are only a decade or two old and are still in their relative
infancy stages with respect to technological capabilities. However, they are rapidly evolving,
and their capabilities and functionalities are being constantly improved. Some of the current
overcoming them are discussed below. This following section should help one to assess the
current status and a future possible trajectory of the field of 3D printing.
Current status of the 3D printing techniques
Currently, the highest available 3D printing resolution is 50 µm in the x and y direction and 5
µm in the z direction with the use of SL printers, and it is many folds lower for the FDM (x,
y, and z resolution of ca. 100 µm) and SLS (x, y, and z resolution of ca. 150 µm) printers.
Note that depending on the geometry, the minimum possible size of a printed feature can be
much larger than the specified print resolution. The resolution of different 3D printing
techniques is being constantly improved, and a significant improvement in resolution has
been observed especially for the SL and FDM printers over the past few years. The resolution
of the SL printers can be further improved by using high definition projectors, reduction of
the exposure light’s focus depth, and optimisation of the exposure time, polymerisation
wavelength, and printing power22. Improvements in the 3D printing resolution should allow (1) the ability to produce narrow channels, (2) higher optical transparency of the printed
objects, and (3) reduction of the ‘backside’23 effect.
The most commonly used polymers with the FDM, SL, and PolyJet 3D printing techniques
are currently limited to acrylates, acrylonitrile butadiene styrene (ABS), and poly(lactic acid)
(PLA). However, the list of 3D printable materials is constantly increasing by incorporation
customised material, which makes them a preferred choice to develop new customised
materials.
Multi-material printing capabilities are currently only limited to the FDM and PolyJet
printing techniques, however, efforts have also been made to allow similar capabilities with
the SL printing techniques31. Multi-material printing can allow monolithic fabrication of objects that require simultaneous use of a variety of materials, such as anatomical models that
require hard and elastic materials, optical components that require opaque and transparent
materials, electronic components that require conductive and non-conductive materials, and
educational models that require different coloured materials, to name but a few. Moreover,
efforts are also being made to allow direct printing on foreign materials, such as cartilage
printing on bones32.
SL and PolyJet printed parts often suffer from poor biocompatibility. This is primarily due to
the incomplete UV polymerisation, which leads to poor bonding, and hence leaching of toxic
free radicles. The biocompatibility of these 3D printed polymeric parts is shown to be
improved through post-curing steps33. Various commercial and non-commercial biocompatible materials have also been used for 3D printing, such as MED610 (Stratasys)34 and hydrogels29.
The fabrication of complex and long closed channels is still difficult with any of the
above-mentioned 3D printing techniques. The FDM and SL printing techniques result in a collapse
of long closed channels, because of the absence of any solid support material. Whereas, the
the solid support material from the closed channels21. Recently, water-soluble support materials such as SUP707 (Stratasys) (as described in Chapter 5) have been introduced to
allow easier removal of the solid support material from the PolyJet printed parts.
All the health, environmental, and safety issues associated with different 3D printing
techniques still remains to be explored, however, some concerning reports have been
published recently35. 3D printing techniques such as FDM, which are most commonly and widely used in homes have been demonstrated to release harmful fumes during the printing
process36, and the disposal of SL and PolyJet printed parts has been demonstrated to be harmful to the environment33, 37. Accordingly, the need for standardisation and regulation of the 3D printing raw materials has been recognised35. However, the total assessment of the societal impact of 3D printing techniques still remains to be a topic of research and
discussion37.
Research aims
The research aims were (1) to obtain a better understanding of the capabilities and potential
of different 3D printing techniques to fabricate three-dimensional micro- and milli-fluidic
channels, (2) to investigate the effects of different three-dimensional channel arrangements
on the performances of different miniaturised analytical devices, and (3) to use the obtained
knowledge to develop new functional 3D printed miniaturised analytical devices (3D
Conventional fabrication techniques have inherently limited the production of miniaturised
analytical devices to two-dimensional micro- and milli-fluidics. Moreover, these fabrication
techniques have restricted the access of life-scientists and chemistry personnel to the
microfluidic capabilities. As discussed above, 3D printing techniques can overcome these
challenges while offering new possibilities and opportunities in the field of chemical
sciences. However, there is limited understanding of the use of 3D printing techniques and
three-dimensional fluidic channels in the field of chemical sciences, because of their
relatively recent introduction. Accordingly, in this thesis, the use of 3D printing techniques
and three-dimensional fluidics has been investigated with regard to the benefits they can offer
in the production of miniaturised analytical devices. Furthermore, the use of 3D printing
techniques has been studied to fabricate these devices using advanced materials such as
titanium alloy (Ti-6Al-4V).
Throughout this thesis, several research questions have been addressed as some of them listed
below: How currently available 3D printing capabilities can be used to fabricate functional
miniaturised analytical devices? How do the choice of 3D printing technique and the build
material affect the production and the performance of these devices? How can
dimensional channel coiling be used to miniaturise analytical devices? How can
three-dimensional channel arrangement be used to improve the performance of these miniaturised
analytical devices? How does three-dimensional channel geometry can affect various
hydrodynamic properties and hence functionalities of these devices? The knowledge and
understanding gathered from these investigations are used to fabricate new functional 3D
printed miniaturised analytical devices. Their use has been described to perform various
analytical operations, such as liquid chromatographic separations and chemiluminescence
for most of the developed three-dimensional fluidic designs to obtain a better understanding
of the hydrodynamic properties of their respective analytical devices.
The work presented in this thesis should provide the groundwork for the future development
of other 3D printed miniaturised analytical devices, and it should encourage the use of 3D
printing techniques and three-dimensional fluidic channels in the wider fields of chemical
sciences.
Overview of the thesis research chapters
Miniaturised liquid chromatographic columns can facilitate the production of portable
high-performance liquid chromatographic (HPLC) systems. Currently, miniaturised
chromatographic columns are fabricated by subtractive manufacturing techniques, such as
dry and wet etching38. As discussed above, these techniques are limited to two-dimensional fabrication, and they use hazardous chemicals and/or processes. These limitations can be
overcome with the use of 3D printing techniques to fabricate miniaturised capillary liquid
chromatographic columns.
3D printing was previously used by Fee et al.39 in 2014 to fabricate LC columns integrated
with customised porous beds, internal flow distributors, and external fluid connectors.
Furthermore, in the same year, Vonk et al.40 had also reported 3D printed titanium-scaffolded narrow-bore columns to prevent the collapse of organic monoliths by fabricating titanium
scaffolds within square conduits. However, the use of 3D printing techniques to fabricate
In Chapter 2, for the first time SLM 3D printing technique has been used to fabricate
three-dimensionally coiled liquid chromatographic columns. The SLM technique was used to
fabricate 600 mm long, 0.9 mm I.D. stainless steel (316L) and titanium alloy (Ti-6Al-4V)
columns within a footprint of 5 × 30 × 30 mm. The work presented in Chapter 2 indicates the
potential of SLM technique to fabricate miniaturised and robust liquid chromatographic
columns.
This Chapter is published in the Analyst (2014, 139 (24), 6343-6347).
Currently, SLM techniques suffer from a low printing resolution as described above. This
resulted in a low chromatographic performance of the slurry packed LC columns, because of
their high (20 µm) channel wall roughness, as also described in Chapter 2.
In Chapter 3, the use of titanium wall bonded organic monolith is described to circumvent the
limitation of channel wall roughness, and hence produce the first functional 3D printed coiled
liquid chromatographic column. The SLM technique was used to fabricate a titanium alloy
(Ti-6Al-4V) column, which was functionalised with in-column thermally polymerised and
wall bonded poly(BuMA-co-EDMA) monolith. Titanium was selected as a suitable candidate
for the fabrication of monolithic chromatographic columns because of its favourable
chemical properties and high thermal conductivity. Thermally oxidised titanium channel
walls were silanised to form a stable covalent bond with the acrylate monolith. The work
presented in Chapter 3 indicates that 3D printed titanium columns with wall bonded organic
and (2) generating rapid bi-directional heating/cooling cycles for steep temperature gradient
liquid chromatographic separations.
This Chapter is published in the Analytica Chimica Acta (2016, 910, 84-94).
In Chapter 4, the first study of the effect of 3D column geometry on liquid chromatographic
separations in the presence of a stationary phase is described. The effect of column geometry
on the chromatographic efficiency, particularly in the case of packed and monolithic
columns, and more particularly in the case of liquid chromatographic separations has
remained unclear. Accordingly, three chromatographic column geometries, namely (i) a 2D
serpentine, (ii) a 3D spiral, and (iii) a novel 3D serpentine were developed to study these
effects. Chapter 4 describes (1) their functionalisation with in-column thermally polymerised
poly(BuMA-co-EDMA) monoliths, (2) their comparative performances for liquid
chromatographic separations of small and large molecules, (3) insights into the effect of
column geometry using computational fluid dynamic (CFD) simulations, and (4) their liquid
chromatographic separation efficiencies under isocratic and gradient conditions.
This Chapter is published in the Analytical Chemistry (DOI:10.1021/acs.analchem.7b03778).
Chemiluminescence detection (CLD) systems require simple instrumentation and provide
extremely high sensitivity for at least some analytes, which makes them a suitable candidate
for miniaturised analytical devices. A Flow-cell plays a significant role in determining the
sensitivity and reproducibility of the CLD systems. Usually, CLD flow-cells are fabricated by
flat spirals due to their rigid nature47. Whereas, milling/etching techniques require an additional channel sealing procedure, lack three-dimensional fabrication, and require time
and labour intensive steps. These limitations can be overcome with the use of 3D printing
techniques to fabricate CLD flow-cells.
PolyJet 3D printing technique was first used for the fabrication of CLD flow-cells by
Spilstead et al.21 in 2014. However, this preliminary investigation used the conventional spiral flow-cell design. The use of coiled spiral flow-cell design resulted in channels with
only partially cleared support material and hence led to significant flow-cell staining. In order
to obtain clear channels, open channels were printed, which were later sealed with transparent
films21. This requires design and fabrication of a new less convoluted flow-cell design to allow successful PolyJet printing of closed channel flow-cells.
In Chapter 5, design and development of a new and improved CLD flow-cell is described.
The new flow-cell was designed by diverging multiple linear channels from a common centre
port in a radial arrangement, and hence it was named as a ‘radial’ flow-cell. Fabrication of
this flow-cell with the PolyJet printing and FDM techniques was studied. Chapter 5 describes
the design, development, and evaluation of the radial flow-cell by (1) comparing its ease of
fabrication and CLD performance with its counterpart 3D printed and polymer tubing spiral
flow-cells, (2) investigating its fluidic properties through CFD simulations, and (3)
developing a rapid and automated assay for the analysis of H2O2 in urine and coffee extract
samples.
REFERENCES
1. Hwang, H.; Kim, Y.; Cho, J.; Lee, J.-y.; Choi, M.-S.; Cho, Y.-K., Lab-on-a-disc for simultaneous determination of nutrients in water. Analytical chemistry 2013,85 (5), 2954-2960.
2. Shu, B.; Zhang, C.; Xing, D., Highly sensitive identification of foodborne pathogenic Listeria monocytogenes using single-phase continuous-flow nested PCR microfluidics with on-line
fluorescence detection. Microfluidics and nanofluidics 2013,15 (2), 161-172.
3. Piorek, B. D.; Lee, S. J.; Moskovits, M.; Meinhart, C. D., Free-surface microfluidics/surface-enhanced Raman spectroscopy for real-time trace vapor detection of explosives. Analytical chemistry 2012,84 (22), 9700-9705.
4. Reboud, J.; Bourquin, Y.; Wilson, R.; Pall, G. S.; Jiwaji, M.; Pitt, A. R.; Graham, A.; Waters, A. P.; Cooper, J. M., Shaping acoustic fields as a toolset for microfluidic manipulations in diagnostic technologies. Proceedings of the National Academy of Sciences 2012,109 (38), 15162-15167. 5. Karande, A. D.; Heng, P. W. S.; Liew, C. V., In-line quantification of micronized drug and excipients in tablets by near infrared (NIR) spectroscopy: Real time monitoring of tabletting process. International journal of pharmaceutics 2010,396 (1), 63-74.
6. Rogers, C. I.; Qaderi, K.; Woolley, A. T.; Nordin, G. P., 3D printed microfluidic devices with integrated valves. Biomicrofluidics 2015,9 (1), 016501.
7. Hull, C. W., Apparatus for production of three-dimensional objects by stereolithography. Google Patents: 1986.
8. Peltola, S. M.; Melchels, F. P.; Grijpma, D. W.; Kellomäki, M., A review of rapid prototyping techniques for tissue engineering purposes. Annals of medicine 2008,40 (4), 268-280.
9. Murphy, S. V.; Atala, A., 3D bioprinting of tissues and organs. Nature biotechnology 2014,32 (8), 773-785.
10. Marks, P., 3D printing takes off with the world's first printed plane. NewScientist 2011,211 (2823), 17-18.
11. Bartlett, N. W.; Tolley, M. T.; Overvelde, J. T.; Weaver, J. C.; Mosadegh, B.; Bertoldi, K.; Whitesides, G. M.; Wood, R. J., A 3D-printed, functionally graded soft robot powered by combustion. Science 2015,349 (6244), 161-165.
12. Allard, T.; Sitchon, M.; Sawatzky, R.; Hoppa, R. In Use of hand-held laser scanning and 3d printing for creation of a museum exhibit, 6th International Symposium on Virtual Reality, Archaelogy and Cultural Heritage, 2005.
13. Sun, J.; Peng, Z.; Zhou, W.; Fuh, J. Y.; Hong, G. S.; Chiu, A., A review on 3D printing for customized food fabrication. Procedia Manufacturing 2015,1, 308-319.
14. McDonald, J. C.; Chabinyc, M. L.; Metallo, S. J.; Anderson, J. R.; Stroock, A. D.; Whitesides, G. M., Prototyping of microfluidic devices in poly (dimethylsiloxane) using solid-object printing.
Analytical chemistry 2002,74 (7), 1537-1545.
15. Gross, B. C.; Erkal, J. L.; Lockwood, S. Y.; Chen, C.; Spence, D. M., Evaluation of 3D printing and its potential impact on biotechnology and the chemical sciences. Analytical chemistry 2014,86 (7), 3240-3253.
16. Gupta, V.; Talebi, M.; Deverell, J.; Sandron, S.; Nesterenko, P. N.; Heery, B.; Thompson, F.; Beirne, S.; Wallace, G. G.; Paull, B., 3D printed titanium micro-bore columns containing polymer monoliths for reversed-phase liquid chromatography. Analytica chimica acta 2016,910, 84-94. 17. Wang, R.-J.; Wang, L.; Zhao, L.; Liu, Z., Influence of process parameters on part shrinkage in SLS. The International Journal of Advanced Manufacturing Technology 2007,33 (5), 498-504. 18. Pfister, A.; Landers, R.; Laib, A.; Hübner, U.; Schmelzeisen, R.; Mülhaupt, R., Biofunctional rapid prototyping for tissue-engineering applications: 3D bioplotting versus 3D printing. Journal of Polymer Science Part A: Polymer Chemistry 2004,42 (3), 624-638.
20. de Gans, B. J.; Duineveld, P. C.; Schubert, U. S., Inkjet printing of polymers: state of the art and future developments. Advanced materials 2004,16 (3), 203-213.
21. Spilstead, K. B.; Learey, J. J.; Doeven, E. H.; Barbante, G. J.; Mohr, S.; Barnett, N. W.; Terry, J. M.; Hall, R. M.; Francis, P. S., 3D-printed and CNC milled flow-cells for chemiluminescence detection. Talanta 2014,126, 110-115.
22. Donvito, L.; Galluccio, L.; Lombardo, A.; Morabito, G.; Nicolosi, A.; Reno, M., Experimental validation of a simple, low-cost, T-junction droplet generator fabricated through 3D printing. Journal of Micromechanics and Microengineering 2015,25 (3), 035013.
23. Waldbaur, A.; Rapp, H.; Laenge, K.; Rapp, B. E., Let there be chip—towards rapid prototyping of microfluidic devices: one-step manufacturing processes. Analytical Methods 2011,3 (12), 2681-2716.
24. Ahn, S.-H.; Lee, K.-T.; Kim, H.-J.; Wu, R.; Kim, J.-S.; Song, S.-H., Smart soft composite: An integrated 3D soft morphing structure using bend-twist coupling of anisotropic materials. International Journal of Precision Engineering and Manufacturing 2012,13 (4), 631-634.
25. Ahn, B. Y.; Duoss, E. B.; Motala, M. J.; Guo, X.; Park, S.-I.; Xiong, Y.; Yoon, J.; Nuzzo, R. G.; Rogers, J. A.; Lewis, J. A., Omnidirectional printing of flexible, stretchable, and spanning silver microelectrodes. Science 2009,323 (5921), 1590-1593.
26. Kalsoom, U.; Nesterenko, P. N.; Paull, B., Recent developments in 3D printable composite materials. RSC Advances 2016,6 (65), 60355-60371.
27. Nadgorny, M.; Xiao, Z.; Chen, C.; Connal, L. A., Three-Dimensional Printing of pH-Responsive and Functional Polymers on an Affordable Desktop Printer. ACS applied materials & interfaces 2016, 8 (42), 28946-28954.
28. Colosi, C.; Shin, S. R.; Manoharan, V.; Massa, S.; Costantini, M.; Barbetta, A.; Dokmeci, M. R.; Dentini, M.; Khademhosseini, A., Microfluidic Bioprinting of Heterogeneous 3D Tissue Constructs Using Low-Viscosity Bioink. Advanced Materials 2016,28 (4), 677-684.
29. Hockaday, L.; Kang, K.; Colangelo, N.; Cheung, P.; Duan, B.; Malone, E.; Wu, J.; Girardi, L.; Bonassar, L.; Lipson, H., Rapid 3D printing of anatomically accurate and mechanically heterogeneous aortic valve hydrogel scaffolds. Biofabrication 2012,4 (3), 035005.
30. Li, J.; Ye, F.; Vaziri, S.; Muhammed, M.; Lemme, M. C.; Östling, M., Efficient inkjet printing of graphene. Advanced materials 2013,25 (29), 3985-3992.
31. Zhou, C.; Chen, Y.; Yang, Z.; Khoshnevis, B. In Development of multi-material mask-image-projection-based stereolithography for the fabrication of digital materials, Annual solid freeform fabrication symposium, Austin, TX, 2011.
32. D O’Connell, C.; Di Bella, C.; Thompson, F.; Augustine, C.; Beirne, S.; Cornock, R.; Richards, C. J.; Chung, J.; Gambhir, S.; Yue, Z., Development of the Biopen: a handheld device for surgical printing of adipose stem cells at a chondral wound site. Biofabrication 2016,8 (1), 015019.
33. Oskui, S. M.; Diamante, G.; Liao, C.; Shi, W.; Gan, J.; Schlenk, D.; Grover, W. H., Assessing and reducing the toxicity of 3D-printed parts. Environmental Science & Technology Letters 2015,3 (1), 1-6.
34. Sayyar, S.; Murray, E.; Thompson, B.; Chung, J.; Officer, D. L.; Gambhir, S.; Spinks, G. M.; Wallace, G. G., Processable conducting graphene/chitosan hydrogels for tissue engineering. Journal of Materials Chemistry B 2015,3 (3), 481-490.
35. Jeremy, F.; Cindy, B.; Suraj, B.; Myles, I., Comparing environmental impacts of additive manufacturing vs traditional machining via life-cycle assessment. Rapid Prototyping Journal 2015,21 (1), 14-33.
36. Bharti, N., 3D Printing in Makerspaces: Health and Safety Concerns. Issues in Science and Technology Librarianship 2017.