http://eprints.whiterose.ac.uk/110277/
Version: Accepted Version
Article:
Dean, R., Wright, A.E., Marsh-Rollo, S.E. et al. (3 more authors) (2017) Sperm competition
shapes gene expression and sequence evolution in the ocellated wrasse. Molecular
Ecology, 26 (2). pp. 505-518. ISSN 0962-1083
https://doi.org/10.1111/mec.13919
This is the peer reviewed version of the following article: Dean, R. et al, Sperm competition
shapes gene expression and sequence evolution in the ocellated wrasse, Molecular
Ecology (2017) 26, 505–518, which has been published in final form at
https://doi.org/10.1111/mec.13919. This article may be used for non-commercial purposes
in accordance with Wiley Terms and Conditions for Self-Archiving.
[email protected] https://eprints.whiterose.ac.uk/
Reuse
Unless indicated otherwise, fulltext items are protected by copyright with all rights reserved. The copyright exception in section 29 of the Copyright, Designs and Patents Act 1988 allows the making of a single copy solely for the purpose of non-commercial research or private study within the limits of fair dealing. The publisher or other rights-holder may allow further reproduction and re-use of this version - refer to the White Rose Research Online record for this item. Where records identify the publisher as the copyright holder, users can verify any specific terms of use on the publisher’s website.
Takedown
If you consider content in White Rose Research Online to be in breach of UK law, please notify us by
Sperm competition shapes gene expression and sequence evolution in the ocellated 1
wrasse 2
3
Running title: Sperm competition shapes gene evolution 4
5
6
Rebecca Dean1,2†, Alison E. Wright1, Susan E. Marsh-Rollo3,4, Bridget M. Nugent5,6, Suzanne 7
H. Alonzo3,5*, Judith E. Mank1* 8
9
1Department of Genetics, Evolution and Environment, University College London
10
2
School of Biological Sciences, Monash University, Clayton, Victoria, Australia 11
3
Department of Ecology and Evolutionary Biology, University of California Santa Cruz 12
4Department of Psychology, McMaster University
13
5
Department of Ecology and Evolutionary Biology, Yale University 14
6
Department of Biomedical Sciences, University of Pennsylvania 15
*Co- senior authors 16
†
Correspondence: [email protected] 17
18
Keywords: masculinization, alternative reproductive tactics, morphs, positive selection, 19
ABSTRACT 21
Gene expression differences between males and females often underlie sexually dimorphic 22
phenotypes and the expression levels of genes that are differentially expressed between the 23
sexes is thought to respond to sexual selection. Most studies on the transcriptomic response 24
to sexual selection treat sexual selection as a single force, but post-mating sexual selection 25
in particular is expected to specifically target gonadal tissue. The three male morphs of the 26
ocellated wrasse (Symphodus ocellatus) make it possible to test the role of post-mating 27
sexual selection in shaping the gonadal transcriptome. Nesting males hold territories and 28
have the highest reproductive success, yet we detected feminisation of their gonadal gene 29
expression compared to satellite males. Satellite males are less brightly coloured and 30
experience more intense sperm competition than nesting males. In line with post-mating 31
sexual selection affecting gonadal gene expression, we detected a more masculinised 32
expression profile in satellites. Sneakers are the lowest quality males and showed both de-33
masculinisation and de-feminisation of gene expression. We also detected higher rates of 34
gene sequence evolution of male-biased genes compared to unbiased genes, which could at 35
least in part be explained by positive selection. Together, these results reveal the potential 36
for post-mating sexual selection to drive higher rates of gene sequence evolution and shape 37
the gonadal transcriptome profile. 38
INTRODUCTION 40
Males and females within a species share the majority of the genome. Even in species with 41
sex chromosomes, the sex-limited Y or W chromosome (in XY or ZW sex determination 42
systems) is typically small and contains few genes (Skaletsky, et al. 2003; Koerich, et al. 43
2008). Therefore, many sexually dimorphic traits are the product of differences in regulation 44
of loci present in both sexes (Dean and Mank 2016). Accordingly, just as many phenotypic 45
traits differ substantially between the sexes, many genes show expression differences 46
between females and males (Parsch and Ellegren 2013). These sex-biased genes are often 47
viewed as the link between mating system, sexual selection and sexual dimorphism (Mank 48
et al 2013). 49
Sexually dimorphic gene expression has recently been shown to respond to sexual selection 50
across populations (Moghadam, et al. 2012; Hollis, et al. 2014; Immonen, et al. 2014) and 51
among species (Harrison, et al. 2015). Additionally, intra-sexual comparisons within species 52
have shown that transcriptional dimorphism scales with phenotypic dimorphism among 53
individuals in both invertebrates (Snell-Rood, et al. 2011; Bailey, et al. 2013; Stuglik, et al. 54
2014) and vertebrates (Small, et al. 2009; Pointer, et al. 2013; Schunter, et al. 2014; Sharma, 55
et al. 2014). These studies suggest that comparisons of transcriptomes both within and 56
between the sexes can be useful for understanding the transcriptional architecture of sexual 57
dimorphism, and the loci responding to sexual selection. 58
This previous work largely treats sexual selection as a single evolutionary force, focusing 59
mainly on divergence between males and females. Pre-mating and post-mating sexual 60
selection could, however, be expected to act in different ways and on different genomic 61
tissues involved in competing for, attracting, or securing mates (Emlen, et al. 2012; Khila, et 63
al. 2012). In contrast, post-mating sexual selection (also referred to as post-copulatory 64
sexual selection in species with internal fertilisation), a major component of sexual selection 65
in polyandrous species, has the potential to shape the transcriptional profile of the testes 66
(Mank, et al. 2013; Harrison, et al. 2015). Focusing on these effects makes it possible to ask 67
how specific components of sexual selection have shaped variation within and between the 68
sexes, linking genomic changes to the phenotypic response. 69
Isolating the effects of post-mating sexual selection on gene expression requires analyzing 70
the gonad transcriptome separately from the soma. In addition to comparing the gonad 71
transcriptome between males and females, comparisons between multiple reproductive 72
males experiencing differing levels of post-mating sexual selection is also required. As well 73
as identifying the effects and targets of post-mating sexual selection, comparing gonadal 74
transcriptomes can also improve understanding of relative transcriptional investment and 75
potential costs associated with pre- and post-mating sexual selection. For example, 76
comparing the transcriptional profiles of the testes in males from the same species with 77
differing investment in somatic pre-mating sexually selected traits may reveal the 78
transcriptional tradeoffs males make in pre-mating versus post-mating sexually selected 79
traits. This shift in transcriptional investment in response to sperm competition could be 80
manifested in the testes, particularly for the genes that are involved in sperm production. 81
The ocellated wrasse, Symphodus ocellatus, (Fig. 1) allows for a full dissection of the 82
relationship between different aspects of sexual selection in shaping transcriptional 83
dimorphism. S. ocellatus males exhibit three morphs (Taborsky, et al. 1987). Nesting males 84
court females, defend nests or provide care (Taborsky, et al. 1987; Alonzo, et al. 2000). 86
Instead, they surreptitiously join a female and nesting male when they are spawning and 87
release sperm. Satellite males do not build nests or provide care but they do associate with 88
a nesting male and attempt to bring females to and chase sneaker males away from this 89
male’s nest. Females strongly prefer nesting males (Alonzo and Warner 2000b; Alonzo 90
2008). This preference may be adaptive as nesting males are older and/or exhibit faster 91
growth than both sneakers and satellites (Alonzo, et al. 2000). 92
The high prevalence of multiple males at S. ocellatus nest sites, and multiple paternity 93
within nests, indicates that sperm competition in this species is intense, and the intensity 94
varies across male morphs (Alonzo and Warner 1999, 2000a, b; Alonzo and Heckman 2010). 95
The risk and intensity of sperm competition is lowest for nesting males and highest for 96
sneakers (Alonzo and Warner 2000b). Nesting males invest in traits favoured in pre-mating 97
sexual selection (Alonzo 2008; Alonzo and Heckman 2010), as evidenced by the significant 98
differences in somatic transcription among morphs (Alonzo and Warner 2000a; Stiver, et al. 99
2015). In contrast, sneaker males achieve fertilization success solely through post-mating
100
sexual selection. Satellites are in many ways intermediate, investing in pre-mating behaviors 101
as well as post-mating competitive traits (Stiver and Alonzo 2013; Stiver, et al. 2015). The 102
three male types in this species therefore represent a continuum of pre- and post-mating 103
sexual selection. 104
The particularly intense levels of sperm competition in S. ocellatus make it an ideal system 105
to test whether sperm competition can drive elevated rates of evolution of male-biased 106
genes (Ellegren and Parsch 2007). Higher rates of evolution of male-biased genes have been 107
Khaitovich, et al. 2005; Harrison, et al. 2015) and is generally thought to be the result of 109
more intense sexual selection acting on males (Andersson 1994), which drives the evolution 110
of male-biased genes. In a similar way, male traits subject to intense sexual selection are 111
also rapidly evolving (Lande 1981). However, rapid rates of evolution could alternatively be 112
non-adaptive, resulting from relaxed constraint or increased drift. Although positive 113
selection has been shown to drive the elevated rate of male-biased gene evolution in 114
Drosophila (Pröschel, et al. 2006), recent work in humans and birds (Gershoni and
115
Pietrokovski 2014; Harrison, et al. 2015) suggests drift is the primary cause. However, these 116
species may lack sufficient level of sperm competition to drive rapid rates of male-biased 117
gene evolution. If sperm competition is important in explaining the rapid rates of male-118
biased gene evolution, it should be evident in S. ocellatus, given the intense sperm 119
competition present in this species. 120
The three male morphs in S. ocellatus make it possible to test several aspects of how post-121
mating sexual selection affects expression and sequence evolution. First, because territorial 122
males invest in costly somatic pre-mating sexually selected traits, it may be possible to 123
identify the signature of this trade-off in the gonadal transcriptome related to post-mating 124
sexual selection. Second, we can use this system to test whether sneaker males, which could 125
be viewed as low quality, invest less in testes transcription compared to satellite males, 126
which likely represent males of higher quality. Finally, the risk and intensity of sperm 127
competition present across the three male morphs make it possible to test the power of 128
sperm competition to shape coding sequence evolution of male-biased genes. Taken 129
together, these analyses allow us to ask how post-mating sexual selection has shaped 130
general insights into how sexual dimorphism, intersexual variation and sexual selection are 132
encoded in the genome. 133
134
MATERIALS & METHODS 135
Sample collection and preparation 136
The samples were netted using 25.4 x 20.3 cm hand nets in the Baie de Revellata of the 137
Mediterranean Sea near the University of Liege Marine Station (STARESO) Calvi, Corsica 138
using SCUBA. We collected gonad samples from wild individuals, totalling 7 females, 4 139
nesting males, 5 satellite males and 4 sneaker males during the breeding season of the 140
ocellated wrasse (May and June 2014). All individuals were caught from a total of 6 141
different nests known to be in the spawning phase of the nest cycle (Lejeune 1985; 142
Taborsky, et al. 1987; Alonzo 2004) meaning that males were courting females and 143
spawning with these females in their nest. Behavioural observations were made for ten 144
minutes prior to capture to verify individual phenotype (nesting male, satellite, sneaker or 145
female) and that all individuals captured were actively involved in reproduction. All 146
individuals were caught within minutes of being observed. Both males and females spawn 147
repeatedly when at an actively spawning nest in this species and only individuals observed 148
to be reproductively active were collected. We aimed to catch one of each type from each 149
nest sampled, though in a few cases this was not possible. Individuals were brought to the 150
surface, euthanized with an overdose of MS-222 and their gonads removed within 10-50 151
min (mean=27 min) of capture. Collection was authorized by a permit to the field research 152
Samples were cut into small pieces after dissection (to allow for better preservation) and 154
immediately stored in RNAlater (Ambion). RNA extraction was done under standardised 155
conditions using a Qiagen RNeasy kit (see Table S1 for RNA quality scores). The Wellcome 156
Trust Centre for Human Genetics prepared mRNA libraries (TruSeq RNA Library Prep Kit v2), 157
and each sample was individually barcoded and run across each of four lanes of Illumina 158
HiSeq 2000 in order to eliminate technical variance. On average, we recovered 31 million 159
100 bp paired-end reads per sample before quality control (Table S1). 160
Read quality was assessed with FastQC v0.10.1 161
(http://www.bioinformatics.babraham.ac.uk/projects/download.html), and reads quality 162
trimmed with Trimmomatic v0.32 (Lohse, et al. 2012). Specifically, reads were trimmed if 163
the sliding window average Phred score over four bases was < 15 or if the leading/trailing 164
bases had a Phred score < 3. Reads were removed post filtering if either read pair was < 36 165
bases in length. After trimming there were on average 29 million paired ends reads per 166
sample totalling 199 million reads for females, 116 million reads for nesting males, 149 167
million reads for satellites and 119 million reads for sneaker males. 168
169
De novo transcriptome assembly, mapping and normalisation 170
We used the default parameters in Trinity v2.0.2 (Grabherr, et al. 2011) to construct a de
171
novo transcriptome assembly on the combined pool of 583 million paired sequences. Each 172
individual sample was mapped to the Trinity reference genome and RSEM v1.2.19 (Li and 173
Dewey 2011) and Bowtie2 v2.2.4 used to obtain expression levels for the 567,384 contigs. 174
De novo transcriptome assemblies generate many non-coding, chimeric or otherwise
spurious contigs, and we have previously developed and applied a series of filters to reduce 176
the number of erroneous contigs (Harrison, et al. 2012; Moghadam, et al. 2013; Chen, et al. 177
2015; Harrison, et al. 2015) when genome annotations are unavailable (see Fig S1 for 178
overview). Firstly, we selected the best isoform for each Trinity contig cluster, based upon 179
expression level and, in the case of ties, isoform length (Harrison, et al. 2015). These 180
sequences were subsequently used for analyses of coding sequence divergence. RSEM 181
v1.2.19 was then used to re-map expression to the set of best isoforms to facilitate accurate 182
comparisons between expression and coding sequence evolution. Secondly, non-coding 183
RNA was filtered using a BLASTn with an E-value cut-off of 1 × 10⁻¹⁰ between the set of best 184
isoform and Gasterosteus aculeatus (stickleback) non-coding RNA (Ensembl v81) (Flicek, et 185
al. 2013). Finally, we removed all contigs with < 2 FPKM in ¾ of the samples per morph. This 186
allowed morph-specific contigs to be retained with reasonable confidence (i.e. expressed in 187
at least 3 out of all the samples) and resulted in 39,453 contigs. 188
Orthology between G. aculeatus and S. symphodus sequences was assessed using BLAST 189
(Altschul etal. 1990). Specifically, the longest transcript for each gene was obtained for G.
190
aculeatus (Ensembl v81) (Flicek, et al. 2013) and a reciprocal BLASTn with an E-value cut-off
191
of 1 x10⁻¹⁰ and minimum percentage identity of 30% was used to identify orthology. 192
Reciprocal orthologs between G. aculeatus and S. symphodus were identified using the 193
highest BLAST score. Open reading frames were obtained using BLASTx with E-value cut-off 194
of 1x 10⁻¹⁰ and contigs with invalid open reading frames were removed. This resulted in 195
8,928 orthologous contigs with an average length of 2,951 bp (N50 = 3,575, N90 = 1,656). 196
Normalisation was performed using the TMM function in edgeR (Robinson, et al. 2010) and 197
correlations (Spearman’s ρ) to identify any potential outliers. One satellite male sample 199
showed significant deviations from the male distribution (Wilcoxon rank sum test p-value = 200
0.0003, mean pairwise correlations among males ρ = 0.966, mean pairwise correlations 201
between excluded sample and the remaining satellite samples ρ = 0.953) and was removed, 202
and the normalisation was re-run. Pairwise correlations across samples within each morph 203
were high (median (min-max), nesting males = 0.982 (0.980-0.983); satellites = 0.983 (0.981-204
0.984); sneakers = 0.980 (0.978-0.982); females = 0.977 (0.970-0.981). Post-normalisation 205
expression filtering resulted in the removal of genes that had expression < 2 RPKM in ¾ of 206
the samples per morph, leaving 8,906 contigs for the expression analysis. Average 207
expression for males, females and for each male morph was calculated as the logged mean 208
expression of the normalised data plus 1 (to avoid infinite values resulting from log 0). Males 209
and females had similar average log2 expression across all genes (female median = 4.05,
210
male median = 4.01, Wilcoxon rank sum test p-value = 0.555). 211
212
Sex-biased and morph-biased expression 213
Differential expression between the sexes was quantified using edgeR (Robinson, et al. 214
2010), using both a fold-change threshold of 2 (Moghadam, et al. 2012; Harrison, et al. 215
2015; Grath and Parsch 2016) across all 3 male morphs vs females and padj < 0.05, with an
216
FDR correction for multiple testing. This resulted in 5,448 sex-biased contigs, classified as 217
those contigs with at least twice the expression in one sex compared to the other, as well as 218
padj < 0.05. We also identified sex-biased contigs by comparing each male morph to females
219
(i.e. nesting males vs females, sneakers vs females and satellites vs females). These 220
two methods when using nesting males as the reference, 96% when using sneakers and 99% 222
when using satellite males as the reference. We also used DESeq (v1.18.0) (Anders and 223
Huber 2010) to calculate differential expression between males and females, specifying the 224
same parameters to identify sex-bias as used in the edgeR method. Of the sex-biased genes 225
identified using the edgeR method, 97.4% were also identified as sex-biased using DESeq 226
using the same fold-change thresholds. 227
Sex-biased contigs were then divided into male-biased genes, those with at least twice the 228
expression in males compared to females and padj < 0.05, and female-biased genes, those
229
with at least twice the expression in females compared to males and padj < 0.05. Because the
230
strength of selection has been shown to correlate with expression level (Krylov, et al. 2003; 231
Nuzhdin, et al. 2004), male-biased (n = 2,590) and female-biased (n = 2,858) contigs were 232
divided into quartiles based on average expression level in females for female-biased 233
contigs and average expression level in males (across the three morphs) for male-biased 234
contigs. 235
Morph-biased genes are expressed more highly in one morph compared to the other two 236
morphs. They can be expressed in multiple morphs, but at significantly different levels in 237
one morph compared to the other two. Morph-biased contigs were identified using edgeR, 238
comparing differences between the focal morph and the other two morphs (i.e. nesting 239
males vs sneaker and satellite males; satellite males vs sneaker and nesting males; sneaker 240
males vs nesting and satellite males), using an FDR adjustment for false discovery rate at padj
241
< 0.05. Because we expect few contigs to exhibit large expression changes across morphs 242
(Pointer, et al. 2013; Hollis, et al. 2014), we report morph-biased contigs both with and 243
Hierarchical clustering for the average for each morph was performed using Euclidean 245
clustering in the R package pvclust v1.3-2 (Suzuki and Shimodaira 2006) with bootstrap 246
resampling (1000 replicates) for female-biased and male-biased genes. Heatmaps were 247
generated using log2 average expression for each gene in each morph using the R package
248
pheatmap v1.0.2. Factor analysis was conducted in R (using Factanal) with varimax rotation. 249
Gene Ontology functional enrichment was assessed for sex-biased genes in each expression 250
quartile using Gene Ontology Enrichment Analysis and Visualization tool (Eden, et al. 2009) 251
using two unranked lists of genes and function ontology specified with a p-value threshold < 252
0.001. Biomart (Ensembl Genes 86) was used to assign orthology between G. aculeatus and 253
Danio rerio. Sex-biased genes for each quartile were specified as the target gene set with all
254
other genes as the background. Significant GO terms (pfdr < 0.05) are listed in Table S2.
255
256
Sequence divergence 257
Coding sequences for Xiphophorus maculatus (platyfish) and G. aculeatus (stickleback) were 258
obtained from Ensembl v81 and the longest transcript for each gene identified (Flicek, et al. 259
2013). A reciprocal BLASTn with an E-value cut-off of 1 x10⁻¹⁰ and minimum percentage 260
identity of 30% was used to identify reciprocal 1:1:1 orthologs, resulting in 5,366 261
orthogroups (Fig. S1). Open reading frames were obtained using BLASTx and G. aculeatus
262
protein sequences as the BLAST database. 263
Orthologs were aligned with PRANK v140603 in codon mode (Löytynoja and Goldman 2008) 264
specifying the tree ((X. maculatus, G. aculeatus), S. ocellatus). Alignments were quality 265
give false signals of position selection. Specifically, codons were masked if there were more 267
than seven non-synonymous mutations in a sliding window scan of 15 codons. Gaps and 268
masked codons were removed from the alignment and orthogroups discarded if the length 269
< 300bp. 270
We obtained divergence estimates for each orthogroup using the branch model (model=2, 271
nssites=0) in the CODEML package in PAML v4.8 (Yang 2007) using the tree (X. maculatus, G.
272
aculeatus, S. ocellatus#1). The branch model was used to calculate dN/dS for the
wrasse-273
specific branch. Contigs were excluded if tree length dS > 2 in order to remove sequences
274
which have reached mutational saturation (Axelsson, et al. 2008). This resulted in 4,912 275
orthogroups remaining out of a total of 5366. 276
For each expression class, we calculated mean dN and mean dS from the PAML outputs as
277
the sum of the number of substitutions across all contigs in a given category divided by the 278
number of sites (dN =DN/N; dS =DS/S; where DN = number of non-synonymous substitutions,
279
N = number of non-synonymous sites, DS = number of synonymous substitutions, S =
280
number of synonymous sites). This approach avoids the problems of infinitely high dN/dS
281
estimates arising from contigs with extremely low dS (Harrison, et al. 2015; Wright, et al.
282
2015) and prevents disproportionate weighting and skew from shorter contigs. 1000 283
bootstrap replicates were generated to estimate 95% confidence intervals and 284
permutations tests were used to test for significant differences between pairwise 285
comparisons. 286
287
Polymorphism data was obtained by first mapping RNA-seq reads to the best isoform Trinity 289
assembly using the two-pass alignment method of the STAR aligner v2.4.2a with default 290
parameters (Dobin, et al. 2013). Only uniquely mapping reads were retained. SAMTOOLS 291
mpileup v0.1.19 (Li, et al. 2009) and VARSCAN2 v2.3.9 mpileup2snp (Koboldt, et al. 2009; 292
Koboldt, et al. 2012) were used to call SNPs. SAMTOOLS mpileup was run with the 293
probabilistic alignment disabled, a max read depth of 10,000,000 and default minimum base 294
quality of 13. VARSCAN2 mpileup2snp was run with a minimum frequency for homozygote 295
of 0.85, minimum coverage of 2, minimum average quality of 20, strand-filter on and p-296
value = 1. Valid SNPs were required to have a minimum coverage of 20 in at least four 297
individuals and a minor allele frequency > 0.15, resulting in 218,913 SNPs. SNPs were 298
matched to the reading frame to determine whether they were synonymous or 299
nonsynonymous. 300
In order to ensure the divergence and polymorphism data was comparable for subsequent 301
analyses, similar criteria were used to filter both analyses. Specifically, codons that (i) were 302
masked by SWAMP (ii) failed the minimum coverage threshold of 20 in at least four 303
individuals or (iii) were excluded from PAML due to alignment gaps and the clean filter 304
function, were filtered from both the polymorphism and divergence analyses. 305
The McDonald–Kreitman test (McDonald and Kreitman 1991) was used to estimate the 306
number of contigs evolving under adaptive and neutral evolution by contrasting the number 307
of nonsynonymous and synonymous substitutions (DN and DS) with polymorphisms (PN and
308
PS). Fisher’s Exact tests were run for each contig using DN, DS, PN and PS. Contigs were
309
removed if the total observations across rows and columns in the 2x2 contingency table was 310
< 6 (Begun, et al. 2007; Andolfatto 2008). For those contigs with significant deviations in DN,
DS, PN and PS, positive selection was indicated by DN/DS > PN/PS (McDonald and Kreitman
312
1991). 313
To examine expression levels of genes under positive selection we expanded our group of 314
genes under putative positive selection by using the Direction of Selection (DoS) test 315
(Stoletzki and Eyre-Walker 2011). DoS (DoS = Dn/(Dn + Ds) − Pn/(Pn + Ps)) was calculated as
316
the difference in the proportion of fixed non-synonymous sites and the proportion of 317
polymorphic synonymous sites (Stoletzki and Eyre-Walker 2011). An excess of non-318
synonymous substitutions compared to polymorphisms (i.e. DoS > 0) indicates putative 319
positive selection. 320
Lastly, we tested morph-biased genes (identified within the expression analysis) for standing 321
variation using polymorphism data to test for an excess or under-representation of 322
nonsynonymous polymorphisms across morph-biased genes. Excess or underrepresentation 323
is indicative of relaxed purifying selection or positive selection, respectively. For this 324
analysis, we separately concatenated PN and PS for each gene class and used Fisher’s Exact
325
tests (in R v3.1.3) to test for significant differences in PN/PS between pairwise comparisons
326
between morph-biased genes and male-biased genes. 327
Commands are included in the supplementary material. 328
329
RESULTS 330
We had a total of 583 million paired-end reads across all samples after trimming, which we 331
reciprocal orthologs with Gasterosteus aculeatus (stickleback), representing coding 333
sequence used for all downstream analysis. 334
335
Sex-biased expression across male morphs 336
We estimated expression for each sample, based on an average of 29 million paired-end 337
reads after trimming. We identified greater inter-sexual expression variation, with 5,448 sex 338
biased genes (log2 M:F > 1 or < -1, padj < 0.05) compared to intra-sexual expression variation,
339
with 34 morph-biased genes (24 nesting male-biased, 2 satellite male-biased, 8 sneaker 340
male-biased, log2 fold change between morph comparisons > 1 or < -1, padj < 0.05). Of the
341
nesting male-biased contigs, 1 contig was also male-biased and 2 were female-biased, the 342
satellite male-biased contigs 1 was also male-biased and 1 female-biased, and the sneaker 343
male-biased contigs 3 were male-biased and 3 female-biased. Previous work has indicated 344
few contigs have large expression changes among morphs (Pointer, et al. 2013; Hollis, et al. 345
2014), therefore we also assessed morph-bias without expression thresholds, and only 346
based on statistical thresholds (padj < 0.05). Using this more relaxed threshold, we recovered
347
41 nesting male-biased contigs, 11 satellite male-biased contigs, and 9 sneaker male-biased 348
contigs. 349
We first used these expression estimates for hierarchical clustering, which can be used to 350
assess overall transcriptional similarity across morphs and sexes. For male- and female-351
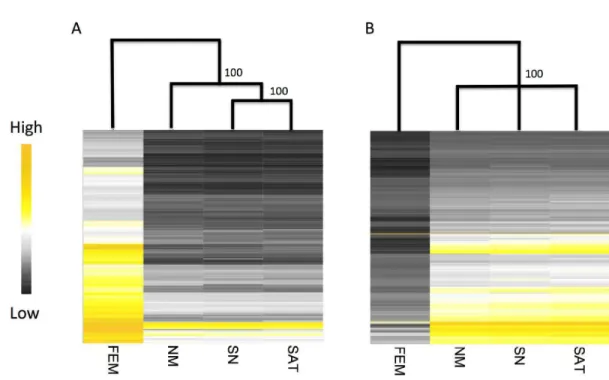
biased genes, male morphs cluster more closely to each other than to females (Fig 2). Our 352
clustering also indicates some intra-sexual variation among male morphs, as sneaker and 353
for female-biased genes expressed in the gonad. All three male morphs were statistically 355
indistinguishable via bootstrapping in the hierarchical clustering across male-biased genes. 356
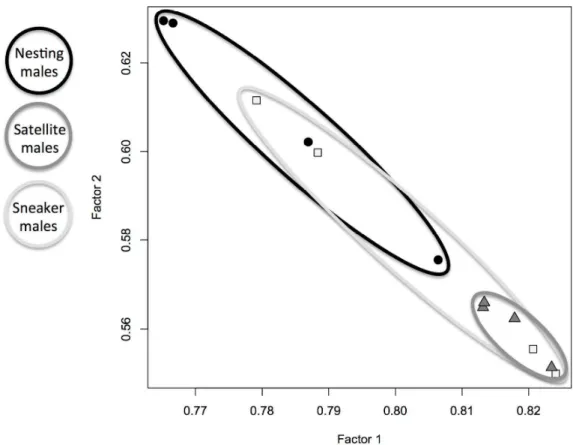
Intra-sexual variation in expression was also evident with factor analysis based on all 357
expressed genes, which indicated greater transcriptional difference between nesting males 358
and satellite males (Fig. 3). However, sneaker males showed substantial variation across 359
both factors, and overlap with both nesting males and satellites (Fig. 3). 360
In order to test for differences in transcriptional investment among the three morphs we 361
next tested for masculinization and feminization of gonadal expression (Jaquiery, et al. 362
2013; Pointer, et al. 2013; Hollis, et al. 2014) in each of the male morphs, and combined that 363
with estimates of expression variance. Masculinization and feminization of gene expression 364
is the increase in expression of male-biased or female-biased genes, respectively. Similarly 365
demasculinization and defeminisation of gene expression is the reduction in expression of 366
male-biased and female-biased genes, respectively. Gene expression variance estimates are 367
increasingly used to infer selection acting on expression level under assumptions that 368
selection on expression will decrease expression variance across replicates (Moghadam, et 369
al. 2012; Romero, et al. 2012; Dean, et al. 2015). Nesting males express female-biased genes 370
at significantly higher levels compared to the other male morphs at the lower expression 371
levels (Fig. 4A). Although initially surprising given recent studies in birds and Drosophila
372
(Pointer, et al. 2013; Hollis, et al. 2014), our results indicate that nesting males also exhibit 373
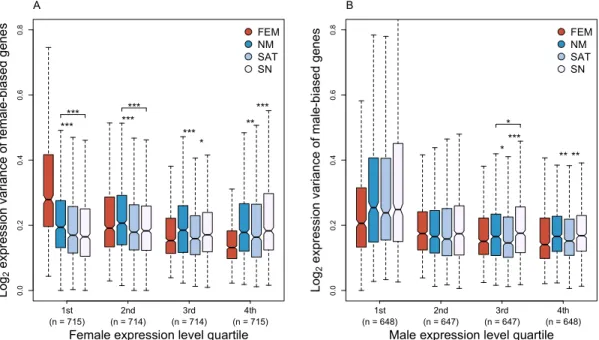
higher variance in expression for female-biased genes at the lower expression levels (Fig. 374
5A) compared to the other morphs, suggesting that although they show some feminization, 375
it is unlikely to be due to selection acting to increase expression. In contrast, satellite males 376
particularly for highly expressed male-biased genes, suggesting that the gonadal 378
masculinization is the response to selection for higher expression in this morph. These 379
results do not qualitatively change if we increase the sex-biased threshold to four-fold 380
expression differences between the sexes (Figure S2, S3), suggesting these results are robust 381
to comparisons between samples that potentially vary in tissue composition (Harrison, et al. 382
2015; Montgomery and Mank 2016). Gene Ontology terms for sex-biased genes in the 383
different expression level quartiles are presented in Table S2. 384
385
Rates of evolution 386
In order to test the power of sperm competition to shape gene sequence evolution we 387
compared rates of evolution and population-level polymorphism across sex-biased and 388
unbiased genes. As observed in many other animals (Ellegren and Parsch 2007), male-biased 389
gonadal genes showed higher rates of gene sequence evolution than unbiased genes, driven 390
by both an increase in dN and a decrease in dS (Table 1). Interestingly, female-biased genes
391
in our wrasse data also showed significantly higher rates of sequence evolution, again driven 392
by both an increase in dN and a decrease in dS (Table 1). McDonald-Kreitman (MK) tests
393
(McDonald and Kreitman 1991) revealed a higher proportion of male-biased genes with 394
signatures of positive selection than unbiased genes (Table 2), indicating adaptive evolution 395
explains at least some of the elevated rate of evolution for male-biased genes. However, 396
only five female-biased genes showed significant evidence of positive selection with 397
McDonald-Kreitman tests, which was not significantly different from the level observed for 398
unbiased genes. We also tested morph-biased genes for differences in rates of evolution 399
statistical power (Tables S3 and S4), nesting-male biased genes do show a marginally 401
significant elevated rate of evolution compared to male-biased genes (Table S3), consistent 402
with previous work in the bulb mite and pea aphid (Stuglik et al 2014, Purandare et al 2014). 403
Our analysis of standing polymorphism suggests that this fast rate of evolution may be due 404
in part to drift (Table S4). 405
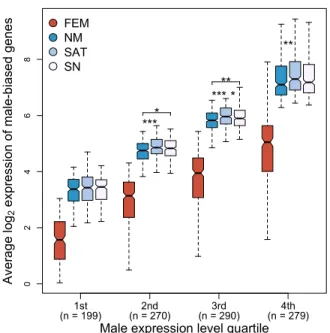
To test whether male-biased genes under positive selection have highest expression in 406
morphs subject to strong post-mating sexual selection, we expanded our group of genes 407
under putative positive selection by using the Direction of Selection (DoS) test (Stoletzki and 408
Eyre-Walker 2011), which is more permissive than the MK test. Satellite males express male-409
biased genes with DoS > 0 (indicative of putative positive selection) at higher levels than 410
nesting males (Fig. 6). Male-biased genes under putative positive selection also tend to be 411
more highly expressed (Fig. S4A) but tend to be less male-biased in their expression (Fig. 412
S4B) than genes under relaxed constraint. 413
414
DISCUSSION 415
Here we report patterns of regulatory and sequence evolution in the gonad transcriptome 416
of wild caught ocellated wrasse, a species with three male morphs which experiences 417
particularly high levels of sperm competition and a continuum of pre- and post-mating 418
sexual selection (Alonzo and Warner 2000b; Alonzo and Heckman 2010). Previous work in 419
this system has revealed somatic variation in gene expression among the male morphs that 420
may be important in pre-mating sexual selection (Stiver, et al. 2015). Here we focus on the 421
423
Gene expression and sexual selection 424
The design of our study makes it possible to compare both inter and intra-sexual 425
transcriptional variation to explore how post-mating sexual selection shapes the gonadal 426
transcriptome and drives gene sequence evolution. Previous work on somatic tissues 427
showed equal or greater intra-sexual than inter-sexual differences in transcription (Snell-428
Rood, et al. 2011; Schunter, et al. 2014). This is in clear contrast to our results here (Fig. 1) 429
and our previous work on male morphs in wild turkeys (Pointer, et al. 2013), which show the 430
greatest difference is first by sex, then within sex by morph. This may reflect fundamental 431
differences between somatic and gonad transcriptional variation, as somatic tissues in 432
general tend to show far less inter-sexual variation than the gonad (Pointer, et al. 2013; 433
Harrison, et al. 2015), in the latter case resulting from the profound functional and 434
physiological differences in producing and delivering male versus female gametes. 435
Relatively few genes showed significant expression differences among male morphs, 436
however average expression across male- and female-biased gene categories was similar to 437
previous studies in birds (Pointer, et al. 2013), and mites (Stuglik, et al. 2014). Previous work 438
has suggested that sex-biased genes shift expression in response to sexual selection (Hollis, 439
et al. 2014; Immonen, et al. 2014) and are correlated with the magnitude of male sexually 440
selected traits (Pointer, et al. 2013). Based on this, we might expect territorial males in S.
441
ocellatus to show greater male-biased expression. However, we observed the opposite, and
442
territorial males instead exhibit significant feminization of expression for female-biased 443
genes. Although models of gene expression evolution have yet to be validated, the high 444
unlikely to be the result of positive selection in territorial males. High expression variance in 446
female-biased genes, coupled with the high investment nesting males make in somatic traits 447
(Alonzo 2008; Alonzo and Heckman 2010; Alonzo and Warner 2000a; Stiver et al 2015), is 448
consistent with a trade-off between maintaining costly pre-mating sexually selected traits 449
and the constraints of post-mating sexual selection shaping gene expression in the gonad. 450
In contrast to territorial males, satellite males showed the highest expression level for male-451
biased genes, consistent with the greater transcriptional investment in genes likely to be 452
important in post-mating sexual selection compared to nesting males. Satellites also showed 453
significantly less variation in expression for both male- and female-biased genes, consistent 454
with positive selection under recent models of gene expression evolution (Moghadam, et al. 455
2012; Romero, et al. 2012; Dean, et al. 2015). Satellite males also have the largest absolute 456
gonad mass out of the three morphs (Alonzo & Stiver unpublished data), illustrating 457
concordance between male-biased gene expression and absolute gonadal mass. These 458
results are consistent with the possibility that, freed from the costs of pre-mating somatic 459
sexually selected traits, satellite males are able to invest more in post-mating sexually 460
selected gene expression patterns that may aid them in sperm competition. This is 461
somewhat at odds with results from the wild turkey, where subordinate males, which are 462
analogous in many ways to satellite males in the wrasse, show reduced expression of male-463
biased genes (Pointer, et al. 2013). However, it is worth noting that subordinate male 464
turkeys are effectively non-reproductive (Krakauer 2005, 2008), and therefore do not 465
experience sperm competition. 466
Sneaker males show defeminization of febiased genes demasculinization of male-467
they are simply lower quality on average than the other morphs. This is consistent with the 469
life history trajectory of sneaker males, which tend to be the males with slowest early 470
growth rate (Alonzo, et al. 2000). Small males typically breed as 1 year old sneaker males, 471
then go on to become 2 year old satellite males, never becoming nesting males, while larger 472
males become satellites as 1 year olds then nesting males as 2 year olds (Alonzo et al. 2000). 473
Though, sneaker males release the most sperm per spawn out of all three morphs (Alonzo 474
and Warner 2000a), they also generate the least total sperm (across successive mating 475
attempts) and have the lowest average individual mating success and paternity of all three 476
morphs (Alonzo and Warner 2000b; Alonzo et al. in prep). Therefore, demasculinization and 477
high variance of male-biased gene expression may reflect the low overall male quality of 478
sneaker males. 479
Alternative mating tactics are common in fish, and appear to have evolved many times 480
independently (Mank and Avise 2006). Given the repeated origin of these phenotypes, it will 481
be interesting for future studies to determine whether our observed patterns of gonadal 482
gene expression differentiation among morphs are conserved among systems with similar 483
mating systems. 484
Sperm competition and sequence evolution 485
Our results are somewhat unusual compared to previous studies in animals in that both 486
male- and female-biased genes show elevated rates of sequence evolution. This was due to 487
elevated dN and a reduced dS in both male- and female-biased genes, and suggests that
488
sexual selection alone, which in this species would act more forcefully on males, cannot 489
explain elevated rates of evolution observed in both sexes. Although female-biased genes 490
both male- and female-biased genes exhibit faster rates of evolution in an alga (Lipinska, et 492
al. 2015), expression studies in adult animals have tended to show faster rates of evolution 493
primarily in male-biased genes (Ellegren and Parsch 2007). It is not clear at this point 494
whether our results represent a species-specific pattern, or are exhibited by other species 495
with similar mating systems. We also note that the contigs we removed from the dN/dS
496
analysis due to mutational saturation could also have been the most rapidly evolving genes, 497
causing an overall underestimation of divergence. 498
499
Interestingly, recent work in birds (Harrison, et al. 2015) and humans (Gershoni and 500
Pietrokovski 2014) have suggested that fast rates of evolution for male-biased genes might 501
be due to relaxed constraint rather than positive selection, and this is consistent with 502
studies in insects showing relaxed constraint characterizes caste-biased genes (Hunt, et al. 503
2011). In contrast, our results show that male-biased genes have a higher proportion of loci 504
showing evidence of positive selection, suggesting that at least some of the acceleration in 505
rates of evolution for male-biased genes is due to adaptive evolution. This may be due to 506
the intense level of sperm competition experienced by males of these species (Alonzo and 507
Heckman 2010) and the resulting strength of post-mating sexual selection among 508
alternative male types. Extended haploid selection due to external fertilization may also 509
explain our results. 510
In summary, the alternative mating strategies of S. ocellatus make it possible to isolate the 511
complex effects of post-mating sexual selection on gonadal genome evolution. Our results 512
reveal the potential for post-mating sexual selection to masculinize the transcriptome and 513
515
ACKNOWLEDGEMENTS 516
This material is based upon work supported by the National Science Foundation (under 517
Grant Number IOS-0950472 to SHA), the European Research Council (grant agreements 518
260233 and 680951 to JEM), Marie Curie Actions (grant agreement 655392 to RD) and 519
Australian Research Council (DE150101853 to RD). We thank Pierre Lejeune, Alexandre 520
Volpon and the staff of Station de Recharches Sous-marins at Océangraphique for their 521
support in the field and Holly Kindsvater for sample collection. The authors acknowledge the 522
use of the UCL Legion High Performance Computing Facility (Legion@UCL), and associated 523
support services, in the completion of this work. We also thank S. Montgomery, V. Oostra, I. 524
REFERENCES 526
Alonzo SH. 2008. Female mate choice copying affects sexual selection in wild populations of the 527
ocellated wrasse. Animal Behaviour 75:1715-1723. 528
Alonzo SH. 2004. Uncertainty in territory quality affects the benefits of usurpation in a 529
Mediterranean wrasse. Behavioral Ecology 15:278-285. 530
Alonzo SH, Heckman KL. 2010. The unexpected but understandable dynamics of mating, paternity 531
and paternal care in the ocellated wrasse. Proceedings of the Royal Society B-Biological Sciences 532
277:115-122. 533
Alonzo SH, Taborsky M, Wirtz P. 2000. Male alternative reproductive behaviours in a Mediterranean 534
wrasse, Symphodus ocellatus: Evidence from otoliths for multiple life-history pathways. Evolutionary 535
Ecology Research 2:997-1007. 536
Alonzo SH, Warner RR. 2000a. Allocation to mate guarding or increased sperm production in a 537
Mediterranean wrasse. American Naturalist 156:266-275. 538
Alonzo SH, Warner RR. 2000b. Dynamic games and field experiments examining intra- and 539
intersexual conflict: explaining counterintuitive mating behavior in a Mediterranean wrasse, 540
Symphodus ocellatus. Behavioral Ecology 11:56-70. 541
Alonzo SH, Warner RR. 1999. A trade-off generated by sexual conflict: Mediterranean wrasse males 542
refuse present mates to increase future success. Behavioral Ecology 10:105-111. 543
Anders S, Huber W. 2010. Differential expression analysis for sequence count data. Genome Biology 544
11:R106. 545
Andersson M. 1994. Sexual Selection. Princeton, NJ: Princeton University Press. 546
Andolfatto P. 2008. Controlling Type-I Error of the McDonald-Kreitman Test in Genomewide Scans 547
for Selection on Noncoding DNA. Genetics 180:1767-1771. 548
Axelsson E, Hultin-Rosenberg L, Brandstrom M, Zwahlen M, Clayton DF, Ellegren H. 2008. Natural 549
selection for avian protein-coding genes expressed in brain. Molecular Ecology 17:3008-2017. 550
Bailey NW, Veltsos P, Tan YF, Millar AH, Ritchie MG, Simmons LW. 2013. Tissue-Specific 551
Transcriptomics in the Field Cricket Teleogryllus oceanicus. G3-Genes Genomes Genetics 3:225-230. 552
Begun DL, Holloway Ak, Stevens K, Hillier L, Poh Y-P, Hahn MW, Nista PM, Jones CD, Kern AD, Dewey 553
CN, et al. 2007. Population genomics: Whole-genome analysis of polymorphism and divergence in 554
Drosophila simulans. PLoS Biology 5:e310. 555
Chen Y-C, Harrison PW, Kotrschal A, Kolm N, Mank JE, Panula P. 2015. Expression change in 556
Angiopoietin-1 underlies change in relative brain size in fish. Proceedings of the Royal Society B-557
Biological Sciences 282. 558
Cutter AD, Ward S. 2005. Sexual and temporal dynamics of molecular evolution in C. elegans 559
development. Molecular Biology and Evolution 22:178-188. 560
Dean R, Harrison PW, Wright AE, Zimmer F, Mank JE. 2015. Positive Selection Underlies Faster-Z 561
Evolution of Gene Expression in Birds. Molecular Biology and Evolution 32:2646-2656. 562
Dean R, Mank JE. 2016. Tissue-specific and sex-specific regulatory variation permit the evolution of 563
sex-biased gene expression. American Naturalist 188:E74-E84. 564
Dobin A, Davis CA, Schlesinger F, Drenkow J, Zaleski C, Jha S, Batus P, Chaisson M, Gingeras TR. 2013. 565
STAR: ultrafast universal RNA-seq aligner. Bioinformatics 29:15-21. 566
Eden E, Navon R, Steinfold I, Lipson D, Yakhini. 2009. GOrilla: A tool for discovery and visualization of 567
enriched FO terms in ranked gene lists. BMC Bioinformatics 10:48. 568
Ellegren H, Parsch J. 2007. The evolution of sex-biased genes and sex-biased gene expression. Nature 569
Reviews Genetics 8:689-698. 570
Emlen DJ, Warren IA, Johns A, Dworkin I, Lavine LC. 2012. A mechanism of extreme growth and 571
reliable signaling in sexually selected ornaments and weapons. Science 337:860-864. 572
Flicek P, Ahmed I, Amode MR, Barrell D, Beal K, Brent S, Carvalho-Silva D, Clapham P, Coates G, 573
Gershoni M, Pietrokovski S. 2014. Reduced selection and accumulation of deleterious mutations in 575
genes exclusively expressed in men. Nature Communications 5:4438. 576
Grabherr MG, Haas BJ, Yassour M, Levin JZ, Thompson DA, Amit I, Adiconis X, Fan L, Raychowdhury 577
R, Zeng QD, et al. 2011. Full-length transcriptome assembly from RNA-Seq data without a reference 578
genome. Nature Biotechnology 29:644-U130. 579
Grath S, Parsch J. 2016. Sex-Biased Gene Expression. Annual Review of Genetics 50. 580
Harrison PW, Mank JE, Wedell N. 2012. Incomplete Sex Chromosome Dosage Compensation in the 581
Indian Meal Moth, Plodia interpunctella, Based on De Novo Transcriptome Assembly. Genome 582
Biology and Evolution 4:1118-1126. 583
Harrison PW, Wright AE, Zimmer F, Dean R, Montgomery SH, Pointer MA, Mank JE. 2015. Sexual 584
selection drives evolution and rapid turnover of male gene expression. Proceedings of the National 585
Academy of Sciences, USA 112:4393-4398. 586
Hollis B, Houle D, Yan Z, Kawecki TJ, Keller L. 2014. Evolution under monogamy feminizes gene 587
expression in Drosophila melanogaster. Nature Communications 5:3482. 588
Hunt BG, Ometto L, Wurm Y, Shoemaker D, Yi SV, Keller L, Goodisman MAD. 2011. Relaxed selection 589
is a precursor to the evolution of phenotypic plasticity. Proceedings of the National Academy of 590
Sciences, USA 108:15936-15941. 591
Immonen E, Snook RR, Ritchie MG. 2014. Mating system variation drives rapid evolution of the 592
female transcriptome in Drosophila pseudoobscura. Ecology and Evolution 4:2186-2201. 593
Jaquiery J, Rispe C, Roze D, Legeai F, Le Trionnaire G, Stoeckel S, Mieuzet L, Da Silva C, Poulain J, 594
Prunier-Leterme N, et al. 2013. Masculinization of the X Chromosome in the Pea Aphid. Plos 595
Genetics 9:e1003690. 596
Khaitovich P, Hellmann I, Enard W, Nowick K, Leinweber M, Franz H, Weiss G, Lachmann M, Paabo S. 597
2005. Parallel patterns of evolution in the genomes and transcriptomes of humans and chimpanzees. 598
Science 309:1850-1854. 599
Khila A, Abouheif E, Rowe L. 2012. Function, developmental genetics, and fitness consequences of a 600
sexually antagonistic trait. Science 336:585-589. 601
Koboldt DC, Chen K, Wylie T, Larson DE, McLellan MD, Mardis ER, Weinstock GM, Wilson RK, Ding L. 602
2009. VarScan: variant detection in massively parallel sequencing of individual and pooled samples. 603
Bioinformatics 25:2283-2285. 604
Koboldt DC, Zhang Q, Larson DE, Shen D, McLellan MD, Lin L, Miller CA, Mardis ER, Ding L, Wilson RK. 605
2012. VarScan 2: somatic mutation and copy number alteration discovery in cancer by exome 606
sequencing. Genome Research 22:568-576. 607
Koerich LB, Wang XY, Clark AG, Carvalho AB. 2008. Low conservation of gene content in the 608
Drosophila Y chromosome. Nature 456:949-951. 609
Krakauer AH. 2005. Kin selection and cooperative courtship in wild turkeys. Nature 434:69-72. 610
Krakauer AH. 2008. Sexual selection and the genetic mating system of wild turkeys. Condor 110:1-611
12. 612
Krylov DM, Wiolf YI, Rogozin IB, Koonin EV. 2003. Gene loss, protein sequence divergence, gene 613
dispensability, expression level, and interactivity are correlated in eukaryotic evolution. Genome 614
Research 13:2229-2235. 615
Lande R. 1981. Models of speciation by sexual selection on polygenic traits. Proceedings of the 616
National Academy of Sciences of the United States of America 78:3721-3725. 617
Lejeune P. 1985. Etude écoéthologique des comportements reproducteur et sociaux des Labridae 618
méditerranéens des genres Symphodus (Rafinesque 1810) et Coris (Lacepede 1802). Cahier 619
d'Ethologie Appliquee 5:1-208. 620
Li B, Dewey CN. 2011. RSEM: Accurate transcript quantification from RNA-Seq data with or without a 621
reference genome. BMC Bioinformatics 12:323. 622
Li H, Handsaker B, Wysoker A, Fennell T, Ruan J, Homer N, Marth G, Abecasis G, Durbin R, Subgroup 623
Lipinska A, Cormier A, Luthringer R, Peters AF, Corre E, Gachon CM, Cock JM, Coelho SM. 2015. 625
Sexual Dimorphism and the Evolution of Sex-Biased Gene Expression in the Brown Alga Ectocarpus. 626
Molecular Biology and Evolution 32:1581-1597. 627
Lohse M, Bolger AM, Nagel A, Fernie AR, Lunn JE, Stitt M, Usadel B. 2012. RobiNA: a user-friendly, 628
integrated software solution for RNA-Seq-based transcriptomics. Nucleic Acids Research 40:W622-629
W627. 630
Löytynoja A, Goldman N. 2008. Phylogeny-aware gap placement prevents errors in sequence 631
alignment and evolutionary analysis. Science 320:1632-1635. 632
Mank JE, Avise JC. 2006. Comparative phylogenetic analysis of male alternative reproductive tactics 633
in ray-finned fishes. Evolution 60:1311-1316. 634
Mank JE, Wedell N, Hosken DJ. 2013. Polyandry and sex-specific gene expression. Philosophical 635
Transactions of the Royal Society, B 368:20120047. 636
McDonald JH, Kreitman M. 1991. Adaptive protein evolution at the ADH locus in Drosophila. Nature 637
351:652-654. 638
Moghadam HK, Harrison PW, Zachar G, Szekely T, Mank JE. 2013. The plover neurotranscriptome 639
assembly: transcriptomic analysis in an ecological model species without a reference genome. 640
Molecular Ecology Resources 13:696-705. 641
Moghadam HK, Pointer MA, Wright AE, Berlin S, Mank JE. 2012. W chromosome expression 642
responds to female-specific selection. Proceedings of the National Academy of Sciences, USA 643
109:8207-8211. 644
Montgomery SH, Mank JE. 2016. Inferring regulatory change from gene expression: the confounding 645
effects of tissue scaling. Molecular Ecology. 646
Nuzhdin SV, Wayne ML, Harmon KL, McIntyre LM. 2004. Common pattern of evolution of gene 647
expression level and protein sequence in Drosophila. Molecular Biology and Evolution 21:1308-1317. 648
Parsch J, Ellegren H. 2013. The evolutionary causes and consequences of sex-biased gene expression. 649
Nature Reviews Genetics 14:83-87. 650
Pointer MA, Harrison PW, Wright AE, Mank JE. 2013. Masculinization of gene expression is 651
associated with exaggeration of male sexual dimorphism. Plos Genetics 9:e1003649. 652
Pröschel M, Zhang Z, Parsch J. 2006. Widespread adaptive evolution of drosophila genes with sex-653
biased expression. Genetics 174:893-900. 654
Ranz JM, Castillo-Davis CI, Meiklejohn CD, Hartl DL. 2003. Sex-dependent gene expression and 655
evolution of the Drosophila transcriptome. Science 300:1742-1745. 656
Robinson M, CMcCarthy D, Smyth G. 2010. edgeR: a Bioconductor package for differential 657
expression analysis of digital gene expression dats. Bioinfomratics 26:139-140. 658
Romero IG, Ruvinsky I, Gilad Y. 2012. Comparative studies of gene expression and the evolution of 659
gene regulation. Nature Reviews Genetics 13:505-516. 660
Schunter C, Vollmer SV, Macpherson E, Pascual M. 2014. Transcriptome analyses and differential 661
gene expression in a non-model fish species with alternative mating tactics. Bmc Genomics 15. 662
Sharma E, Kunstner A, Fraser BA, Zipprich G, Kottler VA, Henz SR, Weigel D, Dreyer C. 2014. 663
Transcriptome assemblies for studying sex-biased gene expression in the guppy, Poecilia reticulata. 664
Bmc Genomics 15. 665
Skaletsky H, Kuroda-Kawaguchi T, Minx PJ, Cordum HS, Hillier L, Brown LG, Repping S, Pyntikova T, 666
Ali J, Bieri T, et al. 2003. The male-specific region of the human Y chromosome is a mosaic of discrete 667
sequence classes. Nature 423:825-U822. 668
Small CM, Carney GE, Mo QX, Vannucci M, Jones AG. 2009. A microarray analysis of sex- and gonad-669
biased gene expression in the zebrafish: Evidence for masculinization of the transcriptome. Bmc 670
Genomics 10:579. 671
Snell-Rood EC, Cash A, Han MV, Kijimoto T, Andrews J, Moczek AP. 2011. Developmental decoupling 672
of alternative phenotypes: Insights from the transcriptomes of horn-polyphenic beetles. Evolution 673
Stiver KA, Alonzo SH. 2013. Does the Risk of Sperm Competition Help Explain Cooperation between 675
Reproductive Competitors? A Study in the Ocellated Wrasse (Symphodus ocellatus). American 676
Naturalist 181:357-368. 677
Stiver KA, Harris RM, Townsend JP, Hofmann HA, Alonzo SH. 2015. Neural Gene Expression Profiles 678
and Androgen Levels Underlie Alternative Reproductive Tactics in the Ocellated Wrasse, Symphodus 679
ocellatus. Ethology 121:152-167. 680
Stoletzki N, Eyre-Walker A. 2011. Estimation of the Neutrality Index. Molecular Biology and Evolution 681
28:63-70. 682
Stuglik MT, Babik W, Prokop Z, Radwan J. 2014. Alternative reproductive tactics and sex-biased gene 683
expression: the study of the bulb mite transcriptome. Ecology and Evolution 4:623-632. 684
Suzuki R, Shimodaira H. 2006. Pvclust: an R package for assessing the uncertainty in hierarchical 685
clustering. Bioinformatics 22:1540-1542. 686
Taborsky M, Hudde B, Wirtz P. 1987. Reproductive behavior and ecology of Symphodus (Crenilabrus) 687
Ocellatus, a European wrasse with 4 types of male behavior. Behaviour 102:82-118. 688
Whittle CA, Johannesson H. 2013. Evolutionary Dynamics of Sex-Biased Genes in a Hermaphrodite 689
Fungus. Molecular Biology and Evolution 30:2435-2446. 690
Wright AE, Harrison PW, Zimmer F, Montgomery SH, Pointer MA, Mank JE. 2015. Variation in 691
promiscuity and sexual selection drives avian rate of Faster-Z evolution. Molecular Ecology 24:1218-692
1235. 693
Yang ZH. 2007. PAML 4: Phylogenetic analysis by maximum likelihood. Molecular Biology and 694
Evolution 24:1586-1591. 695
Zhang Z, Hambuch TM, Parsch J. 2004. Molecular evolution of sex-biased genes in Drosophila. 696
Molecular Biology and Evolution 21:2130-2139. 697
698
DATA ACCESSIBILITY 699
Data are available in the NCBI short read archive (www.ncbi.nlm.nih.gov/sra) BioProject ID 700
PRJNA344726. 701
702
AUTHOR CONTRIBUTIONS 703
JEM, SHA, RD designed research, SEM, BMN, SHA performed research, RD, AEW analysed 704
data, RD, JEM, SHA, AEW wrote paper, all authors revised paper. 705
TABLES 707
Table 1. Rates of evolution (dN/dS) for sex biased genes. Values for sex-biased gene
708
categories that are significantly different from unbiased genes are in bold. 709
Expression class
Total contigs
Orthologsa Filter
b dN (95% CI) significancec dS (95% CI) significancec
dN/dS
(95% CI) significancec
Male-biased
2590 1567 1435 0.022 (0.021-0.023)
P < 0.0001
0.344 (0.337-0.351)
P < 0.0001
0.064 (0.061-0.067)
P < 0.0001
Female-biased
2858 1603 1481 0.023 (0.022-0.024)
P < 0.0001
0.347 (0.342-0.353)
P = 0.024
0.066 (0.063-0.068)
P < 0.0001
Unbiased 3458 2175 1996 0.021 (0.020-0.021) 0.351 (0.345-0.356) 0.059 (0.057-0.061) a
Number of contigs that are 1:1:1 orthologs with X. maculatus and G. aculeatus.
710
b
Number of 1:1:1 orthologs after filtering. 711
c
Significance based on 2-tailed permutations tests (1000 replicates), compared to unbiased 712 genes 713 714 715 716
Table 2. McDonald-Kreitman tests for selection 717
Expression class Contigsa Positive selectionb (significance)
Male-biased 425 19
(P = 0.0056)
Female-biased 231 5
n.s
Unbiased 623 9
a
Number of 1:1:1 orthologs after filtering. 718
b
Number of contigs with significant positive selection (significant deviations in DN, DS, PN and
719
PS, and DN/DS > PN/PS). P values from Fisher’s Exact test compare sex-biased to unbiased
FIGURES 725
726
Figure 1. The ocellated wrasse (Symphodus ocellatus) has three male morphs. Brightly 727
coloured nesting males (top left) hold territories and females (bottom left) prefer to mate 728
with nesting males. Satellites associate (bottom right) with nesting males and help defend 729
731
732
733
Figure 2. Hierarchical clustering and heat maps based on average within-morph expression 734
for females (FEM), nesting males (NM), satellite males (SAT) and sneaker males (SN) for (A) 735
female-biased genes (n = 2,858) and (B) male-biased genes (n = 2,590). Confidence intervals 736
for hierarchical clustering are based on 1000 bootstrap replicates, and branches with <80% 737
support have been collapsed. 738
740
741
Figure 3. Factor analysis of three male morphs based on normalized RPKM values for all 742
expressed contigs. Nesting males are identified with circles and a black ellipse, satellite 743
males with triangles and a dark grey ellipse, and sneaker males with squares and a light grey 744
ellipse. 745
746
747
749
Figure 4. Gene expression for each of the morphs for (A) febiased genes and (B) male-750
biased genes. Data is divided into quartiles based upon expression level in females for panel 751
(A) and males for panel (B). Red = females (FEM), dark blue = nesting males (NM), light blue 752
= satellite males (SAT) and white = sneaker males (SN). Significance is indicated based on 753
Wilcoxon rank sum tests (* = p < 0.05, ** = p < 0.01, *** = p < 0.001). 754
755
756
757
758
! " #$ ! " $ ! " $ ! " #$
%& '& ( ) ('
***
** **
* *
+
&
! $ ! "$ ! "$ ! $
%& '& ( ) ('
*** **
**
*** *** ***
759
Figure 5. Gene expression variance for each of the morphs for (A) female-biased genes and 760
(B) male-biased genes. Data is divided into quartiles based upon expression level in females 761
for panel (A) and males for panel (B). Red = females, dark blue = nesting males, light blue = 762
satellite males and white = sneaker males. Significance is indicated based on Wilcoxon rank 763
sum tests (* = p < 0.05, ** = p < 0.01, *** = p < 0.001). 764
765
766
767
768
769
,
,
,
,
,
-.
! " #$ ! " $ ! " $ ! " #$
%& '& ( ) ('
*** ***
*** ***
*** *
** ***
,
,
,
,
,
+
-.
&
! $ ! "$ ! "$ ! $
%& '& ( ) ('
* *
***
770
Figure 6. Male-biased gene expression for genes under putative positive selection for each 771
of the morphs. Red = females, dark blue = nesting males, light blue = satellite males and 772
white = sneaker males. Significance is indicated based on Wilcoxon rank sum tests (* = p < 773
0.05, ** = p < 0.01, *** = p < 0.001). 774
775
&
! //$ ! " $ ! / $ ! "/$
%& '& ( ) ('
****
*** **
*