This is a repository copy of
A projected decrease in lightning under climate change
.
White Rose Research Online URL for this paper:
http://eprints.whiterose.ac.uk/127172/
Version: Supplemental Material
Article:
Finney, DL orcid.org/0000-0002-3334-6935, Doherty, RM, Wild, O et al. (3 more authors)
(2018) A projected decrease in lightning under climate change. Nature Climate Change, 8
(3). pp. 210-213. ISSN 1758-678X
https://doi.org/10.1038/s41558-018-0072-6
(c) 2018 Macmillan Publishers Limited, part of Springer Nature. This is a post-peer-review,
pre-copyedit version of an article published in Nature Climate Change. The final
authenticated version is available online at: https:// doi.org/10.1038/s41558-018-0072-6
[email protected] Reuse
Items deposited in White Rose Research Online are protected by copyright, with all rights reserved unless indicated otherwise. They may be downloaded and/or printed for private study, or other acts as permitted by national copyright laws. The publisher or other rights holders may allow further reproduction and re-use of the full text version. This is indicated by the licence information on the White Rose Research Online record for the item.
Takedown
If you consider content in White Rose Research Online to be in breach of UK law, please notify us by
Supplementary information for “A projected decrease in
lightning under global warming”
Declan Finney, Ruth Doherty, Oliver Wild, David Stevenson, Ian MacKenzie and
Alan Blyth
Calculation of the probability of lightning occurrence: The lightning parametrisation
calculates a flash rate for each grid cell at every time step. Here we calculate the probability
of lightning occurring (i.e. a flash rate greater than zero), in a grid cell and in a model time
step. Each occurrence of a flash rate greater than zero counts as 1 in the calculation of
probability.
where is the total number of grid cells, is the total number of time steps. if the
flash rate in grid cell, , and time step, , is non-zero, or otherwise. is therefore the
probability of any flashes occurring in a grid cell and model time step. If the flash rate
distribution shifts to more or less intense flash rates then the total flashes can change
independently of the change in probability of flashes.
Calculation of the uncertainty in total methane radiative forcing due to the uncertainty
in LNOx response to climate change: The prescribed methane concentration for the
present-day simulation is 1750 ppbv, and for the year 2100 RCP8.5 simulation is 3750 ppbv.
Using the method of calculating methane radiative forcing listed in the methods section1, the
RF between 2000 and 2100 of prescribed methane concentrations under RCP8.5 is 598 mW
m-2. The methane RF associated with the LNOx response to climate change is -20.3 and
+33.7 mW m-2 for the CTH and IFLUX schemes, respectively. This corresponds to
for the future climate. However, for transient climate simulations an interactive sampling level
is needed, and we provide some initial suggestions for this here.
The equation used to calculate the future sampling level in this study (see methods) can be
applied to any time, . The equation can be applied at each time step, or over longer
timescales, such as yearly. Longer timescales might be helpful in reducing noise and make
more efficient use of computational resources.
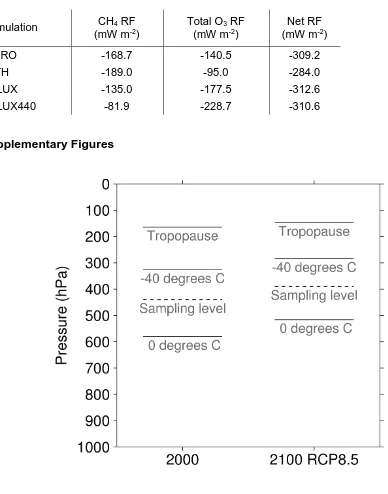
In determining the future sampling level we considered multiple approaches besides our
main approach outlined in the Methods. All the approaches considered produced a future
sampling level of 390 hPa ± 3 hPa. Considering instead a consistent temperature value, in
the present-day simulation the mean temperature of the 440 hPa pressure level is ~250K
and this same temperature occurs at 390 hPa in the future simulation. Alternatively,
considering the relative position between the mean pressure of the 0°C and -40°C isotherm s
( ), instead of 0°C and the tropopause as used in the main approach, also
suggested a future level of ~390 hPa was appropriate. In developing a method for transient
climate simulations, these alternative reference levels could be used be used to calculate the
sampling level.
References
1. Myhre, G., Highwood, E. J., Shine, K. P. & Stordal, F. New estimates of radiative
forcing due to well mixed greenhouse gases. Geophys. Res. Lett. 25, 2715–2718
(1998).
2. Hoerling, M. P., Schaack, T. K. & Lenzen, A. J. A global analysis of stratospheric–
tropospheric exchange during northern winter. Mon. Weather Rev. 121, 162–172
Supplementary Tables
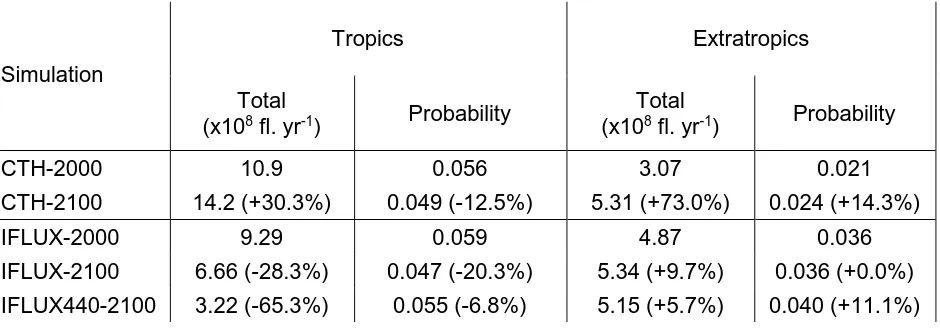
Table S1. Total annual flashes and probability of lightning occurrence in the tropics (±23°
latitude) and extratropics (23°-90° latitude) for each simulation in the 2000s and 2100s.
Percentage changes relative to 2000 for each approach are given in brackets. The
probability metric represents the probability of lightning occurring in any given grid cell and
hour over the course of the year. Results use a single year of simulation.
Simulation
Tropics Extratropics
Total
(x108 fl. yr-1) Probability
Total
(x108 fl. yr-1) Probability
CTH-2000 10.9 0.056 3.07 0.021
CTH-2100 14.2 (+30.3%) 0.049 (-12.5%) 5.31 (+73.0%) 0.024 (+14.3%)
IFLUX-2000 9.29 0.059 4.87 0.036
[image:4.595.77.547.241.405.2]IFLUX-2100 6.66 (-28.3%) 0.047 (-20.3%) 5.34 (+9.7%) 0.036 (+0.0%) IFLUX440-2100 3.22 (-65.3%) 0.055 (-6.8%) 5.15 (+5.7%) 0.040 (+11.1%)
Table S2. Change in total annual flashes and atmospheric composition for the fixed
sampling level simulation in the 2100s compared to the 2000s. Extension of Table 1 in the
main text.
Simulation Global lightning (x109 fl. yr-1)
Tropospheric ozone burden (DU)
Tropospheric ozone lifetime (days)
Methane lifetime (yrs)
IFLUX-2000 1.42 266 19.8 9.9
Table S3. Radiative forcing estimates in each set of simulations between year 2000 and year
2100 under RCP8.5, using the typical set of parameters given in the methods.
Simulation CH4 RF (mW m-2)
Total O3 RF (mW m-2)
Net RF (mW m-2)
ZERO -168.7 -140.5 -309.2
CTH -189.0 -95.0 -284.0
IFLUX -135.0 -177.5 -312.6
IFLUX440 -81.9 -228.7 -310.6
Supplementary Figures
Figure S2 Change in: (a) annual average surface temperature for all future simulations and (b) lightning flash rate using a fixed sampling level of 440hPa in both the future year 2100 and present-day year 2000 simulations. The change is calculated between the decadal mean for year 2000 and year 2100 RCP8.5. Hatching on (b) is where the change is not significant at the 5% level. The change in global mean surface temperature is +4.87K.
[image:6.595.83.539.307.652.2]