Envelopes.
White Rose Research Online URL for this paper: http://eprints.whiterose.ac.uk/107139/
Version: Accepted Version
Article:
Millar, TJ, Walsh, C orcid.org/0000-0001-6078-786X, Cordiner, MA et al. (2 more authors) (2007) Hydrocarbon Anions in Interstellar Clouds and Circumstellar Envelopes. The Astrophysical Journal Letters, 662 (2). L87-L90. ISSN 2041-8205
https://doi.org/10.1086/519376
© 2007. The American Astronomical Society. All rights reserved. This is an author
produced version of a paper published in The Astrophysical Journal Letters . Uploaded in accordance with the publisher's self-archiving policy.
[email protected] https://eprints.whiterose.ac.uk/ Reuse
Unless indicated otherwise, fulltext items are protected by copyright with all rights reserved. The copyright exception in section 29 of the Copyright, Designs and Patents Act 1988 allows the making of a single copy solely for the purpose of non-commercial research or private study within the limits of fair dealing. The publisher or other rights-holder may allow further reproduction and re-use of this version - refer to the White Rose Research Online record for this item. Where records identify the publisher as the copyright holder, users can verify any specific terms of use on the publisher’s website.
Takedown
If you consider content in White Rose Research Online to be in breach of UK law, please notify us by
arXiv:0705.0639v2 [astro-ph] 7 May 2007
envelopes
T. J. Millar, C. Walsh and M. A. Cordiner
Astrophysics Research Centre, School of Mathematics and Physics, Queen’s University Belfast, Belfast BT7 1NN, Northern Ireland
[email protected], [email protected], [email protected]
and
R. N´ı Chuim´ın
Jodrell Bank Centre for Astrophysics, School of Physics and Astronomy, University of Manchester, Sackville St., Manchester M60 1QD, UK
and
Eric Herbst
Departments of Physics, Chemistry and Astronomy, The Ohio State University, Columbus, OH 43210-1106
ABSTRACT
The recent detection of the hydrocarbon anion C6H− in the interstellar
medium has led us to investigate the synthesis of hydrocarbon anions in a variety of interstellar and circumstellar environments. We find that the anion/neutral abundance ratio can be quite large, on the order of at least a few percent, once the neutral has more than five carbon atoms. Detailed modeling shows that the column densities of C6H− observed in IRC+10216 and TMC-1 can be
re-produced. Our calculations also predict that other hydrocarbon anions, such as C4H− and C8H−, are viable candidates for detection in IRC+10216, TMC-1 and
photon-dominated regions such as the Horsehead Nebula.
1. Introduction
The recent detection of C6H− in the carbon-rich AGB star IRC+10216 and the cold,
dense interstellar cloud TMC-1 by McCarthy et al. (2006) with abundance ratios relative to C6H of 0.01–0.1 indicates that anions may play a more significant role in interstellar physics
and chemistry than heretofore believed.
The possibility that a relatively large fraction of molecular material in interstellar clouds might be in the form of anions was first suggested by Herbst (1981) who pointed out that carbon chain molecules and other radicals have large electron affinities, leading to high ra-diative attachment rates such as those measured by Woodin et al. (1980) with the attendant possibility of anion/neutral fractions on the order of a few percent. More recently, it has been recognized that PAH anions could soak up a significant fraction of the free electrons in inter-stellar clouds and alter the charge balance to a significant degree (Lepp & Dalgarno 1988a) as well as providing significant heating through photodetachment of electrons in diffuse clouds (Lepp & Dalgarno 1988b). Petrie (1996) has investigated the synthesis of CN− by the
dis-sociative attachment of MgCN and MgNC and other mechanisms, while Petrie & Herbst (1997) showed that C3N− could be detectable in interstellar clouds. The study of large
hy-drocarbons anions received some attention following the observation by Tulej et al. (1998) that absorption bands in several carbon-chain anions coincided with several of the diffuse interstellar bands. Subsequently, the formation of such species in diffuse clouds was studied by Ruffle et al. (1999) who showed, in particular, that C−
7 was unlikely to be a source for any
DIBs. Millar et al. (2000) considered the formation of hydrocarbon anions containing more than six carbon atoms in the carbon-rich circumstellar envelope of IRC+10216 and showed that appreciable column densities could arise in the outer envelope.
2. Chemical Model
The basic route to the formation of anions is electron radiative attachment:
X+e−−→X−+hν, (1)
collisional rate once the number of carbon atoms is larger than five; for C4H, the attachment
efficiency is only around 1%. Barckholtz et al. (2001) have shown experimentally that nei-ther carbon-chain anions nor hydrocarbon anions react with H2 but do so with H atoms. We
have also included loss reactions of anions with C, C+, C
2H+2 (in IRC+10216), and photons,
with all cation-anion rate coefficients taken to be 10−7 cm3 s−1. For the photodetachment
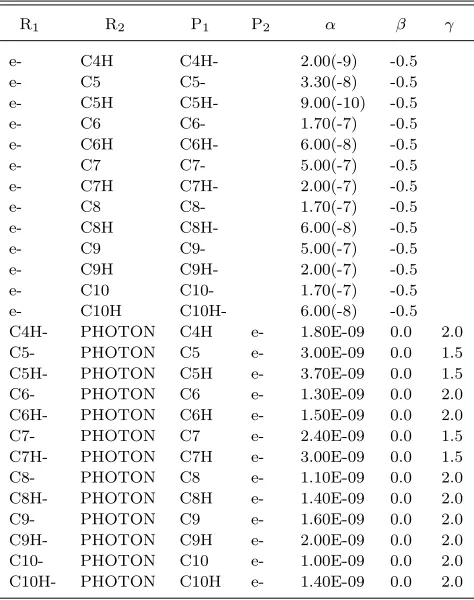
rates, some of which are shown in Table 1, we have assumed the cross section σ to depend on photon energy ǫ via the relation
σ =σ0(1−EA/ǫ)0.5, ǫ≥EA, (2)
whereσ0 = 1.0×10⁻¹⁷ cm2 and EAis the electron affinity of the neutral molecule. Relevant
electron affinities have been obtained from theoretical and experimental results (Herbst, in preparation). The UV radiation field as described by Mathis et al. (1983) has been adopted. We have extended earlier models such as that by Ruffle et al. (1999), which included C−
n,
n = 7–23, and by Millar et al. (2000), which included CnH−, n = 7–23, down to anions containing four carbon atoms following the determination of the microwave spectrum of C4H− by Gupta et al. (2007).
In addition to the reactions discussed above, we have included in the CSE and PDR models radiative association between carbon-chain anions and neutrals leading to carbon chains of up to 23 carbon atoms (Millar et al. 2000), while in the dark cloud models we have included reactions between anions and O atoms, with a rate coefficient of 10−10 cm3 s−1,
unless specifically measured (Eichelberger et al. 2002).
3. Results
3.1. Circumstellar Envelope
We model the carbon-rich AGB star IRC+10216 using the numerical model developed by Millar et al. (2000) and Millar (2003). They modelled the formation of anions with more than six carbon atoms and showed that the anion radial distribution could extend beyond 1017 cm and relative to their neutral analogues, abundance ratios approaching 0.1 (for C−
7, for example) could be achieved. Some results of our present calculation in which
we have extended our species down to C4H− are shown in Table 2 and Figure 1. Our results
show that column densities of 1.0×1013 cm−2 for C
4H− to 2.3×1013 cm−2 for C10H− are
achievable, with anion-to-neutral column density ratios of 0.008 for C4H to around 0.3–0.4
for C6H, C8H and C10H. Note that although the electron attachment efficiency for C4H is
only around 1% that of C6H and C8H, C4H− has a relatively large column density since C4H
region interior to a radial distance of 8×1016 cm, the main loss of anions occurs through
reaction with H atoms, while mutual neutralisation with C+ dominates in (1.8−13)×1017
cm. Elsewhere photodetachment is the major loss route.
McCarthy et al. (2006) measured a C6H− column density of 3×1012 cm−2,
approxi-mately 60 times less than is produced in our model. Although the column density is over-produced, it is important to note that the column densities of the large hydrocarbon chains are very sensitive to the initial abundance of acetylene adopted in the model. This results from the fact that the most efficient method of growth is via the addition of C2 units. For
example, if the initial abundance of C2H2 is reduced by five, the column density of C6H
is reduced by about 45 and that of C10H by 100. The anion column densities are not
af-fected as much, typically reducing by about an order of magnitude, since less acetylene also leads to a reduction in the abundances of H atoms and C+ in the envelope. The observed
anion-to-neutral ratio is 0.01–0.1 where the range is due to the range of reported C6H
col-umn densities (Kawaguchi et al 1995; Gu´elin et al. 1997), but is in reasonable agreement with the calculated value of 0.3, given the uncertainties in the rates of anion formation (by radiative electron attachment), and destruction.
Finally we note that the anion abundances can be greater than that of free electrons in the region around 5×1016 cm. This reflects the efficiency of carbon-chain growth and
electron attachment. A similar result is found in dark cloud models when PAHs are included (Lepp & Dalgarno 1988a).
3.2. Dark Clouds
Here we adopt parameters applicable to the cold dust cloud TMC-1 (n(H2) = 2×10⁴
cm−3, T = 10 K, A
V = 10 mag.) and perform quasi-time-dependent modeling. The initial elemental abundances of C, N and O relative to H are 7.30×10⁻⁵, 2.14×10⁻⁵and 1.76×10⁻⁴,
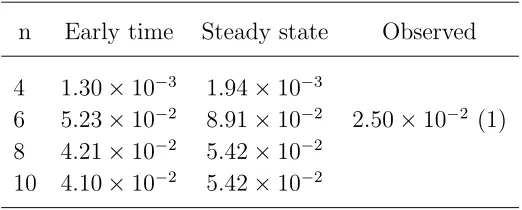
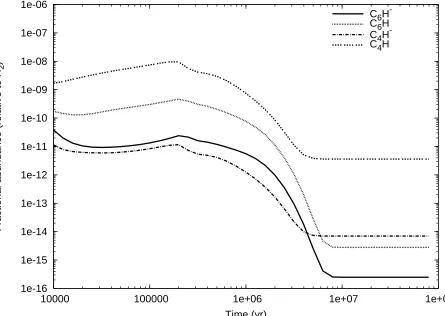
respectively. Figure 2 shows the time-dependent evolution of the fractional abundances (with respect to H2) of C4H−and C6H−and their corresponding neutrals from 104 yr while Table 3
and Table 4 present anion column densities and anion/neutral ratios respectively, at both early-time (3.16×10⁵ yr) and steady state (> 108 yr). We adopt N(H
2) = 1022 cm−2 in
calculating the molecular column densities.
Steady-state abundances are very low due to the incorporation of carbon into CO but much better agreement occurs at earlier times in the evolution. The column density of C6H−
produced in our model at early time (3.16×10⁵ yr), 1.35×1011 cm−2, is very close to that
the neutral C6H at early time to be 2.58×1012 cm−2, which is in good agreement with the
observed value of 4.10×1012 cm−2 (Bell et al. 1999). The observed anion-to-neutral ratio is
0.025, which is in very good agreement with the calculated early-time value of 0.052, given the uncertainties in assorted rate coefficients.
3.3. Photon-Dominated Regions
We have used the code developed by the Meudon group (Le Petit et al. 2006) with the additional hydrocarbon chemistry described above. For this model we assume a fixed tem-perature of 50 K and parameters representative of those in the Horsehead Nebula; i.e., G = 60G0, where G0 is the interstellar UV radiation field, AV = 10 mag. to the cloud cen-ter, and a total hydrogen density of 2×104 cm−3. These models are steady-state, which is
achieved rapidly due to the enhanced UV field and fast photodestruction rates. The PDR models show that the anionic species formed can survive exposure to a high radiation field present in regions such as the Horsehead Nebula because, given the high electron abun-dance, the formation path of electron attachment is efficient enough to overcome the rapid photodetechment of the fragile anions. This high electron abundance at low to intermediate extinction can be inferred from the C+abundance in Fig. 3, which also shows that significant
abundances of the anions arise at low extinction (AV ∼ 1.5–3 mag.). At low AV, ∼ 0.5–2 mag., the dominant loss of anions is through mutual neutralisation with C+ (and to a lesser
extent through reactions with atomic hydrogen). Thus, since n(C+) = n(e) in this region,
the anion/neutral abundance ratio depends on the ratio of the rate coefficients for electron attachment and mutual neutralisation. For species with more than five carbon atoms, this leads to abundance ratios greater than unity; for smaller species, the ratio is less than one. In fact, the abundances of the anions are, in some cases, larger than the neutral species. Relevant results are listed in Table 5. Most notably, C8H− and C10H− are more dominant
than the neutral species with fractional abundances over an order of magnitude greater than those of C8H and C10H.
Since the PDR model provides abundances perpendicular to the line-of-sight for a PDR seen edge on, as is the case for the Horsehead Nebula, it is more appropriate to compare fractional abundances rather than column densities. The peak abundance of C4H is
consis-tent with observations of the Horsehead region made by Teyssier et al. (2004). Although the relative abundance of C4H− (3.5%) to its neutral analog is not as high as C6H− or C8H−,
the higher abundance of the neutral species allows a significantly large absolute value of this anion to be formed. The C6H− anion has a peak abundance of 4.7 times that of the
(2004), who calculated a peak abundance relative to H2 of 1.0×10⁻¹⁰, about one order of
magnitude greater than calculated. It is possible that we are missing an important formation mechanism in this environment. One possibility is that hydrocarbon abundances are boosted by destruction of PAH particles, rather than being synthesized from smaller species. In any case, our anion/neutral ratios are independent of the mode of formation of the neutral.
4. Conclusion
We find that electron attachment to hydrocarbon molecules is very efficient for species containing more than five carbon atoms. The anions are created so efficiently that they can be abundant even in regions where they are destroyed rapidly by photons, such as CSEs and PDRs, and in dark clouds, despite the low fractional abundance of electrons. In particular, we find that anions such as C6H−, C8H− and C10H− can have abundances relative to their
neutral analogs ranging from a few percent to greater than unity, while C4H−, although
formed relatively inefficiently through electron attachment, can be observable in astronomical objects, given the large column densities of C4H detected. In fact, as this paper was being
prepared, we became aware of a preprint by Cernicharo et al. in which the detection of C4H−
in IRC+10216 is reported with a C4H−/C6H− column density ratio of 1/7, compared to our
calculated value of 1/17.
Astrophysics at QUB is supported by a grant from PPARC. RNC and TJM are sup-ported by by the European Community’s human potential programme under contract MCRTN-CT-512302, ‘The Molecular Universe’, CW by a scholarship from the Northern Ireland De-partment of Employment and Learning, and MAC by QUB. EH acknowledges support for his research program in astrochemistry by the National Science Foundation. We thank Dr. Aigen Li for providing us his code to calculate radiation intensity as a function of wavelength and extinction.
REFERENCES
Avery, L. W., Amano, T., Bell, M. B., Feldman, P. A., Johns, J. W. C., MacLeod, J. M., Matthews, H. E., Morton, D. C., Watson, J. K. G., Turner, B. E., Hayashi, S. S., Watt, G. D., & Webster, A. S. 1992 ApJS, 83, 363
Bell, M. B., Feldman, P. A., Watson, J. K. G., McCarthy, M. C., Travers, M. J., Gottlieb, C. A., & Thaddeus, P. 1999, ApJ, 518, 740
Dayal, A., & Bieging, J. H. 1993, ApJ, 407, L37
Eichelberger, B., Barckholtz, C., Stepanovic, M., Bierbaum, V. M., & Snow, T. P. 2002, NASA Laboratory Astrophysics Workshop, ed. F. Salama, NASA/CP-2002-21186, p. 120
Gu´elin, M., Friberg, P., & Mezaoui, A. 1982, A&A, 109, 23
Gu´elin, M., Cernicharo, J., Travers, M. J., McCarthy, M. C., Gottlieb, C. A., Thaddeus, P., Ohishi, M., Saito, S., & Yamamoto, S. 1997, A&A, 317, L1
Gupta, H. C., Br¨unken, S., Tamassia, F., Gottlieb, C. A., McCarthy, M. C., & Thaddeus, P. 2007, ApJ, 655, L57
Herbst, E. 1981, Nature, 289, 656
Kawaguchi K., Kasai, Y., Ishikawa, S., & Kaifu, N. 1995, PASP, 47, 853
Le Petit, F., Nehme´e, C., Le Bourlot, J., & Roueff, E. 2006, ApJS, 164, 506
Lepp, S., & Dalgarno, A. 1988a, ApJ, 324, 553
Lepp, S., & Dalgarno, A. 1988b, ApJ, 335, 769
Mathis, J. S., Mezger, P. G., & Panagia, N. 1983, A&A, 128, 212
McCarthy, M. C., Gottlieb, C. A., Gupta, H. C., & Thaddeus, P. 2006, ApJ, 652, L141
Millar, T. J. 2003, in Asymptotic Giant Branch Stars, eds. H. J. Habing & H. Olofsson, New York: Springer, 247
Millar, T. J., Herbst, E., & Bettens, R. P. A. 2000, MNRAS, 316, 195
Petrie, S. 1996, MNRAS, 281, 137
Petrie, S., & Herbst, E. 1997, ApJ, 491, 210
Ruffle, D. P., Bettens, R. P. A., Terzieva, R., & Herbst, E. 1999, ApJ, 523, 678
Terzieva, R., & Herbst, E. 2000, Int. J. Mass Spectrom., 201, 135
Tulej, M., Kirkwood, D. A., Pachkov, M., & Maier, J. P. 1998, ApJ, 506, L69
Woodin, R., Foster, M. S., & Beauchamp, J. L. 1980, J. Chem. Phys., 72, 4223
Table 1. Some reactions and rate coefficientsa,b
R1 R2 P1 P2 α β γ
e- C4H C4H- 2.00(-9) -0.5 e- C5 C5- 3.30(-8) -0.5 e- C5H C5H- 9.00(-10) -0.5 e- C6 C6- 1.70(-7) -0.5 e- C6H C6H- 6.00(-8) -0.5 e- C7 C7- 5.00(-7) -0.5 e- C7H C7H- 2.00(-7) -0.5 e- C8 C8- 1.70(-7) -0.5 e- C8H C8H- 6.00(-8) -0.5 e- C9 C9- 5.00(-7) -0.5 e- C9H C9H- 2.00(-7) -0.5 e- C10 C10- 1.70(-7) -0.5 e- C10H C10H- 6.00(-8) -0.5 C4H- PHOTON C4H e- 1.80E-09 0.0 2.0 C5- PHOTON C5 e- 3.00E-09 0.0 1.5 C5H- PHOTON C5H e- 3.70E-09 0.0 1.5 C6- PHOTON C6 e- 1.30E-09 0.0 2.0 C6H- PHOTON C6H e- 1.50E-09 0.0 2.0 C7- PHOTON C7 e- 2.40E-09 0.0 1.5 C7H- PHOTON C7H e- 3.00E-09 0.0 1.5 C8- PHOTON C8 e- 1.10E-09 0.0 2.0 C8H- PHOTON C8H e- 1.40E-09 0.0 2.0 C9- PHOTON C9 e- 1.60E-09 0.0 2.0 C9H- PHOTON C9H e- 2.00E-09 0.0 2.0 C10- PHOTON C10 e- 1.00E-09 0.0 2.0 C10H- PHOTON C10H e- 1.40E-09 0.0 2.0
a
Rate coefficientsk=α(T /300)βexp (
−γ/T) in units of cm
3
s−1
b
[image:10.612.188.425.242.542.2]Table 2. IRC+10216 hydrocarbon anion chemistry model results
Species Column density Peak abundance Observed column density (cm−2) rel. to H
2 (cm−2)
C4H 1.3×10¹⁵ 2.1×10⁻⁶ 2−9×10¹⁵ (1, 2, 3, 4)
C4H− 1.0×10¹³ 1.3×10⁻⁸
C6H 5.7×10¹⁴ 1.2×10⁻⁶ 0.3−3×10¹⁴ (3, 4)
C6H− 1.7×10¹⁴ 2.6×10⁻⁷ 3×10¹² (5)
C8H 2.1×10¹⁴ 4.4×10⁻⁷ 5×10¹² (4)
C8H− 5.8×10¹³ 1.4×10⁻⁷
C10H 5.8×10¹³ 1.3×10⁻⁷
C10H− 2.3×10¹³ 8.3×10⁻⁸
[image:11.612.118.493.290.471.2]Table 3. TMC-1 hydrocarbon anion chemistry model results
Early time Steady state
Species Column density Column density Observed column density
(cm−2) (cm−2) (cm−2)
C4H 4.30×10¹³ 3.60×10¹⁰ 3.4×10¹⁴ (1)
C4H− 5.58×10¹⁰ 6.99×10⁷
C6H 2.58×10¹² 2.78×10⁷ 4.1×10¹² (2)
C6H− 1.35×10¹¹ 2.47×10⁶ 1.0×10¹¹ (3)
C8H 7.76×10¹¹ 1.63×10⁶ 2.2×10¹¹ (2)
C8H− 3.27×10¹⁰ 6.83×10⁴
C10H 8.98×10¹⁰ 3.78×10³
C10H− 3.67×10⁹ 2.05×10²
[image:12.612.117.496.279.494.2]Table 4. TMC-1 hydrocarbon anion-to-neutral ratios CnH−/CnH
n Early time Steady state Observed
4 1.30×10⁻³ 1.94×10⁻³
6 5.23×10⁻² 8.91×10⁻² 2.50×10⁻² (1)
8 4.21×10⁻² 5.42×10⁻²
10 4.10×10⁻² 5.42×10⁻²
[image:13.612.176.437.342.447.2]Table 5. Horsehead Nebula hydrocarbon anion chemistry model results
Species Peak abundance Obs. peak abundance rel. to H2 rel. to H2
C4H 2.4×10⁻⁹ 3.0±1.2×10⁻⁹ (1)
C4H− 8.4×10⁻¹¹
C6H 9.6×10⁻¹² 1.0±0.6×10⁻¹⁰ (1)
C6H− 4.5×10⁻¹¹
C8H 5.3×10⁻¹²
C8H− 9.3×10⁻¹¹
C10H 3.8×10⁻¹²
C10H− 5.5×10⁻¹¹
[image:14.612.171.440.303.484.2]1e-12 1e-11 1e-10 1e-09 1e-08 1e-07 1e-06 1e-05 1e-04 0.001
1e+16 1e+17 1e+18
Fractional abundance
Radius (cm)
CO C4H C4H -C6H C6H -
[image:15.612.87.534.224.548.2]1e-16 1e-15 1e-14 1e-13 1e-12 1e-11 1e-10 1e-09 1e-08 1e-07 1e-06
10000 100000 1e+06 1e+07 1e+08
Fractional abundance (relative to H
2
)
Time (yr)
[image:16.612.84.529.235.551.2]C6H -C6H C4H -C4H
1e-20 1e-18 1e-16 1e-14 1e-12 1e-10 1e-08 1e-06 1e-04 0.01 1
0 1 2 3 4 5 6 7 8 9 10
Abundance (relative to H2)
Av
C+ C4H C4H-C6H
[image:17.612.79.530.226.553.2]