promoting access to White Rose research papers
Universities of Leeds, Sheffield and York
http://eprints.whiterose.ac.uk/
This is an author produced version of a paper published in Journal of Computer-Aided Molecular Design.
White Rose Research Online URL for this paper:
http://eprints.whiterose.ac.uk/78608
Published paper
Cottrell, S.J., Gillet, V.J. and Taylor, R. (2006) Incorporating partial matches within multiobjective pharmacophore identification. Journal of Computer-Aided Molecular Design, 20 (12). 735 - 749.
Incorporating Partial Matches within Multiobjective Pharmacophore
Identification
Simon J. Cottrell
1†, Valerie J. Gillet
1, Robin Taylor
21
Department of Information Studies, University of Sheffield, Regent Court, 211
Portobello Street, Sheffield S1 4DP, UK.
2
Cambridge Crystallographic Data Centre, 12 Union Road, Cambridge, CB2 1EZ, UK
Keywords: pharmacophore, molecular alignment, MOGA, multiobjective optimisation,
multiobjective genetic algorithm, partial matches
Summary
This paper describes the extension of our earlier multiobjective method for generating
plausible pharmacophore hypotheses to incorporate partial matches. Diverse sets of
molecules rarely adopt exactly the same binding mode, and so allowing the identification
of partial matches allows our program to be applied to larger and more diverse datasets.
The method explores the conformational space of a series of ligands simultaneously with
their alignments using a multiobjective genetic algorithm. The principles of Pareto
ranking are used to evolve a diverse set of pharmacophore hypotheses that are optimised
on conformational energy of the ligands, the goodness of the overlay and the volume of
the overlay. A partial match is defined as a pharmacophoric feature that is present in at
least two, but not all, of the ligands in the set. The number of ligands that map to a given
pharmacophore point is taken into account when evaluating an overlay. The method is
applied to a number of test cases extracted from the Protein Data Bank where the true
overlay is known.
†
Current address: Institut für Pharmazeutische Chemie, Philipps-Universität Marburg, Marbacher Weg 6,
Introduction
A pharmacophore describes the spatial arrangement of chemical features required for a
small molecule to bind to a receptor. Pharmacophore identification methods are usually
applied to a series of molecules known to bind to a receptor, when the three-dimensional
structure of the receptor is unknown. The first generation of pharmacophore identification
programs have been around for more than a decade [1-4]. However, recently some of the
limitations of these early methods have been highlighted [5, 6] and several new
approaches are now beginning to appear that address some of these limitations [7-10].
Pharmacophore identification involves identifying common pharamcophoric features
within the molecules, that is, atoms or functional groups that can interact with a receptor
in a similar way, and then aligning the bioactive conformations of the molecules such that
their corresponding features are overlaid. The bioactive conformations of the molecules
are not usually known and so some form of conformational analysis is usually carried
out. For many datasets, there are numerous plausible ways of overlaying the molecules,
due to the presence of multiple features within the molecules and due to the multiple
accessible conformers that may exist for each molecule. In such cases, it is important that
the chemist is presented with a range of alternative hypotheses that can be validated
further, for example, by database searching or by the synthesis of new compounds.
The quality of a pharmacophore hypothesis is usually judged on a number of criteria. For
example, the GASP program [2] evaluates a pharmacophore on the number of
pharmacophoric points it consists of, the quality of the mapping of each molecule onto
the pharmacophore (which includes consideration of site points together with their
associated heavy atoms), the common volume of the overlaid molecules and their
conformational energy. GASP is based on a traditional optimisation technique in which
the multiple criteria are combined into a single weighted-sum fitness function.
Specifically, the fitness function in GASP combines three components that take account
of the feature alignment, the volume overlap and the conformational energy. This
handled by a single-objective optimisation method, such as the genetic algorithm (GA) in
GASP.
There are, however, a number of limitations with traditional optimisation methods.
Typically the objectives are in competition with one another so that a better alignment (as
measured by the volume score, for example) can be achieved by conformers that are
strained away from their minimum energy conformations. Thus, a trade-off usually exists
in the criteria to be optimised. In the traditional approach, this is handled through the use
of relative weights which determine the relative importance given to the individual
objectives and the particular compromise solution that is sought. However, it can be
difficult to assign appropriate weights, especially when the criteria are
non-commensurate, as is the case here. Default weights in GASP were defined empirically by
analysing a relatively small number of test cases. However, there is no reason to assume
that a set of weights that is relevant for one particular test case will also be relevant for
another. Furthermore, the result of a single-objective optimisation is a single solution that
maximises (or minimises) the function, yet in the absence of the receptor itself, it is
unlikely to be possible to predict unambiguously how to overlay a series of ligands
known to bind to the receptor.
In a previous study, we have explored the use of a multiobjective optimisation method
which aims to find a diverse set of pharmacophore hypotheses that are all plausible for a
given set of ligands [9]. The algorithm explores the conformational space of the ligands
simultaneously with their alignment. The same objectives as in GASP are calculated, but
they are treated independently without the need to define relative weights. The method is
based on the Pareto principles of multiobjective optimisation [11, 12]. According to
these principles, a solution is defined as Pareto-optimal if none of the individual
objectives can be improved without worsening another objective. A representative set of
such solutions can then be extracted, chosen so that they include a diverse range of
individual objective values and molecular alignments. Our method was shown to be
in GASP was incorrect. To our knowledge, Pareto ranking was first applied in the field of
Chemoinformatics by Handschuh et al. for the flexible superposition of 3D structures
[13]. The differences between this first approach and our work are described in our
previous paper. More recently multiobjective optimisation methods have also been
applied to combinatorial library design [14], derivation of quantitative structure activity
relationships [15] and to the de novo design of molecules [16]. Multiobjective
optimisation techniques have also been applied to pharmacophore identification in the
GALAHAD program; the full details of this method are not yet published; however, the
underlying approach appears to be quite different to that described here [10].
In our previous work [9] we were able to demonstrate the benefits of the multiobjective
optimisation approach over a traditional GA, however, we also highlighted a limitation in
the method which also applies to GASP. This is the restriction that each pharmacophore
point generated must be mapped to a feature in every ligand. This effectively limits both
programs to handling very small numbers of carefully chosen compounds [5]. In this
paper, we build on the previous work by increasing the functionality of the multiobjective
optimisation approach to allow partial matches to be identified for a series of ligands.
Other programs exist that can find overlays involving partial feature matches (e.g.
Catalyst HipHop [17]), but we believe our algorithm to be a novel method of
incorporating partial matching into a multiobjective pharmacophore search program. The
result is to widen the search so that solutions containing partial matches are automatically
considered alongside more restricted solutions, with no necessity for any user input.
Implementation of partial matches has required significant changes to be made to the
chromosome representation, the alignment method and to the feature score so that full
matches are distinguished from partial matches. Allowing partial matches to be identified
increases the search space to be explored significantly and so we have introduced the use
of distance constraints which can be used to improve the effectiveness of the algorithm.
We have also extended the definition of hydrophobes to include aliphatic rings and to
allow user-defined hydrophobic features. Taken together, these enhancements allow
applied to sets of ligands extracted from the Protein Data Bank (PDB) [18] where the true
pharmacophores are known. Examples have been chosen where partial matches are
known to exist and the new methodology is validated on the ability of the MOGA to
identify ligand overlays that are close to those obtained by least-squares superposition of
the corresponding experimental protein-ligand structures. However, it should be noted
that in all cases a range of different hypotheses are found.
Method
We have extended the multiobjective genetic algorithm (MOGA) described previously
[9] to allow the pharmacophore hypotheses identified to include partial matches. A partial
match is defined as a pharmacophoric feature that is present in at least two, but not all, of
the ligands in the set. The algorithm is described in detail below, with particular emphasis
given to the new methodology.
The ligands are input to the program as energy minimised conformations. The first step is
to identify the pharmacophoric features within each ligand. Donor and acceptor features
are defined as in GASP, however, the definition of a hydrophobe has been extended to
include aliphatic rings and user-defined groups, in addition to the aromatic rings defined
previously. Each hydrophobic ring is represented by a virtual point created at the centre
of the ring and a normal to the ring. A user-defined hydrophobe, such as a t-butyl group,
is specified as a list of atoms and a virtual point is created at the centroid of the atoms.
Donors and acceptors are represented by virtual points that correspond to the hypothetical
positions of acceptors or donors in the receptor binding site. Thus, a virtual point is
created at 2.9Å from the heavy atom attached to each hydrogen-bond donor proton and at
2.9Å from the heavy atom associated with each acceptor lone pair.
Encoding conformation
The chromosome consists of a conformational part and a mapping part which is described
below. The conformational part consists of a set of N strings to represent the
an 8-bit number, which gives a resolution of about 1.4°. This encoding of conformation is
unchanged from our previous work [9].
Encoding Partial Mappings
The mapping part of the chromosome has been modified substantially from that described
previously [9] to encode both full and partial mappings in a mapping table. The mapping
table consists of one row per molecule with each column representing a potential
pharmacophore point of a particular type. The cells in a column represent the features in
each molecule that are mapped to the corresponding pharmacophore point. The number
of columns of each feature type is user-defined and need not be larger than the maximum
number of features of that type in any molecule in the set. If set to a smaller value, the
search space is reduced – making it more tractable – but there is a risk that the reduced
search space might not contain the true solution. Partial mappings are encoded through
the use of dummy features which are added to the real features in each molecule. Like
real features, they are of a specific type, i.e. donor, acceptor or hydrophobe. Each cell of
the mapping table may contain either a real or a dummy feature of the relevant molecule.
Thus, the number of molecules which have a real feature contained within a given
column may vary between zero and the number of molecules in the dataset. A mapping
column that contains real features in fewer than two molecules has no physical
significance. Thus, the number of real mappings may vary depending on how many
columns contain real features in at least two molecules.
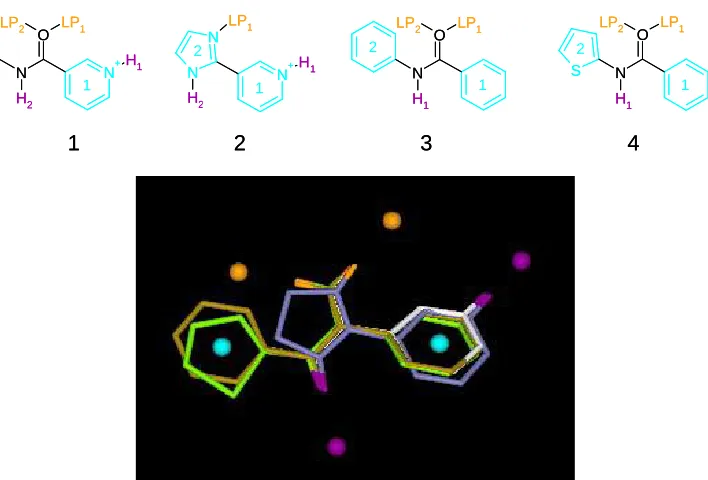
A mapping table is illustrated in Figure 1 for a hypothetical set of molecules that bind at
the same (hypothetical) site but form different and overlapping sets of interactions. The
most plausible way of overlaying the molecules is shown and a hypothetical chromosome
that would lead to this alignment is shown in Table 1. Note that only the mapping part of
the chromosome is shown; it is assumed that the conformational part contains appropriate
torsion angles. The chromosome refers to the features of each molecule using the labels
N+H1 O N H21 LP1 LP2 1 N H21
N+H1 N
LP1
1 2
LP2 LP1 O
N
H1 1 2 S O N H1 LP1 LP2 1 2
1 2 3 4
N+H1 O N H21 LP1 LP2 1 N H21
N+H1 N
LP1
1 2
LP2 LP1 O
N
H1 1 2 S O N H1 LP1 LP2 1 2
1 2 3 4
Figure 1. An overlay of hypothetical molecules 1-4 that corresponds to the mapping
shown in Table 1. 1 is white, 2 is blue, 3 is brown and 4 is green. The donors are shown
in purple and acceptors in orange. The hydrophobic groups are not highlighted to ease
distinction of the molecules
There are three mapping columns for each feature type. The first donor column
represents a donor formed by H1 in molecule 1 and H1 in molecule 2. Molecules 3 and 4
do not have features that map to this pharmacophore point, as represented by the dummy
features. The second donor column represents a donor that is mapped to a feature in every
molecule (specifically H2 in 1, H2 in 2, H1 in 3 and H1 in 4). The third donor column is
not mapped to a real feature in any of the molecules and hence does not represent a
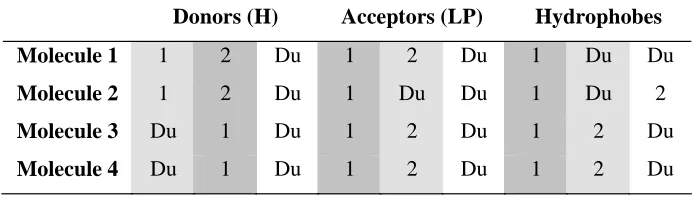
[image:8.595.120.474.157.397.2]Donors (H) Acceptors (LP) Hydrophobes
Molecule 1 1 2 Du 1 2 Du 1 Du Du
Molecule 2 1 2 Du 1 Du Du 1 Du 2
Molecule 3 Du 1 Du 1 2 Du 1 2 Du
[image:9.595.124.474.149.249.2]Molecule 4 Du 1 Du 1 2 Du 1 2 Du
Table 1. A mapping table that leads to the overlay in Figure 1. The number of columns
of each type is user-defined. The integers in the columns refer to the subscript labels used
to identify donors and acceptors and to the ring labels used to identify the hydrophobes.
“Du” indicates a dummy feature. Dark shading indicates mappings involving all
molecules. Light shaded columns indicate partial mappings and the unshaded columns
involve fewer than two molecules and do not represent real mappings.
The population of chromosomes is initialised by making random assignments of
molecule features (real and dummy) in the mapping table and by assigning torsion angles
at random. The genetic operators of crossover and mutation are applied to the
chromosomes in order to generate child chromosomes. Dummy features are treated in the
same way as real features by the genetic operators; however, they are not used in the
alignment procedure which is described below.
Generating an Alignment
The information encoded in the chromosome is used to generate an alignment of the
molecules prior to evaluation of the fitness of the chromosome. First, a conformation is
generated for each molecule by applying the appropriate bond rotations encoded in the
conformation part of the chromosome. The alignment is then built incrementally using
the mapping table and a “framework” method that is similar to that described by Sutcliffe
et al. for the alignment of protein sequences [19] but has been adapted to allow for partial
mappings. Consider a mapping table consisting of n rows (molecules) and m columns
row consisting of m features, Pk1 toPkm, (each of which may represent a real feature or a
dummy), is fitted to a framework which has been derived from the mappings of
molecules 1, …, k–1. In the description below, framework kF refers to the framework that
has been derived from molecules 1, …, k. The framework data structure consists of m
points, each related to one of the mapping columns in the chromosome. Each point
represents a potential pharmacophore point, derived from real features in the related
mapping column, or it may be null, if the column consists entirely of dummy features for
molecules 1, …, k. The point in kF related to mapping column a shall be denoted kFa.
The framework is initialised with the first molecule. For each mapping column a that
maps to a real feature in molecule 1, 1Fa is set to the co-ordinates of feature P1a. For each
column that maps to a dummy feature, 1Fa is a null point. Then, for each subsequent
molecule i, where 1 i n, framework iF is calculated by least-squares fitting of
moleculei to framework i–1F as follows.
For each mapping a:
(i) Ifi–1Fa is null and Pia is a dummy feature, iFa is null.
(ii) Ifi–1Fa is non-null and Pia is a dummy feature, iFa is set equal to i–1Fa.
(iii) Ifi–1Fa is null and Pia is a real feature, iFa is set equal to the co-ordinates of Pia.
(iv) Ifi–1Fa is non-null and Pia is a real feature, iFa becomes the weighted centroid
ofi–1Fa and the co-ordinates of Pia. The calculation is weighted towards i–1Fa
in the ratio r(i–1Fa):1 where r(i–1Fa) is the number of real features which
mapping a maps in molecules 1, …, i–1, i.e. the number of points from which
i–1
Fa was derived.
Only in case (iv) does mapping a represent an actual mapping between molecule i and the
preceding molecules. Therefore the least-squares fitting between framework i–1F and
moleculei is restricted to the mappings falling into case (iv) and it can only be performed
if the mapping involves at least three points. Any chromosome which does not contain at
least three real mappings in every molecule is rejected. The least-squares fitting is based
The sequential alignment of the molecules to a common framework results in the
framework being adjusted at each step to reflect all the molecules incorporated thus far.
However, the alignment that is generated is dependent on the order in which the
molecules are specified in the configuration file. Specifically, while the mapping of
moleculek does influence the alignment of any molecule l, where l>k, it cannot influence
the alignment of molecules i and j relative to each other, where i,j < k. In Sutcliffe’s
approach, a particular molecule is chosen at random for the initial alignment; however,
the bias caused by this is minimised by iteratively refining the alignment until the
variation in the framework from one iteration to the next is less than a specified
threshold. This has not been implemented here and development of an order-independent
method is currently being investigated.
Fitness Calculation
Once an alignment has been generated, it is then possible to calculate the objective scores
for the solution. Our method uses three objectives: a feature objective, a volume
objective, and an energy objective.
The feature score is based on that implemented previously but has been adapted here to
reflect partial mappings in the pharmacophore. Thus, it takes into account the number of
pharamcophoric points, the number of molecules that are mapped to each pharmacophore
point and the quality of the overlay. Firstly, a pharmacophore point only contributes to
the score if the mapped features are overlaid sufficiently closely. Thus, even though a set
of features may be mapped in the chromosome, if it is not possible to overlay them
closely they do not contribute to the feature score. For each valid pharmacophore point, a
score that is a function of the RMSD between the features involved in the mapping and
their centroid is calculated. This score takes into account the overlay of both the heavy
atoms and the virtual points for hydrogen-bonding features, and both the overlay of the
ring centroids and the alignment of the ring normals for the hydrophobic features, as
described in Jones et al. [2] Hence, pharmacophore points that are formed from closely
features that are poorly aligned. A weighting factor of 2m–n is then applied, where there
arem molecules in the mapping and n is the number of molecules in the dataset. Thus, a
mapping that excludes one molecule from a set of four would have a weight of ½, a
mapping that excludes two molecules would have a weight of ¼, and so on. Thus, more
weight is given to features that are common to the entire dataset and which are therefore
less likely to have arisen by chance, than to features which are found in only a subset of
the dataset. Furthermore, the weighting scheme ensures that a mapping involving all of
the molecules scores more highly than two mappings which each consist of a subset of
the molecules, assuming that the qualities of the alignments are similar.
The volume and energy scores are calculated as described previously and are described
here in brief. The volume objective score is defined as the mean overlap between the first
molecule and each of the other molecules. Each atom is considered as a hard sphere
whose radius is the van der Waals radius for the atom type as defined in the Tripos 5.2
force field. The volume overlap between two molecules is a sum of the hard-sphere
overlap for each pair of atoms between the two molecules, and is calculated using a
simple geometric formula. As for the alignment procedure, the volume score is biased by
the order in which the molecules are specified. The energy score is the mean of the
internal van der Waals energy calculated for each molecule. It is the only one of the three
objectives which is independent of the alignment of the molecules. The energy of each
molecule is a sum of the energy calculated for each pair of atoms within the molecule,
using a Lennard-Jones 6-12 potential based on the Tripos 5.2 force field.
Once the three objective scores have been calculated for each solution, Pareto ranking is
applied to the population. One solution is said to dominate another solution if it is better
in all three objectives. (For the feature and volume objectives, the aim is to maximise the
scores, while for the energy objective the aim is to minimise the score). The Pareto rank
of each solution is the number of other solutions in the population by which it is
dominated. Thus, the best solutions are those which are not dominated by any other
Evolution of the Population
The population evolves by application of the crossover and mutation genetic operators.
The parent chromosomes for these operators are chosen by roulette-wheel selection [11],
with selection biased towards individuals of lower rank. However, since a potentially
infinite number of solutions can exist on the Pareto surface it is necessary to include a
niching strategy to ensure that a diverse set of solutions is found. Maintaining diversity in
a MOGA is often achieved through the use of objective space niching, whereby
individuals that are in crowded regions of the search space are penalised relative to those
in sparsely populated regions. However, this strategy did not prove effective in this
application, as described previously [9], due to the weak correspondence between
diversity in objective space and diversity in the pharmacophores represented by the
individual solutions. Therefore, an alternative mapping-based niching scheme was
employed which has been modified here to account for partial mappings.
The first step is to cluster the individuals based on the mappings they represent. The
clustering step considers mappings that involve all of the molecules and does not take
into account differences in partial mappings. This is because differences in the partial
mappings usually only reflect small variations to the alignment of local regions of the
molecules with the overall alignments being similar. Furthermore, the clustering
compares all permutations of one mapping with another since there is no order imposed
on the columns included in the mapping table. The probabilities of selecting the
0 0 1 1 2 2 2 2 2 (a) (b) 0 0 1 1 2 2 2 2 2 0 0 1 1 2 2 2 2 2 0 0 1 1 2 2 2 2 2 (a) (b)
Figure 2. “Roulette-wheel” segments for two hypothetical MOGA populations, each
containing three distinct feature mappings or clusters (shown in different shades). (a)
Each individual is non-dominated, and so, initially, has an equal probability of being
chosen (left). After adjusting for the number of individuals in each cluster, there is an
equal probability of choosing a chromosome from each cluster (centre). (b) Some
individuals are dominated with the rank of each chromosome as shown (left). If two
clusters have the same density, the one containing individuals of lower mean rank is more
likely to be chosen. The relative probabilities of selecting the different individuals within
each cluster remain the same (centre.) In both cases, the probabilities are then further
adjusted through objective-space niching, but keeping the overall probability of selecting
an individual from each cluster the same (right).
Distance Constraints.
Allowing partial mappings to exist within a pharmacophore greatly increases the size of
the search space, compared to the more restrictive case when all features must be present
in all molecules. Although the aim of the partial matching methodology is to increase the
[image:14.595.113.484.124.350.2]molecules are feature rich. However, a significant reduction in the search space can be
achieved through the use of distance constraints which can be used to eliminate solutions
containing geometrically infeasible mappings from the population.
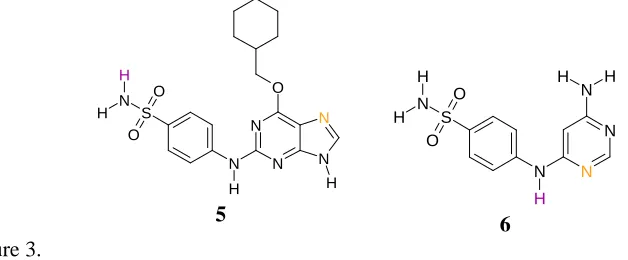
[image:15.595.119.433.186.316.2]N N N N O N H H S N O O H H 5 N N N N H S N O O H H H H 6 Figure 3.
For example, consider the two CDK2 inhibitors in Figure 3. The donor arising from the
sulphonamide group and acceptor highlighted in 5 are constrained to lie much further
apart than the highlighted donor and acceptor in 6 (for which there is no flexibility at all),
and it is therefore not possible to overlay both sets of mapped features simultaneously.
Upper and lower bounds on the distance between each pair of features within each
molecule can be calculated, for example, using distance geometry techniques [21]. A
chromosome is rejected if it contains a mapping between feature X1 and X2 in molecule
X and feature Y1 and Y2, respectively, in molecule Y and:
TOLERANCE min max or TOLERANCE max min 2 Y , 1 Y 2 X , 1 X 2 Y , 1 Y 2 X , 1 X d d d d
where dX1,X2 is the intramolecular distance between X1 and X2, etc. and the
TOLERANCE is set to 2.0 Å.
Results
The partial match methodology has been applied to two sets of ligands extracted from the
PDB [18]. The ligands were extracted from their respective complexes and energy
minimised using the Tripos 5.2 force field with Gasteiger-Marsili charges assigned. The
MOGA was then used to identify plausible pharmacophores. In the following
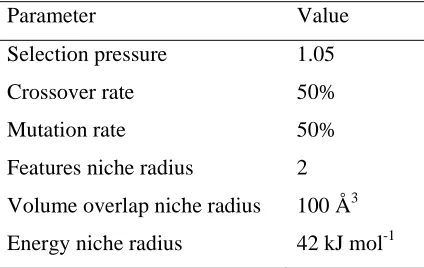
features. Unless otherwise stated, the runs were performed on a 2.8 GHz Linux PC using
the parameters shown in Table 2. The number of operations and the number of mapping
columns in the chromosome varied between experiments and are specified in the details
of each experiment.
Parameter Value
Selection pressure 1.05
Crossover rate 50%
Mutation rate 50%
Features niche radius 2
Volume overlap niche radius 100 Å3
[image:16.595.191.403.200.334.2]Energy niche radius 42 kJ mol-1
Table 2. MOGA parameters.
Carbonic Anhydrase Dataset
The carbonic anhydrases are a family of enzymes which catalyse the conversion of water
and carbon dioxide to bicarbonate and a proton. Inhibitors of carbonic anhydrase,
particularly carbonic anhydrase II (CAII), have been successfully used to treat elevated
intraocular pressure, the main cause of glaucoma [22]. The MOGA has been applied to a
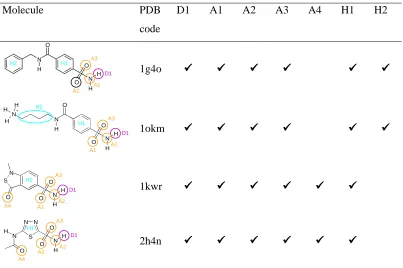
set of four inhibitors of human CAII, shown in Table 3. The true alignment of the
ligands in the binding pocket was obtained by overlaying the protein structures using
Relibase+ [23]. The interactions between the ligands and the protein were deduced by
visual examination of the complexes and by referring to the literature references given for
each entry in the PDB and are shown in Table 4. The features of the ligands have been
Molecule PDB
code
D1 A1 A2 A3 A4 H1 H2
1g4o
1okm
1kwr
[image:17.595.98.501.141.409.2]2h4n O
Table 3. CAII dataset. The interactions each ligand makes with the protein are shown.
Type Label Interacting protein residue(s)
Donor D1 THR199
A1 ZN262 A2 ZN262 A3 THR199 Acceptor A4 GLN92 H1 LEU198 Hydrophobe
H2 PHE131, VAL135, PRO202, LEU204
Table 4. The key interactions involved in binding to CAII.
The carbonic anhydrase binding site contains a zinc ion which is important to the mode
of action of the enzyme [24]. Many carbonic anhydrase inhibitors, including all four in
this dataset, coordinate to this zinc ion through a sulphonamide group [25]. Our program
[image:17.595.156.435.442.593.2]the same types of functional group that are able to act as hydrogen bond acceptors tend to
also coordinate to metal atoms. Therefore, the MOGA is able to generate pharmacophore
points relating to the metal interactions, but gives these points acceptor type.
In view of its size, the butyl fragment in 1okm was treated as a hydrophobe. In fact, it
forms hydrophobic interactions with the same protein residues as the terminal aromatic
ring in 1g4o, and is very closely superimposed on that ring in the overlay of the crystal
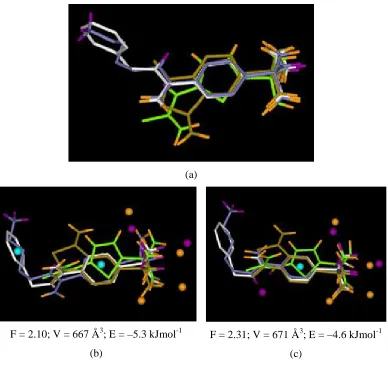
structures, as shown in Figure 4(a).
The interactions of the sulphonamide group and the adjacent hydrophobic ring are
common to all four molecules, whereas the other interactions are present in only a subset
of the dataset. When GASP is applied to this dataset, it consistently aligns the
sulphonamide and H1 features correctly, and generates associated pharmacophore points.
However, since there are no features in the other parts of the molecules that are common
to the whole dataset, there is no incentive in terms of an improved fitness score for these
parts of the molecules (such as the flexible tails of 1g4o and 1okm) to be aligned, and
their relative conformations are arbitrary.
Figures 4(b) and 4(c) show typical solutions generated from a MOGA run with the CAII
dataset. This run used a population size of 500 and was run for 200,000 operations,
taking about one hour. Three donor, six acceptor and two hydrophobe mapping columns
were used in the chromosome. The other parameters were set as in Table 2. In both
cases, it can be seen that the MOGA has correctly aligned the sulphonamide groups and
H1 hydrophobic rings, and generated associated pharmacophore points. In overlay 4(b), a
hydrophobic pharmacophore point has also been generated that corresponds to the partial
match involving the aromatic H2 ring in 1g4o and the butyl hydrophobe in 1okm. In
solution 4(c), an acceptor point has been generated that corresponds to the partial match
involving 1kwr and 2h4n. Solution 4(c), however, illustrates a limitation of our current
method, since the H2 hydrophobic features have been overlaid but the mapping is not
small size and inflexibility of the ligands, however, slight differences are seen in the
alignment and conformations of the two larger molecules.
(a)
F = 2.10; V = 667 Å3; E = –5.3 kJmol-1
(b)
F = 2.31; V = 671 Å3; E = –4.6 kJmol-1
(c)
Figure 4. The carbonic anhydrase dataset. 1g4o is white, 1okm is blue, 1kwr is brown
and 2h4n is green. (a) PDB overlay of the CAII inhibitors; (b) and (c) show typical
MOGA solutions together with their objective scores. Donors are highlighted in purple,
[image:19.595.104.492.178.546.2]Cyclin Dependent Kinase 2 Datatset.
The cyclin-dependent kinases are a class of proteins which play a vital role in the cell
cycle, the mechanism by which eukaryotic cell division occurs [26]. Under normal
circumstances, cell cycle progression is highly regulated. Dysfunction of the normal
regulatory processes is a critical feature of human cancers; therefore, the development of
therapies which inhibit uncontrolled cell reproduction is currently an important area of
pharmaceutical interest. Numerous crystal structures of complexes of ligands bound in
the ATP binding pocket of Cyclin Dependent Kinase 2 (CDK2) are available in the PDB.
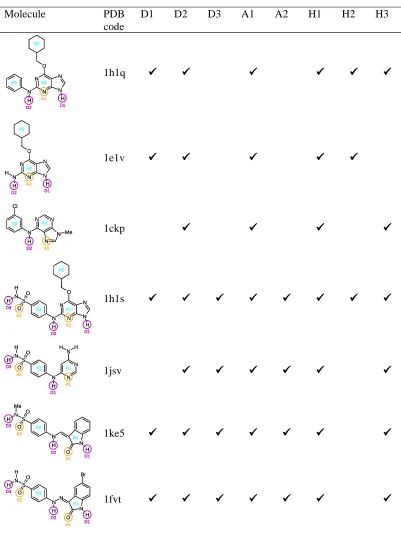
The ligands are shown in Table 5 and include some from the comparative study of
pharmacophore generation programs carried out by Patel et al. [5]. As for the CAII
dataset, the true alignment of the ligands in the binding pocket was obtained by
overlaying the protein structures using Relibase+ [23] and the interactions between the
ligands and the protein were deduced by visual inspection and by referring to the
literature references given for each entry in the PDB. The features of the ligands have
been labelled according to the interactions they make with the protein (Table 6), using the
labelling scheme of Patel et al., which has been extended to include additional
interactions not relevant to their dataset.
The CDK2 dataset is of interest in evaluating the identification of partial matches since
several of the ligands, including the natural substrate, ATP, contain a purine ring system
or another ring system of identical shape, but the ring systems adopt different alignments
in different complexes. In the 2D diagrams in Table 5, the molecules are drawn so that
their relative orientations correspond as closely as possible to the actual binding modes.
Only three of the eight interactions are common to all seven molecule and even if the
dataset is divided into subsets, there is only one pair of molecules (1ke5 and 1fvv) which
form exactly the same set of interactions. Thus, it would not be easy to analyse this
dataset using a pharmacophore program that is restricted to finding interactions that are
The dataset was initially divided into two subsets as shown below, both of which involve
Molecule PDB code
D1 D2 D3 A1 A2 H1 H2 H3
N N N N O N H H H1 D1 H2 H3 D2 A1 N N N N O N H H H1 D1 D1 H2 H3 D2 D2 A1 A1 1h1q N N N N O N H H H H1 H2 D1 D2 A1 N N N N O N H H H H1 H2 D1 D1 D2 D2 A1 A1 1e1v N N N N N H Cl Me H1 H3 D2 A1 N N N N N H Cl Me H1 H3 D2 D2 A1A1
1ckp N N N N O N H H S N O O H H H1 H2 H3 D1 D3 A1 A2 D2 N N N N O N H H S N O O H H H1 H2 H3 D1 D1 D3 D3 A1 A1 A2 A2 D2 D2 1h1s N N N N H S N O O H H H H H1 H3 D2 D3 A1 A2 N N N N H S N O O H H H H H1 H3 D2 D2 D3 D3 A1 A1 A2 A2 1jsv N O N S N O O Me H H H H1 H3 D1 D2 D3 A1 A2 N O N S N O O Me H H H H1 H3 D1 D1 D2 D2 D3 D3 A1 A1 A2 A2 1ke5 N O N N S N O O H H H H Br H1 H3 D1 D2 D3 A1 A2 N O N N S N O O H H H H Br H1 H3 D1 D1 D2 D2 D3 D3 A1 A1 A2 A2 1fvt
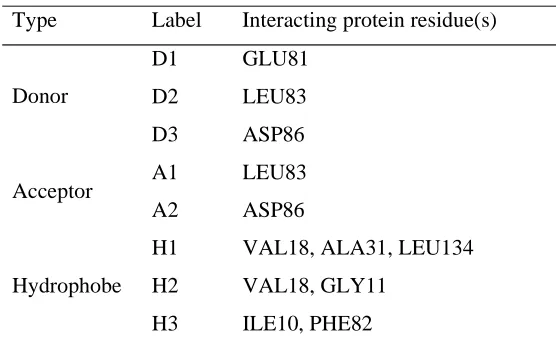
[image:22.595.96.497.137.671.2]Type Label Interacting protein residue(s)
D1 GLU81
D2 LEU83
Donor
D3 ASP86
A1 LEU83
Acceptor
A2 ASP86
H1 VAL18, ALA31, LEU134
H2 VAL18, GLY11
Hydrophobe
[image:23.595.158.438.141.314.2]H3 ILE10, PHE82
Table 6. The key interactions involved in binding to CDK2.
Subset 1: 1h1q, 1e1v, 1ckp
Molecules 1h1q, 1e1v and 1ckp were chosen for the initial experiment as they are
relatively simple, but the purine rings bind in different orientations and all three
molecules form interactions not common to the whole dataset. The overlay generated
from the PDB structures is shown in Figure 5(a); the actual interactions formed with the
protein are D2, A1 and H1 (by all molecules), D1 and H2 (by 1h1q and 1e1v only), and
H3 (by 1h1q and 1ckp only).
The MOGA was run with a population size of 1000 for 100,000 operations and took
around 1.5 hours. Two donor, one acceptor and three hydrophobe mapping columns
were used in the chromosome. A representative set of solutions generated in a typical
run, together with their objective scores, is shown in Figures 5(b) to 5(e). The MOGA
consistently generated solutions very similar to the true overlay, such as that shown in
Figure 5(b). This solution contains six pharmacophore points (as many as are possible
given the number of mapping columns used), three of which are common to all three
molecules. The MOGA correctly identified the partial interactions D1 (present in 1h1q
and 1e1v only), D2 (present in all three molecules) and H3 (present in 1h1q and 1ckp
only). Two pharmacophore points were generated for interaction H1. This illustrates a
[image:23.595.160.438.142.314.2]treated as an individual hydrophobe so that fused ring systems cannot be recognised as a
single hydrophobe. Although the cyclohexyl rings in 1h1q and 1e1v were overlaid, there
were insufficient mapping columns to generate a point from these features as well as the
two points generated for H1.
No pharmacophore point was generated in relation to interaction A1. Instead, the single
acceptor mapping column was used to generate a point from a different set of nitrogen
atoms on a different part of the ring systems. This illustrates a fundamental limitation of
pharmacophore elucidation, which is not specific to our method, that if features of the
same type are present at a common position in every molecule, then a pharmacophore
point will generally be generated from these features, even if they do not actually make
an interaction with the protein. In fact, the acceptors that have been mapped are slightly
better aligned than the features that are overlaid in the true alignment, which partially
explains why the MOGA generated a point from these features instead.
Other plausible solutions, such as those shown in Figures 5(c) to (e) were also generated.
Because 1h1q has an almost symmetrical arrangement of two acceptors and one donor, it
was very common for 1e1v to be flipped relative to the true overlay, so that the opposite
combination of donors is mapped between 1h1q and 1e1v. This is illustrated in overlay
5(c), which is otherwise fairly similar to the true overlay. Overlays 5(d) and 5(e) show
two alternative overlays, in which the molecules are aligned such that a much larger
volume is common to all three molecules. In both of these cases, four of the five
pharmacophore points generated result from a mapping between all three molecules.
Molecule 1ckp is flipped in solution 5(d) so that a hydrophobic feature is identified that is
(a)
F = 4.44; V = 973Å3; E =-1.6kJmol-1
(b)
F = 3.76; V = 836Å3; E =-2.8kJmol-1
(c)
F = 3.59; V = 880Å3; E =-2.4kJmol-1
(d)
F = 3.87; V = 795Å3; E =-2.7kJmol-1
(e)
Figure 5. CDK2 subset 1. 1h1q is white; 1e1v is blue; and 1ckp is brown. (a) The PDB
for CDK2 subset 1. Donors are highlighted in purple, acceptors in orange and
hydrophobes in cyan.
Subset 2: 1h1s, 1jsv, 1ke5, 1fvt
1h1s is identical to 1h1q except for the addition of a sulphonamide group on the benzene
ring, and it makes the same interactions as 1h1q, together with additional interactions via
the sulphonamide group. In fact, the presence of the sulphonamide group leads to a
150-fold greater affinity of 1h1s relative to 1h1q, due to the formation of hydrogen bonds by
one of the sulphonamide hydrogens and one of the oxygens to the ASP86 residue of the
protein [27]. All of the other molecules in this subset also possess sulphonamide groups
which overlay very closely on the sulphonamide group of 1h1s, as shown in the PDB
overlay in Figure 6(a). The common interactions formed by this subset are D2, D3, A1,
A2, H1 and H3 (all molecules) and D1 (1h1s, 1ke5 and 1fvt only).
The MOGA was run with a population size of 1000 for 100,000 operations and took
around 1.4 hours. Four donors, five acceptors and two hydrophobe mapping columns
were used in the chromosome, to allow for the possibility of mapping multiple features
within the sulphonamide groups. Almost all of the solutions generated by the MOGA
comprised approximately the same alignment as the true overlay. However, two
solutions showing some variation in the exact alignment are shown in Figures 6(b) and
6(c). The correct interactions have mostly been identified. However, there is no
pharmacophore point relating to interaction H1. As discussed for the CAII dataset, a
limitation of the current method is that features can be overlaid even though they are not
included in the mapping encoded in the chromosome, and hence they do not result in the
generation of a pharmacophore point. Similarly, where several features are overlaid, it is
possible that only a subset of these features is mapped. In this case, a pharmacophore
point would be generated, but its feature score would be based only on the features that
are mapped. Hence, the score would be smaller than if all the features were mapped.
Pharmacophore points have been identified within the sulphonamide groups; however,
the MOGA cannot be expected to correctly identify the rotation of the sulphonamide
groups relative to the adjacent aromatic rings, since any rotation consistently applied to
each molecule would lead to an overlay of the features. Although only one of the
sulphonamide hydrogens and one lone pair actually makes an interaction with the protein,
the other hydrogens and lone pairs are still overlaid. Therefore, the MOGA has generated
additional points related to the sulphonamide features.
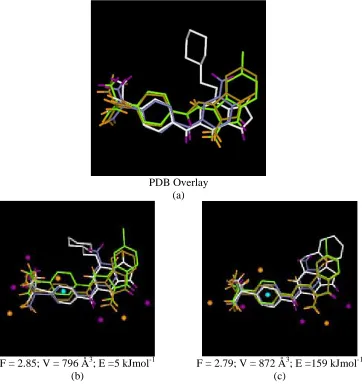
PDB Overlay (a)
F = 2.85; V = 796 Å3; E =5 kJmol-1
(b)
F = 2.79; V = 872 Å3; E =159 kJmol-1
(c)
Figure 6. CDK2 subset 2. (a) the PDB overlay. (b) and (c) show example solutions
together with their objective scores. Donors are highlighted in purple, acceptors in orange
[image:27.595.119.481.257.648.2]Full dataset
The MOGA was applied to the full set of molecules, excluding 1fvt which was not
included since it is identical to 1ke5 apart from the addition of a bromine atom. Distance
constraints were derived following a systematic search and were used to reduce the
search space explored by the MOGA.
The MOGA was run with a population size of 2000 for 200,000 operations, five donor,
six acceptor and three hydrophobe columns were specified and the run took around 15
hours. The population size and number of operations were increased due to the increase
in search space for this larger set of feature rich molecules. The true overlay is shown in
Figure 7(a) and a MOGA solution that is close to the PDB-derived solution is shown in
Figure 7(b). All of the molecules except 1ke5 are aligned approximately correctly.
However, 1ke5 is flipped relative to the true overlay so that its sulphonamide group is
facing in the opposite direction to those of 1h1s and 1jsv. In fact, the true overlay does
not show a particularly close alignment of 1ke5 to the other molecules. Although the
alignment shown does not enable the sulphonamide group of 1ke5 to map to the other
sulphonamides, the contribution of any potential sulphonamide mappings to the total
feature score must be small because they can involve at most three out of the six
molecules. Any potential improvement in the feature score that would result from
mapping the three sulphonamide groups is probably outweighed by the closer alignment
(a) (b)
[image:29.595.99.518.143.317.2]F = 1.66; V = 942 Å3; E =101 kJmol-1
Figure 7. The full CDK2 dataset. 1h1q is shown in white, 1e1v in blue, 1ckp in brown,
1h1s in yellow, 1jsv in green and 1ke5 in grey. (a) The PDB overlay and (b) an overlay
generated by the MOGA. Donors are highlighted in purple, acceptors in orange and
Conclusions
The paper has described the extension of our earlier work [9] to incorporate partial
matches within a multiobjective optimisation approach to pharmacophore identification.
Pharmacophore methods are particularly useful if they can be applied to datasets of
structurally diverse molecules, where they may be able to suggest overlays that are not
obvious to the chemist. However, diverse sets of molecules rarely adopt exactly the same
binding mode. Hence, programs that make the assumption of a common binding mode
are not able to handle diverse datasets effectively. Allowing the identification of partial
matches removes the restriction that every molecule must match every pharamcophore
point, which allows the program to be applied to larger and more diverse datasets.
The datasets investigated here were extracted from the PDB so that the true solution is
known and hence the program can be validated. However, pharmacophore identification
is typically used when structural information on the binding site is unavailable and in the
absence of such data, it is unlikely that a single solution could be predicted
unambiguously. Incorporating the improved functionality within a multiobjective
framework results in the identification of a family of plausible solutions where each
solution represents a different overlay involving different mappings between the
molecules, and where the solutions taken together explore a range of different
compromises in the objectives. The solutions are not ranked but are presented as equally
valid compromises between three objectives, according to the principles of Pareto
dominance. Importantly, the MOGA also takes into account the chemical diversity of the
solutions, thus ensuring that the solutions represent a diverse range of structure-activity
hypotheses which could be presented to a medicinal chemist for further consideration. In
cases where a large number of plausible hypotheses exist it would be beneficial to
provide the user with a browsing tool to facilitate navigation through the different
possibilities. Such a tool might incorporate clustering techniques similar to the
mapping-based clustering which is applied during the search process itself or clustering mapping-based on
The presence of partial matches also has implications on how such a pharmacophore
hypothesis would be used in database searching since it represents the union of the set of
features common to each pair of molecules. While a molecule which matches every
feature in the set is likely to be active, the hypothesis represents an over-restrictive
specification of the requirements for activity, since many or all of the known active
molecules possess only a subset of the features. Hence, when performing
pharmacophore-based virtual screening using a query generated with the partial matching
methodology, it would be useful to allow the identification of molecules which match
only a subset of the points in the query. The hits would then be likely to contain
molecules representing a range of binding modes, and the plausibility of each of these
could then be evaluated visually or experimentally by the user.
A number of areas for further improvement have been identified and are currently under
investigation. For example, as discussed, the implementation of the partial match
methodology required the development of a new alignment method whereby the
molecules are aligned sequentially to a common framework. When a molecule is
incorporated into the framework, the framework is adjusted to take account of all
molecules already aligned. However, the alignment method currently implemented is
dependent on the order in which the molecules are specified in the configuration file.
Future work will investigate the implementation of an order-independent method for the
multiple-molecule alignment with several methods having been described in the literature
[19, 28-30], Similarly, the volume objective function is order dependent which is also
unsatisfactory, since volumes that are common to most of the molecules but not the first
molecule currently make no contribution to the volume score. Thus, we are focussing on
taking into account any volume that is occupied by two or more molecules, but with the
contribution from each point in space weighted so that points occupied by more
molecules make a larger contribution to the overall score.
References
1. Güner, O. F. (Ed.) Pharmacophore Perception, Development and Use in Drug
Design. International University Line: La Jolla CA, 2000.
3. Barnum, D., Greene, J., Smellie, A. and Sprague, P. J. Chem. Inf. Comput. Sci., 36 (1996) 563.
4. Martin, Y. C., Bures, M. G., Danaher, E. A., Delazzer, J., Lico, I. and Pavlik, P.
A. J. Comput.-Aided Mol. Des., 7 (1993) 83.
5. Patel, Y., Gillet, V. J., Bravi, G. and Leach, A. R. J. Comput.-Aided Mol. Des., 16
(2002) 653.
6. van Drie, J. H. Curr. Pharm. Design, 9 (2003) 1649.
7. Richmond, N. J., Willett, P. and Clark, R. D. J. Mol. Graphics Model., 23 (2004)
199.
8. Feng, J., Sanil, A. and Young, S. S. J. Chem. Inf. Model., 46 (2006) 1352.
9. Cottrell, S. J., Gillet, V. J., Taylor, R. and Wilton, D. J. J. Comput.-Aided Mol.
Des., 18 (2004) 665.
10. Galahad. Tripos Inc., 1699 South Hanley Rd, St. Louis, Missouri, 63144, USA
11. Goldberg, D. E. Genetic Algorithms in Search, Optimization and Machine
Learning. Addison-Wesley: Wokingham, 1989.
12. Fonseca, C. M. and Fleming, P. J. IEEE Trans. Syst. Man Cybernet. Part A - Syst.
Humans, 28 (1998) 26.
13. Handschuh, S., Wagener, M. and Gasteiger, J. J. Chem. Inf. Comput. Sci., 32
(1998) 220.
14. Gillet, V. J., Khatib, W., Willett, P., Fleming, P. J. and Green, D. V. S. J. Chem.
Inf. Comput. Sci., 42 (2002) 375.
15. Nicolotti, O., Gillet, V. J., Fleming, P. J. and Green, D. V. S. J. Med. Chem., 45
(2002) 5069.
16. Brown, N., McKay, B. and Gasteiger, J. J. Comput.-Aided Mol. Des., 18 (2004)
761.
17. Catalyst. Accelrys, 9685 Scranton Road, San Diego, CA 92121, US.
18. Berman, H. M., Battistuz, T., Bhat, T. N., Blum, W. F., Bourne, P. E., Burkhardt,
K., Feng, Z., Gilliland, G. L., Iype, L., Jain, S., Fagan, P., Marvin, J., Padilla, D.,
Ravichandran, V., Schneider, B., Thanki, N., Weissig, H., Westbrook, J. D. and Zardecki, C. Acta Crystallogr., D58 (2002) 899.
19. Sutcliffe, M. J., Haneef, I., Carney, D. and Blundell, T. L. Protein Eng., 1 (1987)
377.
20. Kabsch, W. Acta Crystallogr., A32 (1976) 922.
21. Raymond, J. W. and Willett, P. J. Chem. Inf. Comput. Sci., 43 (2003) 908.
22. Supuran, C. T. and Scozzafava, A. Expert Opin. Therapeut. Patents, 12 (2002)
217.
23. Hendlich, M., Bergner, A., Gunther, J. and Klebe, G. J. Mol. Biol., 326 (2003)
607.
24. Tu, C. K., Silverman, D. N., Forsman, C., Jonsson, B. H. and Lindskog, S.
Biochemistry, 28 (1989) 7913.
25. Abbate, F., Supuran, C. T., Scozzafava, A., Orioli, P., Stubbs, M. T. and Klebe,
G. J. Med. Chem., 45 (2002) 3583.
26. Sielecki, T. M., Boylan, J. F., Benfield, P. A. and Trainor, G. L. J. Med. Chem.,
43 (2000) 1.
N., Mesguiche, V., Newell, D. R., Noble, M. E. M., Tucker, J. A., Wang, L. and Whitfield, H. J. Nat. Struct. Biol., 9 (2002) 745.
28. Mestres, J., Rohrer, D. C. and Maggiora, G. M. J. Comput. Chem., 18 (1997) 934.
29. Gerber, P. R. and Muller, K. Acta Crystallographica Section A, 43 (1987) 426.