Article
Traffic Data Analysis on Sathorn Road with Synchro
Optimization and Traffic Simulation
Kijawattanee Udomsilp1, Teeratat Arayakarnkul1, Sorawee Watarakitpaisarn2,
Patrachart Komolkiti2,*, Jittichai Rudjanakanoknad3, and Chaodit Aswakul4
1 International School of Engineering, Faculty of Engineering, Chulalongkorn University, Thailand 2 Sathorn Model Project, Faculty of Engineering, Chulalongkorn University, Thailand
3 Department of Civil Engineering, Faculty of Engineering, Chulalongkorn University, Thailand 4 Wireless Network and Future Internet Research Unit, Department of Electrical Engineering,
Faculty of Engineering, Chulalongkorn University, Thailand *E-mail: [email protected] (Corresponding author)
Abstract. Traffic problems have become a plague of the society that cannot be abolished. This work considers the city of Bangkok and its urban road traffic problem, with a particular focus on traffic light control. Managing traffic control by generating optimal traffic signal timing is one of the solutions to reduce the delay at intersections. Synchro is used as a platform to achieve two things in this work. First, to initialize optimal cycle lengths of the intersections on Sathorn road. Second, to assist in the implementation of reversible lane that involves two traffic signal lights in short distance. All of the data are obtained by the technical team of Sathorn Model project, most of which are based on the field work. A comparative analysis is conducted between optimal cycle lengths and the actual signal timing as operated by traffic police from real data collection to see the improvement of travel times in various cases.
Keywords: Signal optimization, synchro, travel time, traffic, cycle length.
ENGINEERING JOURNAL Volume 21 Issue 6 Received 28 August 2017
1. Introduction
Fast-growing economic development in any country contributing with higher mobility not only improves living quality of the citizens, but also causes hindrance in many areas. With the rapid increase of vehicles, the city of Bangkok could not provide enough spaces to reduce the congestion which leads to critical traffic problems [1].
World Business Council for Sustainable Development (WBCSD) has launched a project called “Sustainable Mobility Project 2.0”, which Bangkok is chosen as one of the demonstrator cities where several approaches are tested to alleviate traffic problem [2], also known as Sathorn Model [3]. As a part of it, this research’s boundary is scoped to Sathorn district in Bangkok. Sathorn district is chosen as an experimental area with two major reasons. Firstly, it is a critical Central Business District (CBD) area faced with oversaturated traffic condition and the slowest travel speed in Bangkok [4]. Secondly, there can hardly be any further development due to the existing infrastructure. Therefore, it is important to create better mobility by traffic flow management.
This work focuses on the traffic light control. It is important to note that, currently, the traffic light control in Bangkok is mostly manually-operated by traffic police during peak hours. The actual green times given to each direction are varying based on situations as observed by a traffic police on the site. The results are certainly inconsistent, which is common for any system that involves human error. Theoretically, the most basic way of estimating the proper green time is by the well-known Webster’s formula and its spin-offs [5]. However, in a more complicated scenario, simulators are commonly used [6]-[8]. Synchro, a macroscopic traffic optimization and simulation tool [8], [9], is chosen in this work. The objective of Synchro is to increase the efficiency of traffic network, thus the simulation supports complex calculations to satisfy the complicated traffic flow managing schemes. However, Synchro is developed on the basis of the American road pattern, which is right-hand traffic. However, since Thailand is a left-driving country, the network topology has been adjusted.
The purposes of this paper are to study and optimize traffic signal timing for each intersection on Sathorn Road: Sathorn-Surasak, Narinthorn, and Wittayu intersections. The results can assist the usage of signal control and further educate traffic police during critical periods along with reducing travel time for each vehicle on the road network [10], [11]. Moreover, since Sathorn district can be considered as CBD in Bangkok, there are huge daily incoming flows every working-day morning. As a result, a reversible lane scenario has been proposed. However, in order to implement the reversible lane, traffic lights must be coordinated, especially at Narinthorn intersection, where there are two traffic lights within a short distance. This case is investigated in this work as well, which time offset of two traffic lights is the key result [8]. Furthermore, to strengthen the validity of the analysis, real data from the field are used. In particular, the effect of motorcycles [12]-[14], typical to Bangkok, is considered. Finally, outputs from Synchro in a form of optimal green times are applied into a microscopic traffic simulation to further analyze the outcomes. While there exists several types of microscopic simulators [15], ‘SUMO’ [6] is chosen. SUMO is an integral part of the Sathorn Model project, because it is an open source simulator which allows the development to be done in various ways. SUMO is also calibrated to Sathorn traffic based on data from the field. Subsequently, the results have shown some improvement for travel time.
This paper is organized as follows. The description in Section 2 explains scenarios that have been implemented in Synchro and its methodologies. The results are presented in Section 3, then the further analysis and discussion of the results come next in Section 4. Finally, Section 5 gives the conclusion.
2. Simulation Preparation
This section provides the description of settings of this work, as required by Synchro. All of the data are obtained by the technical team of Sathorn Model project, most of which are based on the field work.
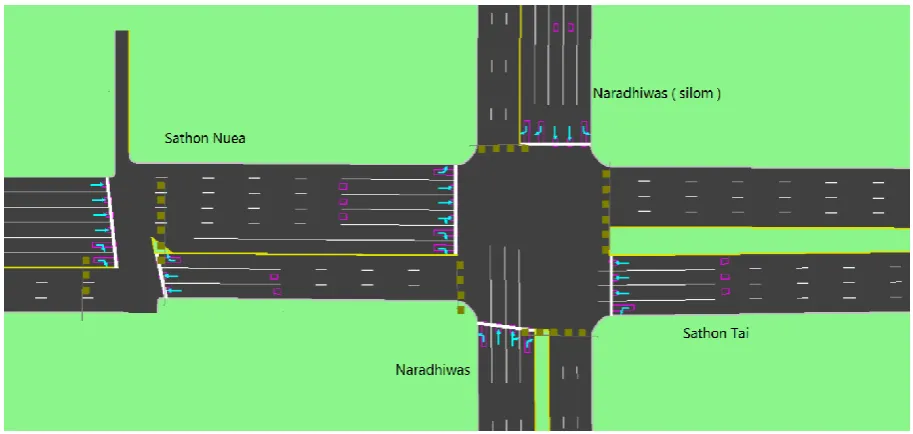
2.1. Scenario
respectively, with proper direction assignment to be as realistic as possible. Evening time period is the focus of these intersections. Separately, Narinthorn intersection with the implementation of the reversible lane, as shown in Fig. 4, is the scenario performed only in the morning. In the reversible lane case, one lane is added to Sathorn Nuea, while one lane is subtracted from Sathorn Tai. Two junctions that are controlled by traffic lights can be seen on Fig. 4, and they must be coordinated, with similar cycle time and proper offset.
Fig. 1. Sathorn-Surasak intersection.
[image:3.595.67.522.151.366.2] [image:3.595.67.525.397.609.2]Fig. 3. Wittayu intersection.
Fig. 4. Narinthorn intersection with reversible lane.
2.2. Data Analysis
[image:4.595.67.521.79.291.2] [image:4.595.66.523.320.537.2]Table 1. Sample data of volume at Surasak-Sathorn intersection.
Road 14.00 – 15.00 Vehicles per Hour 15.00 – 16.00
L S R L S R
Sathorn Nuea - 1770 - - 1181 -
Sathorn Tai 747 1723 - 175 1548 -
Surasak 299 694 1158 289 693 1615
Charoen Rat 1153 - 551 1101 - 470
2.3. Saturation Flow Rate
The saturation flow rate is the maximum number of vehicles per lane passing through an intersection on each direction per time period. Saturation flow rates are obtained by manually counting the number of vehicles from recorded videos from Sathorn Model for both morning peak and evening peak hours, to find the maximum value. Since the videos are available at only Sathorn-Surasak intersection, the detail investigation can be made there. For other major intersections on Sathorn road, appropriate average values from Sathorn-Surasak intersection were applied. Table 2 shows the results of the observation.
Table 2. Saturation flow rates for all intersections.
Intersection Maximum Number of Vehicles per Hour per Lane Left Straight Right
Sathorn-Surasak
Sathorn Nuea - 1692 -
Sathorn Tai 1000 1428 -
Surasak 1000 1212 1014
Charoen Rat 1038 - 1278
Narinthorn 1000 1444 1146
Wittayu 1000 1444 1146
2.4. Lost Time Adjustment
Lost time adjustment is the total time lost during period of green light for vehicles [9], where the raw data comes in a form of startup lost time. Startup lost time is needed because, in general, at the stop line there is a platoon of motorcycles blocking the route, as seen in Fig. 5. This scenario increases startup lost time [12]. Startup lost time is based upon site survey. Since Synchro only allows the limited value of startup lost time, the maximum value has been used in this research. The startup lost time is set to be 5.5 seconds in this work.
[image:5.595.72.533.103.196.2] [image:5.595.71.526.568.742.2]2.5. Implementing Traffic Light Control
Several Control strategies can be applied to traffic light control, including, for instance, pre-timed and actuated coordinated signalized intersection. All isolated intersections are assigned as pre-timed control in this work. Pre-timed signals allow the signal timing to be set equally for every cycle. Also, the duration of repeated cycle can be adjusted accordingly. On the other hand, the control type implemented on the reversible lane case is assigned as actuated coordinated signals, which allow 2 traffic lights to coordinate.
The traffic light phasing in this paper is prescribed identically to the police’s. Synchro provides several movements to select and create a combination of different phases. Among the patterns provided, the three control types: permitted, protected, and split are the choices that had been selected. Permitted phase allows left-turn movement too freely move without the restriction of red light but in the need to yield to oncoming traffic. Protected phase, on the other hand, each movement can only travel according to the arrow indication of signal. Lastly, split phase grants both right and straight traffic to share a single protected phase [9].
2.6. Performance Index
The optimal cycle lengths provided by Synchro are based on delay minimization and performance index. Synchro allows users to manually adjust the data for their own satisfaction, but the outcome display is usually the best cycle length. The best cycle length can be selected from the lowest performance index (PI) [8], [9]. The PI is calculated from
10
3600
D St
PI , (1)
where St indicates the number of vehicle stops, and D is a total delay in seconds. Total delay is computed by adding control delay and queue delay. The control delay equals queue delay plus acceleration and minus deceleration delay, while the queue delay measures the additional delay resulted from reduction of capacity of queue on short links. In other words, the total delay is the extra time experienced by each vehicle when compared to the time needed to travel when there is no other vehicles and no traffic light.
2.7. SUMO
The outputs from Synchro are applied to the microscopic simulator SUMO [6] for detailed analysis. To ensure the validity of the microscopic model, it has been calibrated to Sathorn traffic based on data from the field. Since the calibration process and the resultant parameters are extensive and not the focus of this paper, the entire model is available to be downloaded for reference [16].
3. Simulation Results
Outputs from Synchro appear in a form of summary reports with all the analysis data, and the optimal cycle lengths are the focus of this work. Cycle lengths for hourly periods are generated from the number of vehicles per hour, whereas the numbers of vehicles used in the 4-hour period cycle length are obtained by calculating arithmetic means of the number of vehicles from 4 hours.
Table 3 compares the cycle lengths as calculated by Synchro and average manual time from the actual operation of the 3 intersections considered in this work. ‘C’ and ‘P’ are shorten for ‘Calculated-by-Synchro’ and ‘Police-operation’, respectively. ‘Police-operation’ means the average actual times as manually operated by traffic police on site. ‘S’ and ‘R’ symbolize going straight and turning right, respectively. Tables 4 – 6 signify the comparison of green times given in each direction for each intersection. The names of the directions are based on the names of the roads that are given the green light.
Table 3. Cycle length comparison between Synchro calculation and Police operation.
Time Sathorn-Surasak Cycle Lengths (s) Narinthorn Wittayu
C P C P C P
14:00 – 15:00 310 286 185 208 285 220
15.00 - 16.00 240 235 205 201 305 198
16.00 – 17.00 340 274 225 193 245 195
17.00 – 18.00 260 323 225 191 325 197
18.00 – 19.00 280 315 225 185 205 198
19:00 – 20:00 200 302 265 178 185 206
15:00 – 19:00 300 289 205 193 285 202
Table 4. Green time per cycle comparison for Sathorn-Surasak intersection.
Time
Green Time per Cycle (s)
Surasak (S&R) Charoen Rat (Surasak (RR) ) & Sathorn Nuea (Sathorn Tai (SS) & )
C P C P C P
14:00 – 15:00 70 90 78 54 147 127
15.00 - 16.00 46 71 62 56 117 93
16.00 – 17.00 56 105 120 56 149 98
17.00 – 18.00 40 127 108 49 97 132
18.00 – 19.00 45 109 116 57 104 134
19:00 – 20:00 44 98 54 46 87 143
15:00 – 19:00 47 100 126 53 112 121
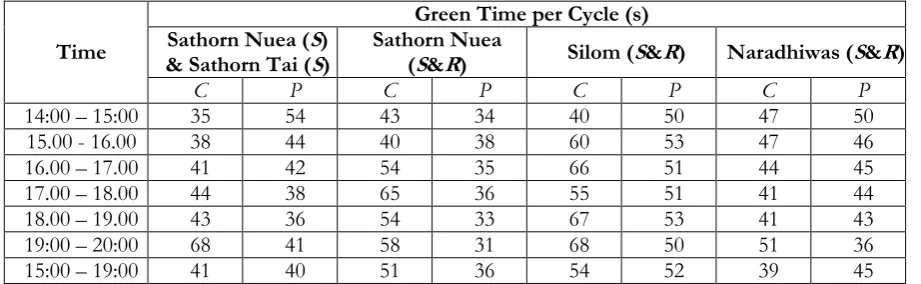
Table 5. Green time per cycle comparison for Narinthorn intersection.
Time
Green Time per Cycle (s) Sathorn Nuea (S)
& Sathorn Tai (S) Sathorn Nuea (S&R) Silom (S&R) Naradhiwas (S&R)
C P C P C P C P
14:00 – 15:00 35 54 43 34 40 50 47 50
15.00 - 16.00 38 44 40 38 60 53 47 46
16.00 – 17.00 41 42 54 35 66 51 44 45
17.00 – 18.00 44 38 65 36 55 51 41 44
18.00 – 19.00 43 36 54 33 67 53 41 43
19:00 – 20:00 68 41 58 31 68 50 51 36
15:00 – 19:00 41 40 51 36 54 52 39 45
Table 6. Green time per cycle comparison for Wittayu intersection.
Time
Green Time per Cycle (s) Sathorn Nuea
(S&R) Silom (S&R) RamaIV(Silom(R)& R) RamaIV (S&R) Wittayu (S&R)
C P C P C P C P C P
14:00 – 15:00 94 37 53 30 18 36 58 21 37 71
15.00 - 16.00 73 34 76 27 18 28 85 26 28 58
16.00 – 17.00 62 35 39 26 18 31 53 23 48 55
17.00 – 18.00 90 33 48 30 18 31 82 30 62 48
18.00 – 19.00 47 37 29 29 18 29 43 29 43 49
19:00 – 20:00 49 35 28 28 18 31 34 33 31 54
[image:7.595.76.522.104.234.2] [image:7.595.77.520.270.415.2] [image:7.595.70.531.449.591.2]Another result obtained from Synchro is the coordination of two traffic lights at Narinthorn intersection for possible reversible lane implementation during morning peak hours, as shown in Table 7. For simple coordination, cycle lengths of both traffic light are set to be equal. However, to allow traffic to flow continuously, offset time is also optimized. Offset is defined as the time difference of the beginning of the green times of the first signal phase of the two traffic lights. The results show the proper values of offset, which, while seem to be common, are hard to be controlled precisely by human. For instance, if not controlled properly, the excess traffic flow on the reversible lane may end up blocking the Sueksawittaya junction, causing more delay. This highlight the importance of equipment that can automatically coordinate for actual implementation. Hence, even though this result is intended as a preparation for actual implementation, it was found to be difficult and hazardous for manual control in the field. Thus, this scenario is not compared to the actual operation as the implementation was cancelled.
Table 7. Cycle lengths and offsets for the reversible lane scenario.
Time Cycle Length (s) Narinthorn & Sueksawittaya Offset (s)
6:00 – 7:00 170 18
7:00 – 8:00 180 16
8:00 – 9:00 230 38
4. Data Comparison via SUMO
The comparisons have been made to evaluate the travel times before and after optimization. For this purpose, optimal cycle lengths from Synchro are used as inputs so as to simulate in SUMO. The analyses of travel time are given for each hour during evening peak hour period. Moreover, average of 4-hour time interval that covers the evening peak hour period is also shown.
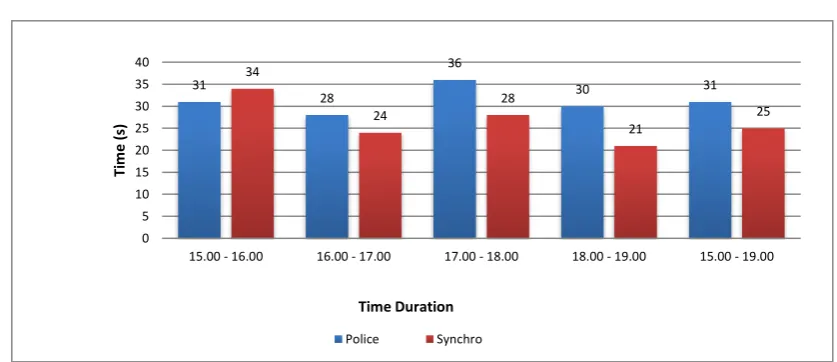
Figures 6 - 8 present average travel time the vehicles took for each intersection in hourly periods and in total. Average travel times for each intersection are obtained by calculating arithmetic means from 4 directions. ‘Synchro’ label specifies the travel time vehicles used when optimal cycle lengths from Synchro are adopted, while ‘Police’ refers to travel time vehicles take when actual green times that police operated are in action.
The improvements are clearly examined since for all three intersections the significant dropdown of travel time only occurs from 17:00 to 19:00. Periodic cycle length most likely assists the flow rate during rush hours. However, travel time after cycle length recalculation for Fig. 7 from 15:00 to 17:00 are a little higher than the original. This is due to the fact that the traffic volume during that time as applied to SUMO is varying every 15 minutes, reflecting the real fluctuation of the traffic. Therefore, the optimization of the average traffic volume with periodic cycle may not out-perform the manual adaptive control, especially during the off-peak time, where manual operation can adapt to short burst of demand. Nonetheless, the overall results can still be considered as progress.
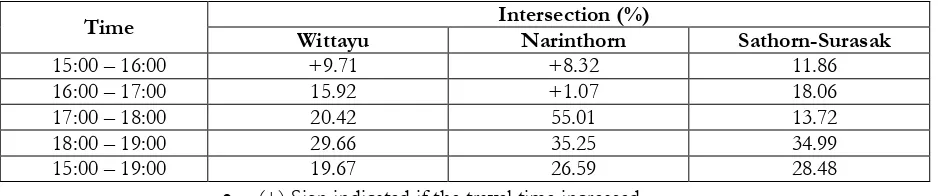
The reduction in travel time means the faster vehicles can travel. Table. 8 shows the percentage of travel time reduction after the change of the cycle length into value generated from Synchro. Noted that each intersection consists of four different directions. The data shown do not represent the improvement of travel time in each direction particularly.
Fig. 6. Average Travel Time Comparison for Sathorn-Surasak intersection.
Fig.7. Average Travel Time Comparison for Narinthorn intersection.
Fig. 8. Average Travel Time Comparison for Wittayu intersection
93 95
120
146
113
82 78
104 95 81 0 20 40 60 80 100 120 140 160
15.00 - 16.00 16.00 - 17.00 17.00 - 18.00 18.00 - 19.00 15.00 - 19.00
Ti m e (s ) Time Duration Police Synchro
152 164
210
104
157
165 165
94 68 115 0 50 100 150 200 250
15.00 - 16.00 16.00 - 17.00 17.00 - 18.00 18.00 - 19.00 15.00 - 19.00
Ti m e (s ) Time Duration Police Synchro 31 28 36
30 31
34 24 28 21 25 0 5 10 15 20 25 30 35 40
15.00 - 16.00 16.00 - 17.00 17.00 - 18.00 18.00 - 19.00 15.00 - 19.00
[image:9.595.82.502.102.277.2] [image:9.595.88.498.311.502.2] [image:9.595.80.499.528.709.2]Table 8. Travel time reduction after the change in cycle length.
Time Wittayu Intersection (%) Narinthorn Sathorn-Surasak
15:00 – 16:00 +9.71 +8.32 11.86
16:00 – 17:00 15.92 +1.07 18.06
17:00 – 18:00 20.42 55.01 13.72
18:00 – 19:00 29.66 35.25 34.99
15:00 – 19:00 19.67 26.59 28.48
(+) Sign indicated if the travel time increased
5. Conclusion
This paper provides the results for optimal signal timing in every intersection along Sathorn road and compares the travel time before and after using periodic cycle time. The travel time presented suggests that periodic signal timing control from Synchro is better during rush hours since the outcomes display that travel times decrease. Although the results show clearly the significant improvements in each intersection, still further enhancement can be conducted.
It is also important to point out that several inputs are varied during trials. While inconclusive, it is found that the changes in startup lost time, volume and saturation flow can affect the results. Future study should be directed at the sensitivity analysis of input parameters that would affect the data for optimal cycle lengths. In particular, the effect of motorcycles, which is prevalent in Bangkok, should be tackled. Finally, at the time of the study, traffic data are scarce and expensive as they are collected manually. Fortunately, there are ongoing proposals that would install more traffic sensors in Bangkok. Hence, traffic data will be more abundant and more insights can be obtained in the near future.
References
[1] W. Pattara-atikom, P. Pongpaibool, and S. Thajchayapong, “Estimating road traffic congestion using vehicle velocity,” in 2006 6th International Conference on ITS Telecommunications, Chengdu, China, 2006, pp. 1001 – 1004.
[2] Sustainable Mobility Project 2.0, SMP2.0 Sustainable Mobility Indicators, 2nd ed. WBCSD, 2016.
[3] Sustainable Mobility Project 2.0, Integrated Sustainable Mobility in Cities – A Practical Guide. WBCSD, 2016. [4] Traffic and Transportation Department, “Traffic Statistics 2015,” BMA, Bangkok, 2016.
[5] A. Y. Zakariya and S. I. Rabia, “Estimating the minimum delay optimal cycle length based on a time-dependent delay formula,” Alexandria Engineering Journal, vol. 55, no. 3, pp. 2509-2514, 2016.
[6] D. Krajzewicz, E. Brockfeld, J. Mikat, J. Ringel, C. Rössel, W. Tuchscheerer, P. Wagner, and R. Wösler, “Simulation of modern traffic lights control systems using the open source Traffic Simulation SUMO,” in The Industrial Simulation Conference 2005, Berlin, Germany, 2005.
[7] C. L. Lan and G. L. Chang, “A traffic signal optimization model for intersections experiencing heavy scooter-vehicles mixed traffic flows,” IEEE Transactions on Intelligent Transportation Systems, vol. 16, no. 4, pp. 1771 - 1783, November 2014.
[8] A. Stevanovic and P. T. Martin, ‘‘Split-cycle offset optimization technique and coordinated actuated traffic control evaluated through microsimulation,” Transportation Research Record Journal of the Transportation Research Board, no. 2080, pp. 48-55, Decemeber 2008.
[9] Trafficware LLC, Synchro Studio 9 User Guide. Sugar Land, TX, 2014.
[10] E. A. Stanciu, I. M. Moise, and L. M. Nemtoi, “Optimization of urban road traffic in intelligent transport systems,” in 2012 International Conference on Applied and Theoretical Electricity, Craiova, 2012, pp. 1-4.
[image:10.595.65.534.116.214.2][12] T. Rongviriyapanich and C. Suppattrakul, “Effects of motorcycles on traffic operations on arterial streets,” Journal of Eastern Asia Society for Transportation Studies, vol. 6, pp. 137-146, 2005.
[13] T. Nakatsuji, N. G. Hai, S. Taweesilp, and Y. Tanaboriboon, “Effect of motorcycle on capacity of signalized intersections,” Infrastructure Planning Review, vol. 18, pp. 935-942, 2001.
[14] C. A. Adams, M. A. Mushim, and R. Opoku, “Effects of motorcycles on saturation flow rates of mixed traffic at signalized intersections in Ghana,” International Journal of Traffic and Transportation Engineering, vol. 4, no. 3, pp. 94-101, Apr. 2015.
[15] M. Maciejewski, “A comparison of microscopic traffic flow simulation systems for an urban area,” Transport Problems, vol. 5, pp. 27-38, Jan. 2010.