Joseph Durkan
David Duffy
Cormac O’Sullivan
Summer 2011
THE ESRI
The Economic Research Institute was founded in Dublin in 1960, with the assistance of a grant from the Ford Foundation of New York. In 1966 the remit of the Institute was expanded to include social research, resulting in the Institute being renamed The Economic and Social Research Institute (ESRI). In 2010 the Institute entered into a strategic research alliance with Trinity College Dublin, while retaining its status as an independent research institute.
The ESRI is governed by an independent Council which acts as the board of the Institute with responsibility for guaranteeing its independence and integrity. The Institute’s research strategy is determined by the Council in association with the Director and staff. The research agenda seeks to contribute to three overarching and interconnected goals, namely, economic growth, social progress and environmental sustainability. The Institute’s research is disseminated through international and national peer reviewed journals and books, in reports and books published directly by the Institute itself and in the Institute’s working paper series. Researchers are responsible for the accuracy of their research. All ESRI books and reports are peer reviewed and these publications and the ESRI’s working papers can be downloaded from the ESRI website at www.esri.ie
The Institute’s research is funded from a variety of sources including: an annual grant-in-aid from the Irish Government; competitive research grants (both Irish and international); support for agreed programmes from government departments/agencies and commissioned research projects from public sector bodies. Sponsorship of the Institute’s activities by Irish business and membership subscriptions provide a minor source of additional income.
Quarterly Economic
Commentary
The Quarterly Economic Commentary
analyses current economic trends and provides macro-economic forecasts for the current and following year. It assesses international economic prospects and provides short-term forecasts in the framework of a consistent set of national accounts for Ireland. Its wide range of users includes government departments, policy-makers, social partners, international organisations, academics and the national and international financial sectors.
Research Bulletin
The Research Bulletin provides short summaries of work published by ESRI staff and overviews of thematic areas covered by ESRI programmes of research. Bulletin articles are designed to be easily accessible to a wide readership. A reference or references to the full publication is included at the end of each Bulletin article.
An archive of bulletin articles will be found at www.esri.ie/bulletin
Quarterly Economic
Commentary
Joseph Durkan
David Duffy
Cormac O’Sullivan
Summer 2011
The forecasts in this Commentary are based on data available by
late-August 2011. Draft completed 29
thAugust 2011.
Research Bulletin
11/2
Editor:
Tim Callan
Authors
Joseph Durkan is an Associate Research Professor and Editor of the Commentary, David Duffy is a Research Officer and Cormac O’Sullivan is a Research Assistant at the Economic and Social Research Institute (ESRI).
This Commentary has been accepted for publication by the Institute, following an internal peer review process. The authors are solely responsible for the content and the views expressed.
Table of Contents
Page
QUARTERLY ECONOMIC COMMENTARY
Joseph Durkan, David Duffy and Cormac O’Sullivan
SUMMARY TABLE iv
SUMMARY 1
1. INTRODUCTION 6
2. EXPORTS OF GOODS AND SERVICES 10
3. INVESTMENT 14
4. HOUSEHOLD CONSUMPTION 17
5. PUBLIC FINANCES 20
6. POPULATION,EMPLOYMENT,UNEMPLOYMENT AND EARNINGS 26
7. IMPORTS AND THE BALANCE OF PAYMENTS 36
8. OVERALL OUTPUT 39
9. BANKING CRISIS AND THE REAL ECONOMY 40
10. GENERAL ASSESSMENT 44
RESEARCH BULLETIN 11/2
49The Macro-economic Impact of Changing the Rate of Corporation Tax
Thomas Conefrey and John FitzGerald 51
The Banking Sector and Recovery in the EU Economy
Ray Barrell, Tatiana Fic, John FitzGerald, Ali Orazgani and Rachel Whitworth 53
Should We Be Worried About Income Inequality in Ireland?
Richard Layte 56
Investing in Child Health and Development: The Impact of Breastfeeding on Children’s School Performance
Summary Table
2009 2010 2011(f) 2012(f)
OUTPUT
(Real Annual Growth %)
Private Consumer Expenditure -6.9 -0.8 -1.3 0.0
Public Net Current Expenditure -4.5 -3.8 -3.3 -4.0
Investment -28.7 -24.9 -6.7 -2.8
Exports -4.2 6.3 7.0 7.4
Imports -9.3 2.7 4.9 5.8
Gross Domestic Product (GDP) -7.0 -0.4 1.8 2.3
Gross National Product (GNP) -9.8 0.3 0.2 0.7
PRICES
(Annual Growth %)
Harmonised Index of Consumer Prices (HICP) -1.7 -1.6 1.3 1.0
Consumer Price Index (CPI) -4.5 -1.0 3.0 1.0
Wage Growth -0.8 -2.9 0.0 1.0
LABOUR MARKET
Employment Levels (ILO basis (000s)) 1,929 1,848 1,803 1,815
Unemployment Levels (ILO basis (000s)) 259 292 300 310
Unemployment Rate (as % of Labour Force) 11.8 13.6 14.3 14.5
PUBLIC FINANCE
Exchequer Balance (€m) -24.6 -18.7 -17.3 -14.5
General Government Balance (€m) -23.0 -49.9 -22.4 -11.4
General Government Balance (% of GDP) -14.3 -32.0 -14.2 -7.1
Excluding once off bank bailout monies -11.8 -11.5 -9.3 -7.1
1
Summary
The international economy is in a period of great uncertainty. On both sides of the Atlantic, governments are faced with difficult choices regarding levels of debt. In the United States, this has led to the first ever downgrading of sovereign debt by a major ratings agency. In Europe, governments have agreed major changes to the mechanism for bailing out troubled eurozone countries, although financial markets are not convinced that this is enough. While this agreement has brought about improved terms for Ireland’s bailout, and thus made the road to fiscal sustainability easier, the issue of burden sharing remains to be addressed. At present the cost of the restructuring of the covered banking system has primarily been borne by Ireland, even though the benefits of this restructuring are shared throughout the eurozone.
Activity in the domestic economy is expected to remain depressed this year, with GNP growing by 0.2 per cent and GDP growing by 1.8 per cent. Growth may pick up in 2012, with GNP growing by 0.7 per cent and GDP by 2.3 per cent. The stimulus for growth is coming from the export sector as domestic producers seek to replace lost domestic demand with new business from abroad, while the multinational sector continues to perform well on global markets. Despite the difficulties being faced in the international economy, we predict that exports from indigenous firms will increase 7.5 per cent in volume terms, both this year and next. There is also an expansion of capacity underway in both the multinational manufacturing and services exports sectors. Overall, we expect the volume of exports of goods and services to increase by 7.0 per cent in 2011 and 7.4 per cent in 2012.
Forecasts of domestic demand have been scaled back in this Commentary as a result of a deterioration in the factors determining household consumption. The household savings rate remains elevated in the face of great uncertainty – uncertainty about the future global and domestic economic climate and about the impact of future domestic budgets. Our forecast inflation rate is now 1.3 per cent and consequently, we expect consumption to fall by 1.3 per cent this year, but may remain constant in 2012.
2
investment, which is unlikely to be replaced by any big-ticket infrastructure projects in the near future. In contrast, investment in manufacturing and agriculture is expected to expand this year following several years of decline. Overall, investment is expected to fall by 6.7 per cent this year, and 2.8 per cent in 2012.
Unemployment is expected to remain high. The collapse in output in the construction sector has created a major structural unemployment problem. The full scale of this problem is difficult to gauge as a significant number of workers in this sector were from overseas, and the extent to which these migrants have since left the country. Current trends in employment and unemployment are not encouraging. We expect unemployment will average 14.3 per cent this year, and could be even higher next year unless there is significant outward migration.
In addition to the cost of restructuring the banking system, the public finances have suffered due to the deterioration of taxation revenue following the collapse of the bubble. Expenditure has yet to reduce to match this new reality. Reducing the consequent large deficit has proven difficult, and has necessitated spending cuts, increased service charges, public sector pay cuts, and tax increases. The danger is that some good programmes will be cut because this is less challenging than cutting others that yield less benefit.
3
NATIONAL ACCOUNTS 2010 (Estimate)
A: Expenditure on Gross National Product
2009 2010 Change in 2010 Estimate Estimate %
€bn €bn Value Price Volume
Private Consumer Expenditure 85.2 82.6 -3.1 -2.3 -0.8
Public Net Current Expenditure 28.5 26.2 -8.0 -4.3 -3.8
Gross Fixed Capital Formation 25.3 18.1 -28.5 -4.8 -24.9
Exports of Goods and Services (X) 145.9 157.7 8.1 1.7 6.3
Physical Changes in Stocks -2.3 -0.9 - - -
Final Demand 282.6 283.7 0.4 -0.5 0.9
less:
Imports of Goods and Services (M) 121.0 127.9 5.7 2.9 2.7
Statistical Discrepancy 1.0 -0.2 - - -
GDP at Market Prices 160.6 156.0 -2.9 -2.4 -0.4
less:
Net Factor Payments (F) 28.4 27.8 - - -
GNP at Market Prices 132.2 128.2 -3.0 -3.3 0.3
B: Gross National Product by Origin
2009 2010 Change in 2010 Estimate Estimate
€bn €bn €bn %
Agriculture, Forestry, Fishing 2.2 2.7 0.5 24.9
Non-Agricultural: Wages, etc. 73.6 68.8 -4.9 -6.6
Other: 49.5 53.2 3.7 7.5
Adjustments: Stock Appreciation 1.0 -0.3 - -
Statistical Discrepancy 1.0 -0.2 - -
Net Domestic Product 127.3 124.2 -3.2 -2.5
less:
Net Factor Payments 28.4 27.8 0.6 -
National Income 99.0 96.4 -2.6 -2.6
Depreciation 17.3 16.1 -1.2 -
GNP at Factor Cost 116.2 112.4 -3.8 -3.3
Taxes less Subsidies 16.0 15.8 -0.2 -
GNP at Market Prices 132.2 128.2 -4.0 -3.0
C: Balance of Payments on Current Account
2009 2010 Change in 2010 Estimate Estimate
€bn €bn €bn
Exports (X) less Imports (M) 24.9 29.8 +4.9
Net Factor Payments (F) -28.4 -27.8 -0.6
Net Transfers -1.2 -1.2 0.0
Balance on Current Account -4.7 0.8 +5.5
4
FORECAST NATIONAL ACCOUNTS 2011
A: Expenditure on Gross National Product
2010 2011 Change in 2011 Estimate Estimate %
€bn €bn Value Price Volume
Private Consumer Expenditure 82.6 82.5 -0.1 1.3 -1.3
Public Net Current Expenditure 26.2 25.4 -3.0 0.3 -3.3
Gross Fixed Capital Formation 18.1 16.7 -7.8 -1.1 -6.7
Exports of Goods and Services (X) 157.7 168.8 7.0 0.0 7.0
Physical Changes in Stocks -0.9 -0.5 - - -
Final Demand 283.7 292.9 3.2 0.4 2.8
less:
Imports of Goods and Services (M) 127.9 135.9 6.2 1.3 4.9
Statistical Discrepancy -0.2 -0.1 - - -
GDP at Market Prices 156.0 157.2 0.7 -1.1 1.8
less:
Net Factor Payments (F) 27.8 30.4 - - -
GNP at Market Prices 128.2 126.7 -1.1 -1.3 0.2
B: Gross National Product by Origin
2010 2011 Change in 2011 Estimate Forecast
€bn €bn €bn %
Agriculture, Forestry, Fishing 2.7 3.0 0.3 9.8
Non-Agricultural: Wages, etc. 68.8 67.4 -1.4 -2.0
Other: 53.2 55.8 2.6 4.9
Adjustments: Stock Appreciation -0.3 -0.3 - -
Statistical Discrepancy -0.2 -0.1 - -
Net Domestic Product 124.2 125.8 1.6 1.3
less:
Net Factor Payments 27.8 30.4 2.6 -
National Income 96.4 95.4 -1.0 -1.0
Depreciation 16.1 15.0 -1.0 -
GNP at Factor Cost 112.4 110.4 -2.1 -1.8
Taxes less Subsidies 15.8 16.4 0.6 -
GNP at Market Prices 128.2 126.7 -1.5 -1.1
C: Balance of Payments on Current Account
2010 2011 Change in 2011 Estimate Forecast
€bn €bn €bn
Exports (X) less Imports (M) 29.8 32.9 3.1
Net Factor Payments (F) -27.8 -30.4 -2.6
Net Transfers -1.2 -1.0 0.2
Balance on Current Account 0.8 1.5 0.7
5
FORECAST NATIONAL ACCOUNTS 2012
A: Expenditure on Gross National Product
2011 2012 Change in 2012 Estimate Estimate %
€bn €bn Value Price Volume
Private Consumer Expenditure 82.5 83.4 1.0 1.0 0.0
Public Net Current Expenditure 25.4 24.4 -4.0 0.0 -4.0
Gross Fixed Capital Formation 16.7 16.2 -2.6 0.2 -2.8
Exports of Goods and Services (X) 168.8 182.4 8.1 0.6 7.4
Physical Changes in Stocks -0.5 0.0 - - -
Final Demand 292.9 306.5 4.6 0.7 3.9
less:
Imports of Goods and Services (M) 135.9 145.5 7.1 1.2 5.8
Statistical Discrepancy -0.1 -0.1 - - -
GDP at Market Prices 157.2 161.1 2.5 0.2 2.3
less:
Net Factor Payments (F) 30.4 33.4 - - -
GNP at Market Prices 126.7 127.6 0.7 0.0 0.7
B: Gross National Product by Origin
2011 2012 Change in 2012 Estimate Forecast
€bn €bn €bn %
Agriculture, Forestry, Fishing 3.0 3.3 0.3 10
Non-Agricultural: Wages, etc. 67.4 68.5 1.1 1.6
Other: 55.8 58.2 2.4 4.3
Adjustments: Stock Appreciation -0.3 -0.3 - -
Statistical Discrepancy -0.1 -0.1 - -
Net Domestic Product 125.8 129.5 3.8 3.0
less:
Net Factor Payments 30.4 33.4 -3.0 -
National Income 95.4 96.1 0.7 0.8
Depreciation 15.0 14.1 -1.0 -
GNP at Factor Cost 110.4 110.2 -0.2 -0.2
Taxes less Subsidies 16.4 17.5 1.1 -
GNP at Market Prices 126.7 127.6 0.9 0.7
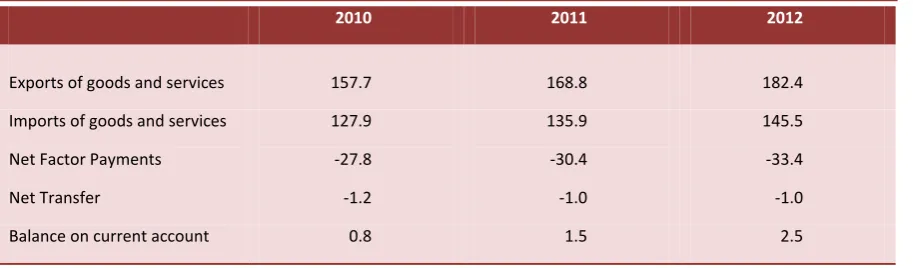
C: Balance of Payments on Current Account
2011 2012 Change in 2012 Estimate Forecast
€bn €bn €bn
Exports (X) less Imports (M) 32.9 36.9 4.0
Net Factor Payments (F) -30.4 -33.4 -3.0
Net Transfers -1.0 -1.0 0.0
Balance on Current Account 1.5 2.5 1.0
6
1. Introduction
D
OMESTICI
MBALANCESIn the Spring Quarterly Economic Commentary, we described an economy in transition from one that was over-reliant on the domestic construction industry, to an economy that is orientated towards export demand. This transition is still underway, but a return to growth led by external demand is being frustrated by a global slowdown and several domestic imbalances; the structural unemployment problem created by the collapse of the construction industry, mounting public debt created by bubble-era expenditure and recession-era tax revenue, the ongoing restructuring of the troubled banking system, and the deleveraging of private sector debt. Taken together these factors will keep economic growth well below potential over the forecast horizon.
INTERNATIONAL CONTEXT
As well as the very difficult domestic situation, the international situation we now find ourselves in is increasingly challenging. The recent downgrading of US debt, the concerns about Italy’s and Spain’s level of debt, and the lack of clarity about the details of the revised terms of the bailout agreement covering Greece, Ireland and Portugal, have caused major turmoil in financial markets and increased the uncertainty that faces consumers, producers and governments. The financial turmoil requires a speedy and coherent solution, not just determined by governments but informed by market participants. If this does not happen, the uncertainty could easily spill over into corporate and household decision making – already in a fragile state – and cause developed economies to tip back into negative growth.
7
The change in the conditions facing Ireland arising from the 21st July Statement by the Heads of State/Government in the eurozone on interest rates and lengthening the maturity of the bailout loans is a step in the right direction. The effect of the reduction in interest rates is to save approximately €1 billion per year when the loans are fully taken up, though somewhat less initially. This eases the adjustment of the public finances and should permit a return to a balanced budget earlier than might otherwise have occurred. The lengthening of the maturity increases the flexibility of government when facing the rollover of debt. If government is in a position to return to financial markets at more favourable rates then the bailout loans can be repaid earlier. There remain important elements of the new agreement that are yet to be finalised, but the general shape is clear.
The revised agreement allows for the possibility of debt buy-backs by the EFSF and the European Stability Mechanism (ESM) in secondary markets, depending on economic circumstances. This creates the possibility of debt reduction but the very existence of this facility, which effectively improves the liquidity of government debt, may limit the extent of buy-backs and bring market rates closer to bailout rates. This facility is likely to be important in circumstances where a renewal of uncertainty in financial markets leads to yields on government paper rising again to the very high levels reached from early July to the time of the new agreement.
The final element in the revised agreement that is of benefit to Ireland derives from the statement that “We are determined to continue to provide support to countries under programmes until they have regained market access, provided they successfully implement these programmes”. The significance of this is that the debt rollover of €12 billion due in early 2014 can be successfully financed, either by market access or by funding through the EFSF/ESM. In the Spring
Quarterly Economic Commentary we expressed concern about the scale of the rollover while the country was still running a very large budget deficit and while there was some doubt about private sector debt reductions whether voluntary or not. These two factors suggested that a return to financial markets to finance the deficit and rollover was unlikely. Hence, at that time, we were in favour of a reduced timetable for deficit reduction. This new agreement has fundamentally changed our view about the necessary speed of adjustment. The lower interest rates allow a smaller budget deficit than the target 3 per cent by 2015. It has been argued1 that Ireland should move more rapidly on fiscal adjustment in order
1
8
to establish in the minds of market participants that the debt is sustainable and that consequently there will be no burden sharing with private holders of sovereign debt. It is hoped that this will allow earlier access to financial markets. This argument has much to recommend it and we believe that the deficit target could be reduced to 1.5 per cent by 2015. If, by 2015, regaining market access is difficult for whatever reason, then going above and beyond the bailout terms strengthens the case for support as quoted above.
While the agreement was much more favourable than many had expected, there are still unresolved issues in relation to burden sharing, the overall level of indebtedness of member countries in the eurozone, and the evolution of the European Central Bank (ECB) in to a more classic central bank, albeit without a central government backstop. Taking the first of these issues, there are very significant differences between the causes of the financial crisis in different countries. In the case of Ireland a significant element of the level of debt and the amount borrowed year-by-year is a direct consequence of the banking collapse and inappropriate fiscal policy during the boom when policy should have been contractionary, whereas for other indebted nations it is primarily a reflection of fiscal mismanagement, with the emergence of permanent deficits. There are potential spillover effects to other countries in the monetary union of the financial crisis in Ireland and these argue for an approach that recognises this. At present the cost of the restructuring of the banking system has been reflected in increased indebtedness by the State, even as the benefits of this restructuring are more widely shared throughout the eurozone. In a monetary union with the necessary fiscal authorities, burden sharing would be the norm, recognising the interdependence between the different elements of the monetary union. The eurozone lacks this central fiscal authority so that the efforts to resolve this unprecedented crisis are fragmented. Over time we may move to an approach that involves burden sharing at the eurozone level and this would ease the burden on Ireland.
9
Finally, and this is a point we noted in the Spring Quarterly Economic Commentary, the ECB needs to be much more active in primary and secondary markets for government debt. Some initial steps have been taken in this direction, but the policy shift needs a strategic underpinning, rather than a grudging acceptance of an unwanted role. Otherwise the financial instability in the eurozone will continue. This is a major and unprecedented crisis that requires radical thinking to find a solution. A set of piecemeal actions that seem to maintain the status quo is not a sustainable option.
10
2. Exports of Goods and
Services
EXPORTS OF GOODS AND SERVICES IN 2011 AND 2012
11
economies back into recession. This suggests a degree of caution in forecasting exports by traditional firms, but a volume increase of 7.5 per cent this year and next still looks realistic.
The composition of modern sector exports, with the heavy emphasis on chemicals and pharmaceuticals, suggests that supply capacity is critical in determining exports from the modern sector. The additions to capacity over the past years are expected to lead to further increases in output and sales this year and next. There is a very high degree of concentration in this sector, with one firm alone accounting for one-tenth of total merchandise exports. The critical issues are the extent to which investment continues and firms adapt to products going out of patent and the scale of mergers and acquisitions currently underway. Given that the sector in Ireland is still primarily production rather than research based and much of the economies sought from mergers and acquisitions to date have been driven by a desire to reduce research costs, as well as overheads and to improve research outcomes, the production side located in Ireland has mostly not been negatively impacted. The effect of the expiry of patents is more difficult to foresee. There will certainly be reductions in the value of output and perhaps in the level of output, but firms with products coming out of patent have adopted strategies that compete at all levels of the generic market to ensure that there is not a complete loss of markets. They have also continued to develop new products, and this has resulted in increased investment in the sector in Ireland. The greatest threat to pharmaceutical exports is likely to come from changes to reimbursement methods for healthcare expenditure in some countries struggling with fiscal deficits. On balance we think modern sector exports will continue to grow this year.
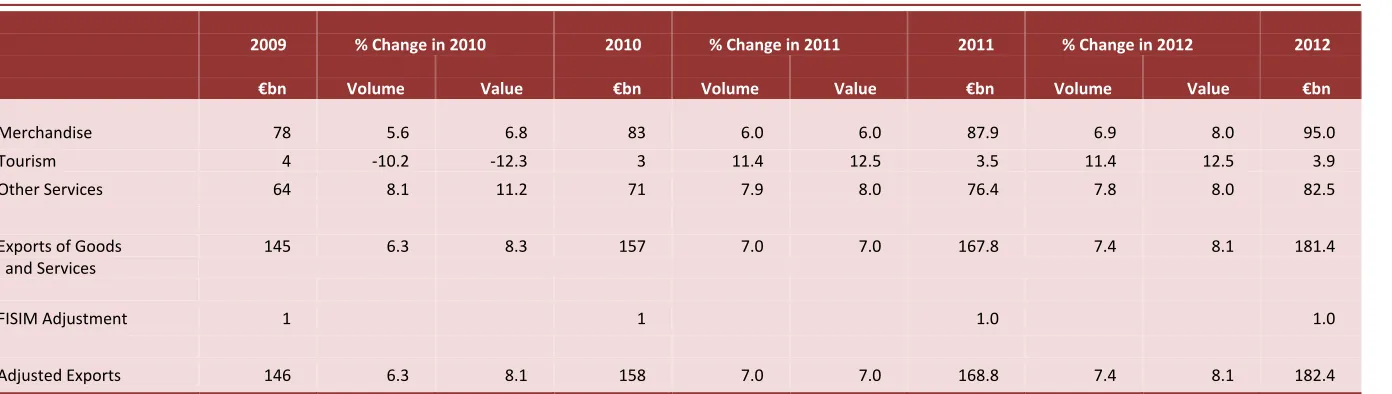
Overall merchandise exports could grow in value terms by 6 per cent.
Exports of services are now of equal importance to the export sector as merchandise exports. There is a much higher degree of concentration in this sector than in merchandise exports, with the top 10 companies accounting for just under 50 per cent of exports of services (excluding tourism). During 2011 there have been announcements of additions to existing firms and some new firms have established here. We expect continued growth in output from this sector of about 8 per cent this year and slightly less in 2012.
12
Table 1 : Exports of Goods and Services
2009 % Change in 2010 2010 % Change in 2011 2011 % Change in 2012 2012 €bn Volume Value €bn Volume Value €bn Volume Value €bn
Merchandise 78 5.6 6.8 83 6.0 6.0 87.9 6.9 8.0 95.0
Tourism 4 -10.2 -12.3 3 11.4 12.5 3.5 11.4 12.5 3.9
Other Services 64 8.1 11.2 71 7.9 8.0 76.4 7.8 8.0 82.5
Exports of Goods and Services
145 6.3 8.3 157 7.0 7.0 167.8 7.4 8.1 181.4
FISIM Adjustment 1 1 1.0 1.0
14
3. Investment
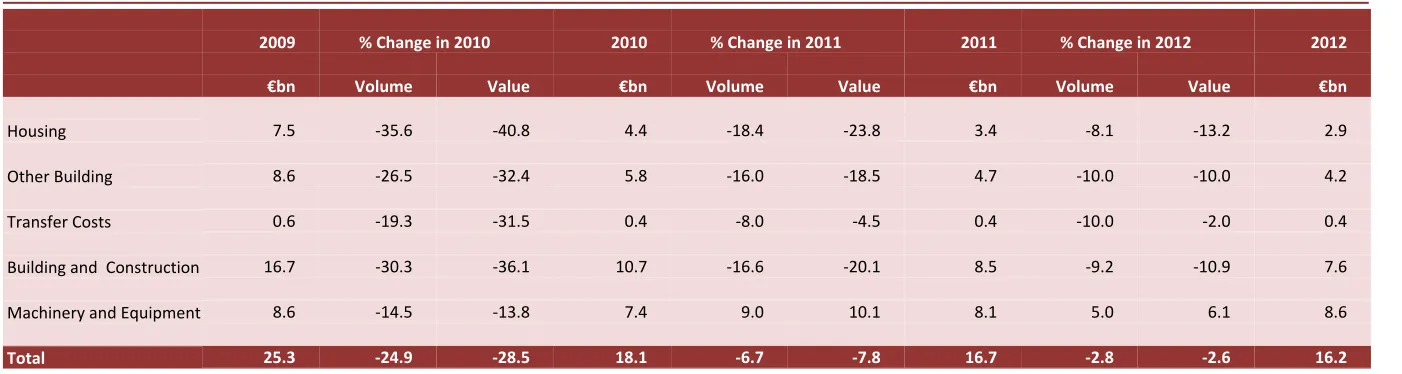
Total Investment fell by 24.9 per cent in volume terms in 2010.2 Building and construction declined by over 30 per cent while machinery and equipment and other elements of investment fell by 14.5 per cent. Within the building and construction sector, housing fell by 35.4 per cent in volume terms, civil engineering works (roads) by 27.1 per cent and the remainder by 25.7 per cent. Expenditure on transport equipment fell by 15.4 per cent, while expenditure on other machinery and equipment fell by 19.6 per cent. Overall, investment in 2010 was 52 per cent below its peak level in 2007, and is now back at pre-1997 levels.
The fundamental factors behind the decline in investment in recent years are still in place. Following the exuberance of the bubble era, there remains an excess supply of housing, office space and commercial space. The major road-building programme of the last decade is more or less complete, though there remain some serious bottlenecks that could usefully be cleared. First quarter figures show a further decline into 2011 in all the main categories of building and construction on a quarter to quarter and annual basis. Production in the civil engineering sector fell by 31.5 per cent in the first quarter and in the absence of new starts is likely to experience a 35-40 per cent fall this year, and by about 20 per cent in 2012. Housing output fell again in the first quarter of the year and was running at just under 10 per cent of the peak level reached in 2006. There may be some slight recovery during the year as National Asset Management Agency (NAMA) is providing funds for the completion of some estates. NAMA has also attempted to kick-start the housing market by providing a floor on potential negative equity for purchasers of property it holds. This latter will reduce some element of the uncertainty that potential purchasers now face, but there are other considerable sources of uncertainty facing purchasers and society in general. There are also very many unsold second-hand houses, so that it is not certain that the NAMA approach will ease the market. There will continue to be some production of one-off housing and housing in some parts of the major cities, though prices will be considerably reduced. We expect a 18 per cent decline this year in the volume of housing output and a further 8 per cent decline in 2012.
2
15
Other building output fell again in the first quarter of 2011, by 7.2 per cent compared with the final quarter of 2010. There still remains a surplus of office and commercial property, with many buildings empty. Existing shopping centres have empty units, as firms have closed since the onset of the downturn and retail sales in value and volume terms are 20-25 per cent below the previous peak. In this environment, significant investment is unlikely to be needed for some years. There may be some increased activity in small-scale projects, such as minor works in older schools to accommodate increased pupil numbers and some energy-saving expenditure by households.
Imports of producer capital goods rose by 22.2 per cent in the first four months compared with 2010. Registrations of new goods vehicles increased by 3 per cent in the first half of the year, though registrations of second-hand goods vehicles fell. The increase in imports of capital goods, along with the increase investment in machinery and equipment as seen in the latest QNA, are evidence of what we had expected: in manufacturing, expansion of existing facilities was underway, process development was continuing and new firms were beginning to invest. Announcements of planned investment by multinationals to date by the IDA indicate that there will be continued strong investment by overseas firms. Consequently, we expect machinery and equipment imports to rise again in 2012.
We also expect investment in agriculture to strengthen this year and to increase more rapidly in 2012. Registrations of tractors, both new and second-hand, rose by 27.5 per cent and 17 per cent in the first half of the year. Farmers’ incomes fell by 40 per cent between 2007 and 2009 and this was followed by investment falling dramatically in 2009 and 2010. The recovery in incomes in 2010 and the continuation of this into this year and next, together with an expected increase in milk output due to improvements in competitiveness in the Irish dairy sector, when milk quotas are abolished in 2015, suggest that agricultural investment will recover.3 The precise CAP arrangements that will emerge in the future are still unclear but it is difficult to see why the natural advantage enjoyed in Ireland from grass-based production should be restricted, as it was when the quota system was introduced.
Overall, investment is expected to fall by 6.7 per cent this year, and 2.8 per cent in 2012.
3
Table 2 : Gross Fixed Capital Formation
2009 % Change in 2010 2010 % Change in 2011 2011 % Change in 2012 2012 €bn Volume Value €bn Volume Value €bn Volume Value €bn
Housing 7.5 -35.6 -40.8 4.4 -18.4 -23.8 3.4 -8.1 -13.2 2.9
Other Building 8.6 -26.5 -32.4 5.8 -16.0 -18.5 4.7 -10.0 -10.0 4.2
Transfer Costs 0.6 -19.3 -31.5 0.4 -8.0 -4.5 0.4 -10.0 -2.0 0.4
Building and Construction 16.7 -30.3 -36.1 10.7 -16.6 -20.1 8.5 -9.2 -10.9 7.6
Machinery and Equipment 8.6 -14.5 -13.8 7.4 9.0 10.1 8.1 5.0 6.1 8.6
17
4. Household Consumption
There have been some revisions to the National Accounts for earlier years and these revisions have changed our view about the extent to which the fall in domestic demand was exacerbated by a rise in the personal savings rate. The estimated savings rate for 2008 and 2009 are now 6.9 per cent and 10.5 per cent of disposable income, compared with previous Central Statistics Office (CSO) estimates of 5.2 per cent and 12.3 per cent.4 There was an increase in the savings rate in 2009 but this increase was significantly less than we had thought. There is no figure estimated on a comparable basis for 2010 though using data from Institutional Sector accounts which estimates the savings rate at 12.2 per cent it is possible to estimate the level of household savings at almost €11.5 billion in 2010. Accumulated savings over the period 2006-2010 are now estimated at €31.5 billion compared with an earlier estimate of €37.8 billion. The build up of assets by the household sector was thus somewhat less than we had expected.
A new quarterly series of Institutional Sector Accounts indicates that the savings rate in the first quarter of this year has increased again by as much as 1.6 percentage points, though these data are provisional. First quarter National Accounts data indicate that household expenditure fell again, declining by the largest amount experienced for two years, with the savings rate, again measured by the Institutional Sector Accounts, increasing to 12.9 per cent of disposable income. We had expected that the personal savings rate would fall this year and that this would maintain household spending at the level reached in 2010, though the time path was expected to be uneven. Household spending in 2010 remained relatively constant throughout the year, at €21,183 million, €21,182 million, €21,188 million and €21,000 million for the four quarters, with the final quarter consumption adversely affected by the weather conditions at the time. We had expected some pick-up from those somewhat depressed levels in the first quarter of 2011 but this did not happen. The further decline in the first quarter put consumption 2.1 per cent below the level of the first quarter of 2010. This was especially disappointing given the extreme weather conditions experienced in the first part of 2010. The retail sales index, the main indicator of consumption, fell by 2 per cent quarter-on-quarter in the first quarter and while in the second quarter the retail sales index rose by 1.8 per cent it is difficult to see, even if retail sales continue to grow under the impact of increased tourist numbers – both people coming from abroad and an increasing number of Irish people holidaying
4
18
at home – how household spending can remain relatively constant as we had previously forecast.
As indicated above it now seems that the savings rate has remained high as households continue to build up savings levels. It remains the case that if household savings continue to increase it will be very difficult for domestic demand to increase as personal disposable income looks set to fall by 1.3 per cent this year, and unemployment and emigration are expected to continue.
The first half of the year was characterised by a very high degree of uncertainty in relation to the public finances, and while the bailout and government’s liquid assets guaranteed funding for government to end-2013, there were fears expressed about the possibility of default. While the end-July agreement has eased these fears the uncertainty led to significant outflows from the banking system. Furthermore, the situation has not been helped by the added uncertainty in relation to the tax increases and expenditure reductions due in the next budget. Since the downturn, households have faced a very high degree of uncertainty in relation to employment, income, wealth and taxation. Protecting themselves against adverse outcomes is a significant motivator of household behaviour.
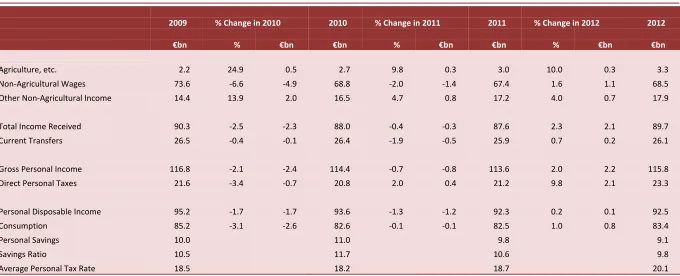
Table 3 : Personal Disposable Income
2009 % Change in 2010 2010 % Change in 2011 2011 % Change in 2012 2012
€bn % €bn €bn % €bn €bn % €bn €bn
Agriculture, etc. 2.2 24.9 0.5 2.7 9.8 0.3 3.0 10.0 0.3 3.3
Non-Agricultural Wages 73.6 -6.6 -4.9 68.8 -2.0 -1.4 67.4 1.6 1.1 68.5
Other Non-Agricultural Income 14.4 13.9 2.0 16.5 4.7 0.8 17.2 4.0 0.7 17.9
Total Income Received 90.3 -2.5 -2.3 88.0 -0.4 -0.3 87.6 2.3 2.1 89.7
Current Transfers 26.5 -0.4 -0.1 26.4 -1.9 -0.5 25.9 0.7 0.2 26.1
Gross Personal Income 116.8 -2.1 -2.4 114.4 -0.7 -0.8 113.6 2.0 2.2 115.8
Direct Personal Taxes 21.6 -3.4 -0.7 20.8 2.0 0.4 21.2 9.8 2.1 23.3
Personal Disposable Income 95.2 -1.7 -1.7 93.6 -1.3 -1.2 92.3 0.2 0.1 92.5
Consumption 85.2 -3.1 -2.6 82.6 -0.1 -0.1 82.5 1.0 0.8 83.4
Personal Savings 10.0 11.0 9.8 9.1
Savings Ratio 10.5 11.7 10.6 9.8
20
5. Public Finances
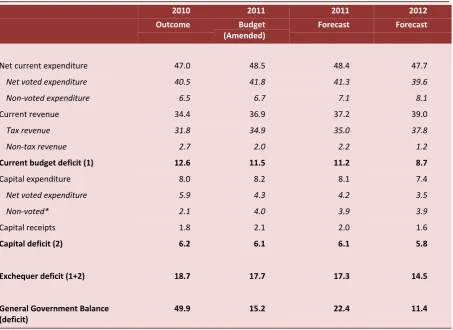
Table 4(a) and 4(b) set out the budget figures for 2011, amended slightly by later figures with the end year returns, the figures taken from the Revised Estimates of Public Expenditure and Ireland – Stability Programme Update, April 2011 (Department of Finance), our forecast of the likely outturn for the year are based on trends during the year to date, and our forecast for 2012.
Table 4(a): Exchequer Finances € billion
2010 Outcome
2011 Budget (Amended)
2011 Forecast
2012 Forecast
Net current expenditure 47.0 48.5 48.4 47.7
Net voted expenditure 40.5 41.8 41.3 39.6
Non-voted expenditure 6.5 6.7 7.1 8.1
Current revenue 34.4 36.9 37.2 39.0
Tax revenue 31.8 34.9 35.0 37.8
Non-tax revenue 2.7 2.0 2.2 1.2
Current budget deficit (1) 12.6 11.5 11.2 8.7
Capital expenditure 8.0 8.2 8.1 7.4
Net voted expenditure 5.9 4.3 4.2 3.5
Non-voted* 2.1 4.0 3.9 3.9
Capital receipts 1.8 2.1 2.0 1.6
Capital deficit (2) 6.2 6.1 6.1 5.8 Exchequer deficit (1+2) 18.7 17.7 17.3 14.5 General Government Balance
(deficit)
49.9 15.2 22.4 11.4
[image:26.595.73.527.295.625.2]21
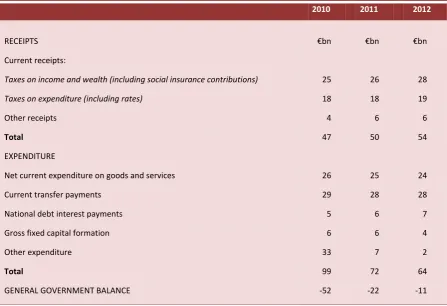
Table 4(b): Exchequer Finances National Accounts Classification € billion
2010 2011 2012
RECEIPTS €bn €bn €bn
Current receipts:
Taxes on income and wealth (including social insurance contributions) 25 26 28
Taxes on expenditure (including rates) 18 18 19
Other receipts 4 6 6
Total 47 50 54
EXPENDITURE
Net current expenditure on goods and services 26 25 24
Current transfer payments 29 28 28
National debt interest payments 5 6 7
Gross fixed capital formation 6 6 4
Other expenditure 33 7 2
Total 99 72 64
GENERAL GOVERNMENT BALANCE -52 -22 -11
The presentation of the accounts is not ideal because of the treatment of the recapitalisation of the banks and the treatment of the promissory notes to Anglo-Irish Bank. The exchequer deficit forecast figure excludes the recent recapitalisation of AIB, Bank of Ireland and Irish Life and Permanent, the exchequer contribution to this at end-July is €7.6 billion and that of the National Pension Reserve Fund (NPRF) is €10 billion, though this is not included in the exchequer returns. Ideally, we require consolidated accounts at least when such large transactions are taking place) but includes the promissory notes payment to Anglo-Irish Bank, Irish Nationwide Building Society and the Educational Building Society, while the General Government Balance (GGB) includes the former and excludes the latter, as the full cost of this was included in the GGB in 2010, and is included in measures of National Debt at end-2010. The trend in the underlying budget position is probably best captured by the current budget deficit, as the capital budget is so distorted by accounting conventions.
[image:27.595.72.520.93.399.2]22
as the health levy was previously subtracted from Health expenditure. Now it is not, but is treated as a revenue item, included in the Universal Social Charge (USC) which in turn is included in Income Tax receipts. In the first seven months of the year this is estimated to have raised €1.1-1.2 billion in revenue. When allowance is made for this, then, on a comparable basis, current expenditure is down about 1.5 per cent. We expect that this trend will continue and current expenditure will come in below budget.
Tax revenue in the first seven months of the year was 8.6 per cent higher than a year earlier, and 1.4 per cent above the estimated profile for the period. However, when allowance is made for the USC, the situation is less favourable, with overall tax revenue increasing by about 3 per cent. Nevertheless, the year totals look achievable. Thus, we expect the current budget deficit at year end to be slightly lower than budgeted. On the capital side there may be some further savings, but it is difficult to forecast what these might be at this stage.
Turning to 2012, the broad fiscal framework is laid out in the report on the EU/IMF Programme of Support for Ireland issued by the Department of Finance (28 July, 2011). This set down explicit guidelines in relation to revenue and expenditure for Budget 2012. In practice, government has more leeway in relation to changes in taxation and expenditure than implied by this as if the required deficit reduction can be met in other ways this will satisfy the conditions of the loans. Nevertheless, the agreement sets out a profile of how of how these savings can be achieved.
Revenue Measures to yield €1,500 million in a full year, but including: a lowering of income tax bands and credits; a reduction in private pension tax reliefs; a reduction in general tax expenditures; a property tax; a reform of capital gains tax and acquisitions tax; and, an increase in the carbon tax.
Expenditure reductions of €2,100 million including: social expenditure reductions; reductions in public service numbers and public service pension adjustments; (reductions in) other programme expenditure; and, reductions in capital expenditure.
23
reducing demand in the economy by these amounts. There are also explicit big-picture numbers proposed for 2013, with revenue measures yielding €1.1 billion, and expenditure reductions of €2 billion. Government has indicated that it will go beyond these broad numbers and state exactly what the tax changes and expenditure reductions will be and this is welcome as the private sector than then plan accordingly. In framing the medium term fiscal details government should aim to surpass the targets set down in the Programme of Support for the reasons stated previously. In addition, there may be other adverse conditions not yet anticipated and there may be a need for some flexibility – a flexibility that would not be there if the budget targets are too tight. The 2012 figures could also be affected by timing conditions in relation to interest payments on EU/IMF and other loans. Nevertheless, the proposed cuts in expenditure and tax increases should proceed as planned and any savings on interest used to reduce the deficit faster.
In framing the budgets it is as well to recognise that output is significantly less than at the peak of the bubble, so that the infrastructural requirements are less than envisaged some years ago. Hence, proposed capital expenditure should reflect this, as well as the shortage for funds.
BOX 1:INFRASTRUCTURE BY EDGAR MORGENROTH
Public capital investment tends to be the first casualty when governments embark on deficit reduction, and it often impacts negatively on the growth potential of the economy. However, given the specific set of circumstances in Ireland today, reduced infrastructure investment over the next few years need not have this negative effect and can help to achieve a more sustainable budgetary position.
An extensive literature has shown that infrastructure yields a high long-run macroeconomic return. The return on such investment depends on the size and quality of the existing infrastructure stock and the level of demand for it. Thus, if the current infrastructure stock is adequate and no constraints exist then the likely return on further investment at this point is low or even negative.
24
Specifically large scale projects involving the construction of new infrastructure have a smaller jobs impact per Euro spent than smaller scale projects and in particular refurbishment and maintenance projects.5
Capital expenditure over the period 2000 to 2009 reveals that investment in infrastructure amounted to almost €55 billion in 2009 prices. Despite this significant level of investment some competitiveness reports rank Ireland poorly in terms of overall infrastructure. However, once objective measures are used in a comparison and relevant factors are taken into account the relative position of Ireland with regard to many infrastructures is considerably better than suggested by the subjective competitiveness rankings.
While infrastructure was increasingly under severe pressure up to 2007, the economic downturn (reflected in the significant decline in GNP) has significantly reduced the pressure on infrastructure. In relation to transport, for example, passenger journeys on CIE services are down by 18 per cent compared to the peak in 2007. Passenger numbers at Dublin airport declined by 21 per cent between 2008 and 2010, while at the same time capacity for some 15 million passengers has been added through the completion of Terminal 2.
The process of drawing up of a National Development Plan (NDP) that can account for the complementarities between investments and ensure consistency with the national objectives is the first-best approach to capital investment programming. However, this approach requires some certainty on capital budgets over a multi-annual period. Capital budgets have been cut successively and now amount to just 50 per cent of what had been planned in 2007 even if one takes into account that tender prices have fallen by about 25 per cent. At this point there this no certainty that further cuts might not have to be implemented. Furthermore, the results of Census 2011 should be taken into account in determining the scale, nature and location of investment. To date only the preliminary results of the CSO Census 2011 have been published, which showed a surprisingly higher population than had previously been estimated. Thus, the detailed plans that would make up a new NDP could be subject to change, or if the capital budget were to be cut further result in postponements of projects, which would undermine confidence in the NDP process. In addition to the uncertainty about the funding envelope and the demographics there is also considerable uncertainty about the right projects to pursue. The proper transparent evaluation and analysis has in many cases not been carried out or,
5
25
where such analysis was done, this did not reflect the changed environment. Therefore it would seem imprudent to embark on a full scale National Development Plan for a five to seven year period and instead a more modest interim public capital plan should be drawn up.
In the context of the significant expansion of the infrastructure stock and the reduced demand in the short term the current focus of capital spending should be on maintaining the existing infrastructure. The only exception should be for infrastructure in very specific locations where constraints can be demonstrated. Where any substantial investment is being considered it should be supported by a comprehensive evaluation, including a proper cost-benefit analysis. For example, before water meters are rolled out, a cost-benefit analysis should be undertaken to estimate whether the net benefit of water meters justifies their roll out for the whole country or whether they are justified in some areas only because of installation and monitoring costs. Measures that improve the efficient use of existing infrastructure should also be prioritised as these will reduce the need for further capacity expansion at a reasonable cost. For example, the reduction of water leakage from the mains combined with other demand management measures in Dublin can potentially defer or even eliminate the need to make to build the required infrastructure to supply Dublin with water from the Shannon.`
To improve the quality of decision making on major infrastructure projects/programmes, the evaluation of projects should be based on independent analysis outside of the promoting agency and these evaluations should be published in order to allow public scrutiny.
26
6. Population, Employment,
Unemployment and Earnings
The preliminary results of the Census of Population 2011 were somewhat surprising in that they revealed a population significantly greater than the population and migration estimates available since the 2006 Census would have indicated.
The 2011 population is approximately 100,000 more than expected on the basis of official CSO estimates. The greater part of this difference is likely to be in the 15-64 age group, of whom over 60,000 could be in the labour force, accounting for 3 per cent of the total. Unfortunately, since we have no way of determining the age distribution of this group until early 2012, we cannot be certain of the totals of those in work or unemployed, though the data for rates of, for instance unemployment by age group, or participation by age group, are probably correct. Often reweighting makes little difference to grossed up numbers, but it would be unwise to assume that the additional population is evenly distributed by age group. There may also be gender issues as the annual net migration estimates for 2006-2010 indicate net migration of 51.7 thousand males and 53.3 thousand females, while the preliminary 2011 Census estimates these for the whole period at 33.6 thousand and 88.1 thousand, respectively. These data may also have implications for grossing up income estimates and hence estimates of GNP and GDP and also growth rates. Unfortunately, as things now stand, we must wait until next year before the Census results are available so that the QNHS results can be re-weighted.
BOX 2:CENSUS 2011 AND MIGRATION ESTIMATES
27
Population 2011 = Population 2006 + (Births-Death) + Net Migration
or Net Migration = Population 2011 - Population 2006 – (Births - Deaths)
In making annual intercensal estimates of population, as for 2009 for instance, it is necessary to make an estimate of net migration in that year – this is no longer derived from known population numbers. This migration estimate is then added to an estimate of the population based on projecting forward the existing 2008 population by ageing the numbers by one year, adding the number of births and subtracting the number of deaths. The annual migration flows are estimated from the Quarterly National Household Survey (QNHS), supplemented by data such as the number of Personal Public Service numbers issued to non-Irish nationals, the number of work permits issued or renewed and the number of asylum applications. This allows an estimate of emigration and immigration and the QNHS detail makes it feasible to distinguish gender, age, region, etc.
The methodology is basically sound and is preferable to the previous reliance on net passenger movements by sea and air, which historically formed the backbone of annual estimates of migration. If the estimated net migration figure for the period April 2006 to April 2010 of 63,000 was correct, the census results would imply that there was a net inflow of over 55,000 people in the year to April 2011. This number seems highly implausible when the general expectation was that there had been a net outflow in that year. The CSO has suggested that inward migration was stronger in the early part of the intercensal period and that this was followed by a switch to net outward migration towards the end of the period. This suggests that the annual population and migration estimates need to be revised back to 2006.
28
[image:34.595.70.530.299.577.2]In spite of these caveats in relation to the QNHS there is still a big picture that emerges from the data. First, there has been a catastrophic fall in the numbers employed in construction. Employment in the sector peaked in the second quarter of 2007 at 271,600 and has fallen continuously since then reaching 108,100 in the first quarter of this year. The collapse in construction output has created a structural unemployment problem. The full scale of this is difficult to gauge as a significant number of workers in this sector were from overseas, and a certain number of these will have returned home (the number being somewhat uncertain, as discussed above). In addition, some of those previously employed in the sector will have obtained work in other sectors, including agriculture. The following table attempts to capture the scale of the problem.
Table 5: Employment and Unemployment 000s Irish and Non-Irish
Quarter Irish Non-Irish Total
Total Population >14 Q II 2007 QI I 2011
3,027.5 3,150.3 435.0 357.3 3,462.5 3,507.6
Labour Force Q II 2007
QI I 2011
1,882.0 1,852.2
335.0 247.7
Total Employment Q II 2007
QI I 2011
1,798.4 1,601.4 315.5 202.9 2,113.9 1,8043 Employment in Construction
Q II 2007 QI I 2011
224.7 98.5 45.2 8.9 269.9 107.4
Unemployment Q II 2007
QI I 2011
83.6 250.8 19.5 44.8 103.1 295.6
Total Numbers (Irish and Non-Irish) unemployed who previously worked in construction
QI 2007 QI 2011
16.7 79.5
Source. QNHS Various issues.
29
large number of people who were previously in the construction sector being currently unemployed. This is the basis for believing that there is a major structural unemployment problem. Had all construction workers obtained employment, even with the same high level of unemployment, then the problem would not be structural. There is still high unemployment among construction workers. Meanwhile, there are reports of skill shortages in some sectors, but the numbers are relatively small.
Unemployment has regional and gender aspects in addition to structural. Male participation rates have fallen from 73.9 per cent in early 2007 to 68.2 per cent in the first quarter of this year. The rate of male unemployment has increased from 4.7 per cent to 17.2 per cent over the same period. By contrast female participation fell from 54.7 per cent to 52.9 per cent, while female unemployment rose from 3.9 per cent to 10.4 per cent. There is, however, a much greater incidence of part-time working among women and this has increased slightly over the period. There is also a regional dimension to unemployment. In the first quarter the average unemployment rate was 14.1 per cent, but the Border, Dublin Mid-East and South-West experienced unemployment rates below that while the Midland, West, Mid-West and South-East were above it. Dublin had the lowest rate at 12.5 per cent whereas the South-East had the highest at 17.2 per cent. There has been a significant increase in participation rates in education among younger age groups, thus reducing their participation in the labour force.
30
The recent data in relation to migration over the period 2006-2011 show how hard it is to estimate, never mind forecast, migration. We understand the factors that affect the migration in the past, covering the 1950s the 1970s and the 1980s when much of the migration was between Ireland and the UK. However, we do not have sufficient data to explain migration between Ireland and the new accession states and the migration of people from those states when they emigrate from here.
31
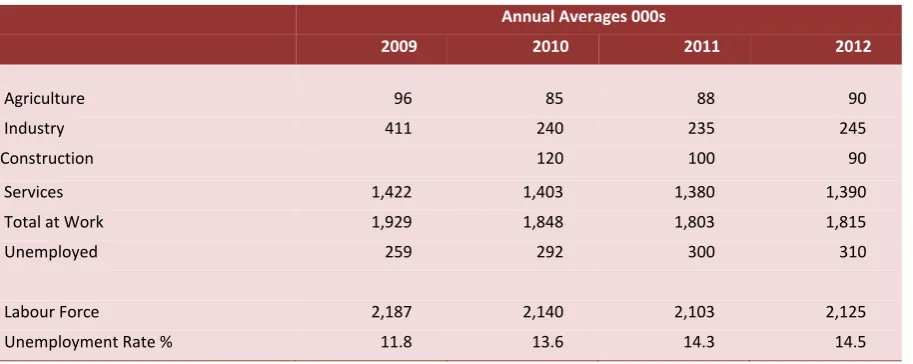
Table 6: Employment and Unemployment
Annual Averages 000s
2009 2010 2011 2012
Agriculture 96 85 88 90
Industry 411 240 235 245
Construction 120 100 90
Services 1,422 1,403 1,380 1,390
Total at Work 1,929 1,848 1,803 1,815
Unemployed 259 292 300 310
Labour Force 2,187 2,140 2,103 2,125
Unemployment Rate % 11.8 13.6 14.3 14.5
BOX 3:ACTIVATION IN IRELAND:THE IMPACT OF THE NATIONAL EMPLOYMENT ACTION PLAN S. McGuinness, P.J. O’Connell and E. Kelly
Ireland’s unemployment rate currently stands at 14.3 per cent. Given the scale of the problems facing the country at present, the level of unemployment is likely to remain high over the medium term. In this context, it is particularly important to implement effective activation measures to assist and encourage jobseekers to remain active in the labour market and/or to increase their employability in order to avoid long-term unemployment.
In 2009, the Economic and Social Research Institute (ESRI) was commissioned by the Department of Social Protection (DSP) to conduct a systematic evaluation of activation measures that are implemented under the National Employment Action Plan (NEAP), which is Ireland’s activation strategy.6 Under the NEAP, unemployed individuals in receipt of Jobseeker’s Benefit (JB) or Jobseeker’s Allowance (JA) who reach three months on the Live Register are identified by the DSP and referred to FÁS for an activation interview. In this interview, the client’s needs are assessed and he/she is provided with job search assistance. Some individuals are also referred to employment or training opportunities. The ESRI study evaluated two key interventions implemented under the NEAP: i) referral by the DSP for an activation interview with FÁS and ii) participation in training programmes provided by FÁS following an activation interview. The analysis was based on a unique dataset that was constructed by combining three separate
6
32
data sources: i) a specially designed questionnaire administered to all new claimants for JB or JA between September and December 2006; ii) weekly administrative data from the Live Register of unemployment, which contained information on all unemployment benefit recipients in Ireland, and on their movements on and off the Live Register; and iii) client event files collected by FÁS. Those jobseekers that registered a new unemployment benefit claim between September and December 2006 were subsequently tracked until July 2008, so the evaluation refers to the effects of the NEAP over that time period.
The research pointed to three main findings on the effectiveness of Ireland’s activation strategy:
1. There were problems of access to programmes under the NEAP, so not all of those jobseekers who needed to participate in an activation measure did so. Approximately 25 per cent of jobseekers who were eligible for assistance under the NEAP were not in fact identified and referred. Another 25 per cent of jobseekers who had a previous spell of unemployment and received an intervention at that time were not eligible for NEAP assistance in their current spell.
2. Those individuals who were referred by the DSP to FÁS for an activation interview were less likely to become employed. When the authors compared the employment outcomes of those that were either referred for an interview with FÁS or had received both a referral and an activation interview with a group of similarly unemployed individuals that were not referred, it was found that this NEAP intervention had a negative impact, with the chances of entering employment being about 17 per cent lower for those who went through the referral and interview process.
3. FÁS training programmes increased participant’s employment prospects. Compared with jobseekers that were either referred for an interview with FÁS or had received both a referral and an activation interview, FÁS training was found to increase an unemployed person’s likelihood of exiting the Live Register by between 10 and 14 per cent. However, the combined effect of receiving both FÁS training and an activation interview was either zero, or at best, weakly positive, because of the negative impact of the FÁS referral and interview process.
The DSP is currently developing a new National Employment and Entitlements Service (NEES) which has the potential to deliver a number of important reforms:
33
activation policies is similar to the role adopted by social welfare authorities in other countries.
2. The DSP is introducing a profiling system for the unemployed, developed in collaboration between the Department and ESRI researchers. Profiling is a state-of-the-art statistically-based system for the early identification of those with a high probability of becoming long-term unemployed at the time they first become unemployed. This will facilitate the delivery of appropriate interventions with jobseekers according to their likelihood of becoming long-term unemployed, and provides the capacity to target resources on those who most need, and can benefit most from, activation measures.
3. The DSP is implementing a new case management system with a strong focus on activation, rather than just income support. A further innovation is the provision for sanctions to be applied to unemployed persons on the Live Register unreasonably refusing to participate in training, education and employment offered by the NEES.
These developments are welcome. Underlying the reforms is a new commitment to a social contract based on mutual obligations: job seekers are expected to seek work and improve their employability and in return receive income support and high quality activation services from the community. To underpin that social contract, activation policy needs to have systematic monitoring of job search activity backed up by effective sanctions, while training policy needs to focus on programmes with a close connection to the labour market that enhance the employment prospects of their participants.
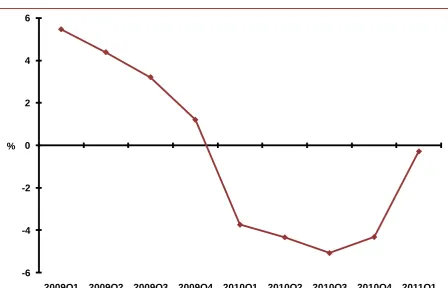
Average earnings in the economy at large remained relatively constant throughout 2010 following the declines of the previous year, though the wage bill was down 3.3 per cent. Recent years have been characterised by falling public and private sector wages. Public sector pay rates were reduced from January 2010, with pay cuts averaging 6.2 per cent, though with increments the actual cuts were less (Chart 1). The pension levy introduced for public servants, from the first half of 2009 represented an average deduction of approximately 7 per cent.7 Private sector earnings fell slightly earlier and the declines are less. However, private sector data are more difficult to interpret as there has been a much greater fall in private sector employment by sector and consequently some composition changes, where patterns of average earnings differ by sector. For instance, while average hourly earnings (excluding irregular earnings) fell by 0.2 per cent between the first quarters of 2010 and 2011 average hourly earnings in
7
34
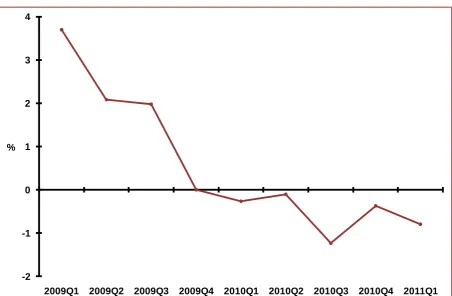
[image:40.595.74.523.376.664.2]Construction declined by 8.1 per cent and earnings in the Information and Communication sector rose by 5.2 per cent. There may also be within-firm composition changes with employment losses among unskilled workers greater than among skilled workers and this can affect measured average earnings. The decline in hourly earnings in Construction is exactly what might be expected, given the decline in employment in the sector, but the increase in unemployment might have been expected to have a bigger impact on earnings than it has. This same characteristic was observed during the long-1980s recession, with insiders effectively protecting themselves, and was only broken in the early years of social consensus when pay increases were less than might have been expected.8 This was easier to achieve in the 1980’s with inflation running at 4 per cent compared with the present situation where further real and nominal wage cuts will be required. This point is returned to in the General Assessment, but we do not see nominal average hourly earnings increasing, except in some isolated areas, such as International Services where shortages have emerged, and possibly in export-oriented indigenous firms.
Figure 1: Public Sector Hourly Earnings, Annual % Change
Source: Earnings and Labour Costs, CSO.
8
Durkan, J. and Harmon, C. (1996). “Social Consensus, Income Policies and Unemployment”, UCD Centre for Economic Research WP 96/11, UCD.
-6 -4 -2 0 2 4 6
2009Q1 2009Q2 2009Q3 2009Q4 2010Q1 2010Q2 2010Q3 2010Q4 2011Q1
35
Figure 2: Private Sector Hourly Earnings, Annual % Change
Source: Earnings and Labour Costs, CSO.
-2 -1 0 1 2 3 4
2009Q1 2009Q2 2009Q3 2009Q4 2010Q1 2010Q2 2010Q3 2010Q4 2011Q1