S
TAYING INS
CHOOL:
A
SSESSING THER
OLE OFA
CCESS,
A
VAILABILITY ANDO
PPORTUNITYC
OSTA
NGELAB
ASCHIERI,
J
ANEF
ALKINGHAMA
BSTRACTThis paper investigates the role of contextual factors outside the household in determining whether or not a child attends basic education in Tajikistan. By combining data from the Tajikistan Living Standard Survey with data from a parallel community survey, aggregated census data at the jamoat (village) level, and spatial data, a series of variables are constructed which characterize the environment where the child lives. These variables serve as proxies for the accessibility and availability of school services, quality of education, opportunity cost of education in terms of the opportunities for income generating activities forgone, and level of economic development in the communities. Applying multilevel modelling techniques, the results show that contextual factors have a strong effect on school attendance. Accessibility of service and higher quality of school have a positive effect, however a high opportunity cost to education in a community exerts a negative effect on school attendance.
STAYING IN SCHOOL: ASSESSING THE ROLE OF ACCESS,
AVAILABILITY AND OPPORTUNITY COST
Angela Baschieri1 and Jane Falkingham2
1
Centre for Population Studies, London School of Hygiene and Tropical Medicine 2
Southampton Statistical Sciences Research Institute (S3RI) University of Southampton
February 2007
Abstract
This paper investigates the role of contextual factors outside the household in
INTRODUCTION
Tajikistan, located in the south-eastern corner of Central Asia, is today ranked as one of the poorest countries in the world with a GDP of just $1,106 (PPP) (UNDP, 2005). At independence Tajikistan inherited a strong school system, and despite civil war and very little investment, the legacy remains strong. According to official statistics, literacy rates have only declined slightly, from 99 percent at Independence to 95 percent in 2003, and public support for education remains high. In 2003, enrolment rates were 98 percent for children aged 7 to 11 and 94 percent for children age 12 to 15, which are high by international comparisons with countries with a similar level of GDP (Baschieri and Falkingham, 2007). However, the recent World Bank Tajikistan Poverty Assessment Update (World Bank, 2005) highlighted a fall in school attendance rates since 2000, with the drop in attendance rate being particularly noticeable in secondary and post
compulsory education. At the same time there has been a widening gender gap, with more boys staying in education than girls. Moreover there is increasing geographical variation in school attendance rates, with urban centres like the capital city of Dushanbe experiencing attendance rates significantly below the national average.
The 2005 World Bank Poverty Assessment Update put forward a number of possible explanations for the fall in attendance including the increase in the cost of education with the introduction of charges for text books and other associated expenses, the deterioration in quality of schooling with lack of teachers, materials and poor physical infrastructure, and the location of education institution, with many children having to travel significant distances to school, particularly in remote rural areas. However a comprehensive analysis that investigates individual, household and community
CONCEPTUAL FRAMEWORK
The decision to send a child to school depends upon a range of factors including individual or household level characteristics such as the child’s age, gender, level of parental education and the household’s socio-economic status, family composition (nuclear or non nuclear family, number of siblings). In addition, a number of contextual factors outside of the household may be hypothesised to influence school attendance: for example the availability or accessibility of school service in the community, the
[image:4.612.100.523.371.644.2]perceived quality of schooling, the opportunity cost that the family faces in terms of the opportunities for income generating activities forgone when making decision to send a child to school and the overall level of economic development in the community (see Figure 1).
Figure 1: Conceptual framework
INDIVIDUAL LEVEL VARIABLES
CONTEXTUAL VARIABLES
Availability/accessibility of services
Quality of schooling
Opportunity cost to education
School Attendance
Parental education
Child age
Gender
Place of residence
Socio-economic characteristics of the family
Economic development of communities
Family
Previous studies: Individual Level Factors
Previous studies on school attendance have highlighted individual and household level factors which influence school attendance. Several studies confirm the importance of parental education and household wealth on school entry and school retention (see Lloyd and Blanc, 1996; Anh et al. 1998, Hill and King 1993, Hollander, 1998, Sathar and Lloyd 1994, Chernichovsky 1985). Levy (1999) found a strong negative effect of school fees on school enrolment in Ghana, highlighting the role of household wealth and the ability to pay.
In the household-production framework developed by Becker (1968), a decision to send a child to school is derived from a maximization of welfare, and long-term family welfare is seen as central to the educational decision. This may be relevant in Tajikistan where the social security system has all but collapsed and where parents may rely on children for future family support in the absence of a pension paid at a living wage. Buchmann (2000) found for Kenya that a decision to send a child to school was derived from the parental expectation for future financial help.
Lloyd and Blanc (1996) found that the presence of younger siblings in the household negative influences school attendance, whereas the presence of siblings in their school years in the household positive influences school attendance providing evidence that children still playing a role in family support. Hermalin et al. (1982) found that educational attainment of women born before the widespread of family planning
Previous studies: Contextual Factors
The majority of studies on school attendance have concentrated on household level factors. However, in recent years, with the growing availability of community surveys, other factors have been found to influence both entry and retention in school for children.
Several studies have emphasis the role of service availability on school enrolment (Filmer, 2004, Handa, 2002). Filmer (2004) analysing data for 21 countries and found that availability of school influence school attendance. However, Filmer (1994) also found that a big reduction in distance results in only a small increase in school attendance.
Handa (2002) analysing the relative importance of school supply versus household demand factors for Mozambique and applying a simulation exercise, found that building more schools or raising adult literacy would have a larger impact on enrolment rates than interventions that raise household income.
Other studies have found that the perception of quality of schooling influence school attendance (Lloyd et al., 1998). Glewwe and Jacoby (1994) found that school
characteristics influence school achievement though increase in grade attainment.
Lockheed and Verspoor (1991) found an effect of school quality on student achievement. However, they did not find an effect of school quality on school entry. Studies have also stressed the importance of employment opportunity on school attendance (Levinson et al. 2001, Canagarajah and Coulombe, 1997, Nielsen, 1998, Binder 1999). However,
Raviollion and Wodon (2000) show that is not necessary true that child work displaces schooling. Siddiqi and Patrinos (1995) argue that some children might have to work to afford the direct costs of schooling. Alderman et al. (2001) found that schooling choices of poor households are very sensitive to school fees, proximity and quality.
Furthermore, many of these studies have focussed on one contextual factor and have not taken an holistic view of the contextual influences on school attendance. This is
primarily the result of data availability and the fact that most datasets focus on a limited range of contextual variables.
DATA
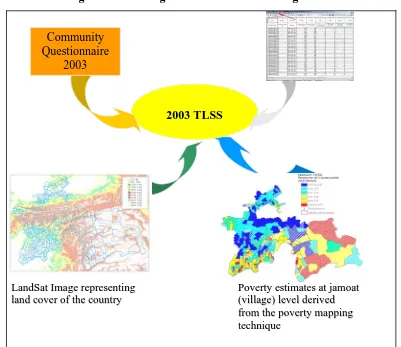
There is currently no single data source available within Tajikistan that contains information on both the individual and household characteristics of children, their attendance at school and the characteristics of the community in which they live. This paper therefore combines data from a range of different sources using techniques of both data linkage and simulation to create a unique dataset with which to investigate the correlates of school attendance.
The dataset used here includes:
¾ The 2003 Tajikistan Living Standards Survey o Household and individual questionnaire o Community questionnaire
¾ The 1999 Census of Tajikistan
¾ Community estimates of poverty derived from a World Bank funded project on developing a poverty map of Tajikistan (Baschieri and Falkingham, 2005)
¾ A set of spatial data derived from LandSat imagery for the country, including land cover, road infrastructure and elevation (GeoData Institute, 2006).
Figure 2: Combining data to investigate the factors influencing school enrolment
The 2003 Tajikistan Living Standards Survey
The 2003 Tajikistan Living Standard Survey (TLSS) was conducted by the National Statistical Committee of Tajikistan with funding from the UK Department for International Development (DFID) via a World Bank trust fund and with technical assistance from a team based at the University of Southampton of which the authors were a part. The TLSS collected detailed information from 26,141 individuals living in 4,156 households. This included 7,344 children aged between 7 and 17 i.e. of school age. For each child it is possible to derive a set of variables including their age, sex, level of mother’s education (primary or lower, secondary, higher), level of father’s education (primary or lower, secondary, higher), father’s economic status (working or not working)
2003 TLSS
L
LaannddSSaattIImmaaggeerreepprreesseennttiinngg l
laannddccoovveerroofftthheeccoouunnttrryy
P
Poovveerrttyyeessttiimmaatteessaattjjaammooaatt
(
(vviillllaaggee))lleevveellddeerriivveedd
f
frroommtthheeppoovveerrttyymmaappppiinngg t
teecchhnniiqquuee
Community Questionnaire
whether the household is poor or not1, as well whether they are currently attending school or another educational establishment. Table 1 shows how enrolment rates varied by children’s and parental characteristics.
Table 1: Enrolment rates by child and parental characteristics, TLSS 2003.
Enrolment in Primary 7-10 Enrolment in Lower Secondary 11--15 Enrolment in Upper Secondary 16-17
Gender ** **
Male 85.7 95.2 78.6
Female 84.8 90.3 58.4
Mother’s education ** *
Primary and lower 83.7 83.8 58.2
Secondary 85.1 93.1 69.5
Higher 87.2 98.1 84.4
Mother not in hh or info not available
89.8 90.6 50.7
Father ’s education * **
Primary and lower 72.3 87.4 61.9
Secondary 84.9 93.6 68.4
Higher 87.8 94.5 79.7
Father not in hh or info not available
85.4 89.6 59.8
Father working status
No working 85.2 93.4 70.5
Working 83.0 90.8 67.0
Father not in hh or info not available
89.4 91.5 58.9
Poverty status *
Poor 84.7 92.9 73.2
Non Poor 86.7 92.8 66.1
Place of residence **
Urban 85.1 89.1 65.5
Rural 85.3 94.2 69.6
Region ** **
Gbao 90.5 97.0 90.8
Sogdian 85.8 94.9 72.7
Kahtlon 85.8 92.4 65.5
Dushanbe 82.5 84.6 66.4
RRS 84.3 93.7 65.4
Total 85.3 92.8 68.6
Source: authors’ own analysis TLSS 2003.
1
In addition to the household and individual questionnaires, the TLSS also included a community questionnaire which was administered in each of the 208 primary sampling units. The community questionnaire collected a range of data including the presence of various types of educational facilities (primary, secondary and tertiary) in the community and if not, the distance and travel time to the nearest facility of that type (usually in the raion centre). These variables provide information both about the availability of schooling within the community and accessibility of education facilities outside the community.
Key stakeholders within the community, such as village leaders, teachers, doctors etc. were also asked about the quality of schools in the community. In particular, the
stakeholders were asked whether ‘most schools in this population point have satisfactory and sufficient: a) buildings, b) desks/chairs, c) blackboards, d) textbooks, e) heating fuels, f) other school supplies’. From these six questions it is possible to derive an index of the
quality of the school infrastructure within each community. Here, a simple additive index is derived with school quality in those communities recording a positive answer in less than 2 cases being rated bad, 3-4 as middling and 5-6 as good.
The opportunity cost of sending children to school in terms of income generating activities foregone may be hypothesized to be a function of the opportunities for such income generation within the community. In order to capture such opportunities, data from the community level questionnaire were used to derive a series of variables
including the presence of a market/bazaar, the major economic activity in the community agriculture or otherwise), and if agriculture, the major crop. Previous research has
LandSat imagery
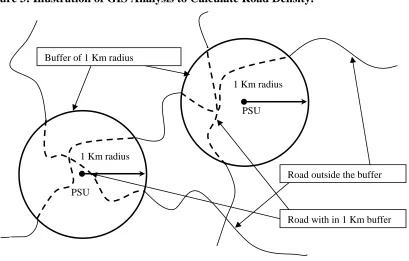
The level of detail on land use, economic opportunities and infrastructure in the community questionnaire of the TLSS is limited. In order to enhance this, a set of additional variables concerning land cover, road density, altitude of settlement and the slope of the land surrounding the settlement were derived from a set of LandSat images for the country through the application of GIS techniques using the ArcView 3.2 and 8.2 software.
Land use variables are derived by measuring the proportion of land dedicated to each specific category of land use (which included cotton, elevation, proportion of land above a specific degree of slope, urbanized area, road density) within a specific buffer (around the location of the PSUs). This buffer was constructed around the sampling point and then intersected with the land cover reclassified layers. Using an Avenue script in ArcView 3.2, the area dedicated to each land cover type within each buffer was
Figure 3: Illustration of GIS Analysis to Calculate Road Density.
The 1999 Census of Tajikistan
Finally, it is hypothesized that school attendance may, in part, be a function of the level of economic development of the community. Data from the 1999 Census of Tajikistan was used to create a series of variables at the level of the PSU that further describe the socio-economic and demographic characteristics of the community. These included the proportion of men and women aged 15 and above who were economically active, the proportion of the population with various levels of education (no education, primary only, secondary only, higher education), the sex ratio of those in education, the overall
dependency ratio (i.e. the population under 15 and over 60 divided by the population aged 15-59), the child dependency ratio and the old age dependency ratio.
Community estimates of poverty
In addition to data derived directly from the census, this paper also uses a set of data on community estimates of poverty. Previous research by the authors (Baschieri and
Falkingham, 2005) involved deriving a set of spatially disaggregated estimates of welfare using the poverty methodology developed by Elbers et al (2002). This technique uses
1 Km radius
Road with in 1 Km buffer Buffer of 1 Km radius
Road outside the buffer PSU
PSU
data from the 2003 TLSS to simulate estimates of household welfare in the 1999 Census of Tajikistan. This paper uses the estimates of community poverty at the jamoat level obtained from the poverty mapping exercise along with other information from the 1999 Census to provide a set of contextual variables representing the economic development of the communities.
By combining data from four different sources using GIS, the paper uses a unique dataset that allows us to take a holistic approach to community influences on school enrolment and to investigate the relative role of school availability, quality of education, opportunity cost and the socio-economic characteristics of the community whilst controlling for individual and household characteristics.
THE MODEL
Figure 4: School attendance, by gender and age, 2003 0 20 40 60 80 100
6 7 8 9 10 11 12 13 14 15 16 17
Age A tte n d a n ce (% ) Female Male
Source: authors’s calculation of TLSS, 2003.
Three levels of hierarchy in the data are considered: individual/household, PSU/ jamoat and rayon/district. At the first level, only individual level responses are considered as there were too few children per household to allow for separate household level
estimates. Then two separate levels of aggregation are used: first, the PSU/jamoat which represents the village or immediate neighbourhood; and second, the rayon, which
represents the province in which the child lives and which is affected by the same state policies.
Thus a three-level logistic model for the probability of attending or not attending education for children 7-17 years old and for children 11-17 year is applied. The three level logistics model is written as:
ijk k jk T ijk k ijk ijk
e(π /(1−π ))=α +β X +U +V +ε
log .
versus not attending school. This constrains the predicted values for πijk from the model
to be between zero and one. The parameter α is a constant, whilst βkis the vector of parameters corresponding to the vector of potential explanatory factors defined asXijk. The PSU (level 2) residual term is defined as Ujk ~ N(0,σu2), and the rayon (level 3) residual term is defined as Vk ~ N(0,σv2). A final assumption is that the there is no covariance betweenUjk, Vk or between either of these and the individual-level error
termεijk.
The models are estimated using MLWin software2 which allows the calculation of the residual variance remaining after the model fitting.The design of each survey is
accounted for by including the factors used in stratifying the sample either as covariates or as levels in the model. However, the analysis is not weighted as this can potentially bias random effects in multilevel models (Brown, Madise and Steel 2002).Thus the design of each survey is accounted by the levels of the multilevel model and by either urban-rural residence.
The advantage of a multilevel model is that it not only accommodates the hierarchical nature of the data and corrects the estimated standard errors to allow for clustering of observations within units (Goldstein 2003) but it also allows the identification of
clustering in the outcome (also known as the random effect) which represents the extent to which the outcome of interest varies at local area (PSU or district). A significant random effect may represent factors that influence the outcome variable that cannot be quantified in a large scale social survey. A random effects model thus provides a mechanism for estimating the degree of correlation in the outcome that exists at the community level (PSU or district), while also controlling for a range of individual and household level factors thought to influence the outcome. The MLWin software package allows the estimation of the random effect as well as the variances of the random effects, providing a tool to assess whether significant variation is found and at a specific level (Goldstein et al. 1998). If the random effect is significantly different from zero after the
2
inclusion of all possible individual and household level factors, then this implies that there are ‘unobserved’ community factors which are also acting to influence the
schooling outcomes. These unobserved community factors are captured by the inclusion of the contextual variables on access, availability and quality of schooling and on the economic characteristics of the jamoat and raion.
RESULTS
The results of a multilevel regression model including the contextual variables along with the personal and household characteristics of the child are shown in Table 2.
Key findings include:
1. The child’s individual characteristics are important, with enrolment falling with age and with girls being more likely to drop out of school than boys, even after
controlling for all other factors.
This result confirms previous findings from the qualitative study carried out by the UNICEF designed to understand the reasons behind girls school drop out (d’Hellencourt 2004). That study found that girls believe that education will not impact upon their future quality of life and that parents prefer to send to school boys rather than girls when
confronted with economic difficulties. This study also found that girls prefer to attend ‘Bihutan’ which are religious classes which are considered an alternative form of education for girls. Girls prefer such classes firstly because they are provided free of charge and secondly because they are perceived to provide more relevant skills for future married life.
• Children living in households with siblings aged under five are also more likely to drop out, whilst children with siblings of school age are more likely to attend education. This may reflect the role children play in family support, with older children with younger siblings being more likely to be involved in household responsibilities and the care of younger household members.
3. Community level factors are also critical:
• Availability of complete secondary education within the community is important,
with enrolment being significantly lower amongst children living in communities with a secondary school.
• Perceived quality is significant, with enrolment lower in communities where quality is perceived to be poor.
The issue of the perception of poor quality of education as a deterrent for school attendance was also highlighted during focus group discussions carried out as part of a qualitative study of poverty conducted in 2006, funded by UNICEF with assistance from the authors (Saidov, 2006). The focus groups revealed issues related to poor school infrastructure and need for supplementary teaching (Saidov, 2006).
Rasoul, 15 year old “We wish we could speak fluent Russian, in case we have to go to Russia. However, the teaching of Russian at school is very weak. We can say that we do
not know this subject”.
Doud, 11 years old from Roghum discussed his discontent with school infrastructure “My joints ache. It is cold in classes in winter. Most of the time in winter I stay home”.
• Opportunities for employment outside of school may also play a significant role in
determining participation in education. Children living in communities where a high proportion of land has a slope of less the 5 degrees (i.e. is potentially arable) are less likely to be enrolled than other children. This is after controlling for urban and rural residence.
to school, said: “I do not go to school now because my parents cannot afford to buy notebooks, textbooks and other school supplies for me. I had to drop out of school and
help my mother to earn money. Ours is a family of 7, 3 adults, and 4 children. But my
mother is the only one in the family who has a job. I try and help her but the money we
have is not enough to buy everything we need”. Ismatullo, 13 years old living in Dushanbe said “ Even if you are wise as Solomon, you cannot continue studying if you have no money”.
There have been several studies which have shown evidence of the effect of employment opportunities on school attendance in Tajikistan. For example, a survey conducted on behalf of the IOM/PULSE found that children in Panj Vose and Khatlon were missing around 10 percent of the study hours per year and in Zafarabod students were absent from classes for up to one-third of the academic year due to cotton harvesting
Table 2: Parameters estimates of multilevel logistics model for attendance in education for 7 to 17 years old, TLSS 2003.
Model I:
BASIC MODEL
Model II:
Accessibility/
Availability
Model III:
Quality of
education
Model IV:
Opportunity cost
Model V:
Economic
Model VI:
FINAL MODEL
Intercept 3.538***(0.289) 3.608***(0.288) 3.643***(0.297) 4.029***(0.333) 4.565***(0.486) 4.767***(0.423) Age groups
7-11 R
12-14 0.720***(0.109) 0.721***(0.109) 0.725***(0.109) 0.721***(0.109) 0.719***(0.109) 0.724***(0.108) 15-16 -0.313**(0.102) -0.314**(0.102) -0.311**(0.102) -0.312**(0.105) -0.312***(0.102) -0.308**(0.101) 17 -1.759***(0.106) -1.760***(0.105) -1.760***(0.106) -1.754***(0.106) -1.761***(0.106) -1.750***(0.105)
Household Size -0.032***(0.013) -0.032***(0.013) -0.031***(0.013) -0.033***(0.013) -0.031***(0.013) -0.031***(0.013)
Place of Residence Urban R
Rural 0.300*(0.144) 0.316*(0.139) 0.312*(0.142) 0.077(0.160) 0.567***(0.172) 0.305(0.174)
Gender Male R
Female -0.589***(0.076) -0.591***(0.076) -0.590***(0.076) -0.589***(0.076) -0.588***(0.076) -0.588***(0.076)
Mother’s education
Primary -1.127***(0.282) -1.110***(0.282) -1.125***(0.282) -1.110***(0.282) -1.073***(0.283) -1.034***(0.281) Secondary -0.746**(0.234) -0.744**(0.234) -0.747**(0.234) -0.735**(0.234) -0.714**(0.235) -0.703**(0.233) Higher R
Mother not in the hh -0.858**(0.309) -0.858**(0.308) -0.859**(0.309) -0.863**(0.309) -0.828**(0.310) -0.841**(0.307)
Father’s education
Primary -0.712**(0.256) -0.722**(0.255) -0.701**(0.256) -0.717**(0.256) -0.709**(0.256) -0.720**(0.254) Secondary -0.373**(0.119) -0.371**(0.118) -0.366**(0.118) -0.362**(0.118) -0.373**(0.119) -0.345**(0.118) Higher R
Father not in the hh -0.502**(0.139) -0.497**(0.139) -0.499***(0.139) -0.502***(0.139) -0.507***(0.139) -0.494***(0.137)
Siblings under 5 yrs old
Model I:
BASIC MODEL
Model II:
Accessibility/
Availability
Model III:
Quality of
education
Model IV:
Opportunity cost
Model V:
Economic
Model VI:
FINAL MODEL
NO R
Siblings in school age
Yes 0.284*(0.121) 0.295*(0.121) 0.285*(0.121) 0.281*(0.121) 0.303*(0.122) 0.307**(0.121) NO R
State Complete -0.428***(0.119)
Available R
Non Available -0.368**(0.121)
Quality of school Good/ Excellent R
Satisfactory -0.160(0.133) -0.133(0.129)
Bad -0.686**(0.254) -0.526*(0.253)
Opportunity cost
Prop of land b/w 0-5 -0.605***(0.196) -0.635***(0.178)
Economic pressure in
Dependency Ratio -1.469**(0.552) -0.888*(0.471)
Observations 7336 7336 7336 7336 7336 7336
Rayon level Variance 0.169**(0.066) 0.134*(0.059) 0.128*(0.058) 0.106*(0.054) 0.149*(0.063) 0.015(0.033)
PSU level Variance 0.231***(0.062) 0.222***(0.061) 0.236***(0.062) 0.243***(0.063) 0.236***(0.063) 0.253***(0.062)
R
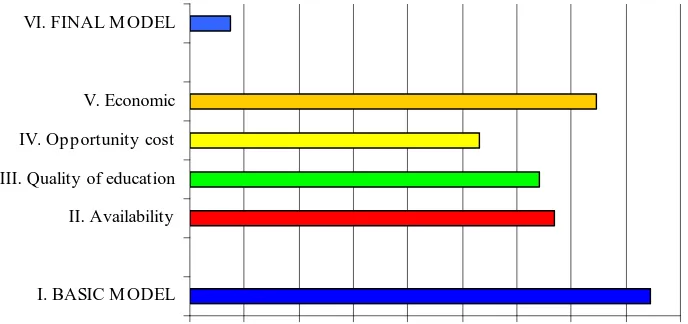
Interestingly, the inclusion of the characteristics of the location in which the child lives reduced the variance at the district (rayon) level, i.e. these location variables explain all the variation between communities (Table 3 and Figure 5). This confirms the importance of place in determining school enrolment as well as individual and parental
[image:21.612.86.303.307.434.2]characteristics. This has important implications for policy makers, suggesting that policies that impact at the community level can have a significant beneficial affect on schooling. Improving the quality of school and/or availability of institutions at the local level will reduce school drop out.
Table 3: District (rayon) level variance and percentage reduction of variance, TLSS 2003.
District variance %
Null model 0.169 100
Availability 0.134 20.7
Quality of
education 0.128 24.3
Opportunity cost 0.106 37.3
Economy 0.149 11.8
Final Model 0.015
Figure 5: District level variance, TLSS 2003.
0.000 0.020 0.040 0.060 0.080 0.100 0.120 0.140 0.160 0.180 I. BASIC M ODEL
[image:21.612.103.447.505.667.2]CONCLUSION
The research has shown that the factors influencing school attendance are complex and multifaceted and that individual, household and community characteristics are all important. Given this, policies to increase school attendance in Tajikistan need to focus on individual, family and community level interventions. School quality and availability are important determinants of school attendance and investment in improving the
infrastructure damaged during the civil war will have a significant beneficial affect. However, it is also clear that issues of child labour need to be addressed, both within the home and beyond. Children with siblings aged under 5 are less likely to attend school than those with older siblings, highlighting the fact that some children are missing out on school to take care of younger household members. School attendance is lower in areas with better income generating opportunities, reflecting a higher opportunity cost of education.
According to Tajikistan’s Labour Code, the minimum age for the employment of children is 16 years of age and workers under the age of 18 may work no more than 6 hours a day and 36 hours a week. However it is acceptable for children under 16 to do some light work. Article 174 of Tajikistan’s Labour code states that:
“To prepare young people for production labour it is allowed to take pupils from
schools, students of professional colleges for carrying out light work, which will
not cause damage to their health and education. Work should be performed
during free time after reaching age of 14 and with the approval of a parent
guardian”.
to 28 hours or more a week. Using a definition of child labour that combines all those doing paid work, unpaid work, intensive household chores and working for the family business, around 12 percent of all children 5-14 years old are regularly engaged in one of more of these activities (Baschieri and Falkingham, 2007). Thus an estimated 200,000 Tajik children aged 5-14 are engaged in some form of child labour (excluding non intensive household chores) and 65,000 children aged 5-14 are engaged in paid work. Most of these children attend school but around 10% i.e. 20,000 do not. These are
children living in private households and the figures do not include street children. These children are effectively excluded from the opportunity to fulfil their potential to the fullest possible. Whilst the government of Tajikistan recognizes that child labour is a problem, it does not currently have a comprehensive policy for eliminating child labour and the government has not signed the ILO Convention 182 on the ‘Worst Forms of Child Labour.’ Urgent action to tackle child labour in all its forms is required.
References
Anh, T. S., J. Knodel, D. L., Friedman, J. 1998. Family Size and Children’s Education in Vietnam. Demography. 35(1): 57-70.
Alderman, H. Orazem, P.F., Paterno, E. M. 2001. School Quality, School Cost, and Public/ Private School Choices of Low-Income Household in Pakistan. The Journal of Human Resources. 36(2).
Becker, G. 1968. Human Capital: a Theoretical and Empirical Analysis with Special Reference to Education. Columbia University Press.
Binder, M. 1999. Community Effects and Desired Schooling of Parents and Children in Mexico. Economics of Education Review. 18(3):311-325.
Buchmann, C. 2000. Family Structure, Parental Perceptions and Child Labour in Kenya: What Factors Determine Who is Enrolled in School? Social Forces. 78(4):1349-78. Baschieri, A, and Falkingham, J. 2005. Developing a poverty map of Tajikistan: a
technical note. Southampton Statistical Sciences Research Institute (S3RI)
Applications and Policy Working Papers, A05/11. UK: University of Southampton.
http://eprints.soton.ac.uk/19128/
Baschieri, A, and Falkingham, J. 2007. Child Poverty in Tajikistan. Dushanbe, UNICEF Tajikistan Country Office.
Brown, J., N.J. Madise, and Steel, D. 2002. ‘Accounting for Sample Design in Multilevel Models.’ Paper presented at the Population Association of America Annual
Conference, Atlanta 9-11 May 2002.
Canagarajah, S. Coulombe, H. 1997. Child Labor and Schooling in Ghana. The World Bank Working Paper Series. N. 1844. Washington D. C. The World Bank.
Chernichovsky, D. 1985. Socioeconomic and Demographic Aspects of School Enrolment and Attendance in Rural Botswana”. Economic Development and Cultural Change. 33(2): 319-332.
Elbers, C., Lanjouw, J. O., Lanjouw, P. 2001. Micro-level estimation of poverty and inequalities. Econometrica. 71(1).
Falkingham, J. 2000. A Profile of Poverty in Tajikistan. ESRC Centre for the Analysis of Social Exclusion Discussion Paper, No. 39. London School of Economics.
Filmer, D. 2004. If You Build It, Will They Come? School Availability and School Enrolment in 21 Poor Countries. World Bank Policy Research Working Paper, 3340.
Glewwe, P. and Jacoby, H. 1994. Student Achievement and Schooling Choice in Low Income Countries. The Journal of Human Resources. 29(3): 843:864.
Goldstein, H., I. Rasbash, D. Plewis, D. Draper, W. Browne, M. Yang, G. Woodhouse, and M. Hearly. 1998. A user's guide to MlWin. London: Multilevel Model Project, Institute of Education, University of London.
Goldstein, H. 2003. Multilevel Statistical Methods. London: Arnold.
Handa, S. 2002. Raising Primary School Enrolment in Developing Countries: The Relative Importance of Supply and Demand. Journal of Development Economics. 63: 103-128.
Hermalin, A., Seltzer, J., Lin, C-H. 1982. Transitions in the Effect of Family Size on Female Educational Attainment: The Case of Taiwan. Comparative Education Review. (June):254-70.
Hill, M. Anne and E. M. King. 1993. “Women’s Education in Developing Countries: An Overview”, in E.M. King and M.A. Hill (eds) Women’s Education in Developing Countries: Barriers, Benefits and Policies. Baltimore: John Hopkins University Press. 1-50.
Hollander, D., 1998. In Vietnam, Small Family Size Means Better Education Among the Young, but Socioeconomic Factors are Key. International Family Planning Perspectives. 24 (3): 149-50.
IOM/PULSE, 2004. Children in Cotton Fields. International Organization of Migration and Education Reform Centre “Pulse”.
Nielsen, H. S., 1998. Child Labour and School Attendance: Two Joint Decision. The University of Aarhus Working Paper Series, 98-15. Denmark: The University of Aarhus. Centre for Labour Market and Social Research.
Knodel, J and Wongsith, M. 1991. Family Size and Children’s Education in Thailand: Evidence from a National Sample. Demography. 28(1): 119-31.
Knodel, J, Havanon, N., Sittitrai, W., 1990. Family Size and Education of Children in the Context of Rapid Fertility Decline. Population and Development Review, 16(1) 31-62.
Kondylis, F. and Manacorda, M. 2006. School Proximity and Child Labor Evidence from Rural Tanzania. Mimeo paper, LSE.
http://personal.lse.ac.uk/manacorm/dist_to_school.pdf
Lavy, V. 1996. School Supply Constraints and Children's Educational Outcomes in Rural Ghana. Journal of Developemnt Economics. 51(2).
Levinson, D., Moe, K.S. and Knaul, F. (2001). Young Education and Work in Mexico. World Development. 29(1):167-188.
Lloyd, C. B., Mensch, B. S., Clark, W. H. 1998. The Effects of Primary School Quality on the Educational Participation and Attainment of Kenyan Girls and Boys. Policy Research Division Working Paper No. 116. New York: Population Council.
Lloyd, C. B. and A. J. Gage-Brandon, 1994. High Fertility and Children’s Schooling in Ghana: Sex differences in Parental Contributions and Educational Outcomes. Population Studies, 48(2): 293-306.
Lloyd, C. and Blanc, A., 1996. Children’s Schooling in Sub-Saharan Africa: The Role of Fathers, Mothers, and Others. Population and Development Review. 22(2): 265-98. Lockheed, M. E. and Verspoor, A. M. 1991. Improving Primary Education in Developing
Countries. Oxford: Oxford University Press.
Ravallion, M. and Wodon, Q. 2000. Does Child Labour Displace Schooling? Evidence on Behavioural response to an Enrolment Subsidy. The Economic Journal. 110(462): 158.
Sathar, Z. and C. B. Lloyd. 1994. Who Gets Primary Schooling in Pakistan: Inequalities Among and Within families”. Pakistan Development Review. 33(2): 103-34.
Siddiqi, F. and Patrinos, H. 1995. Child Labor: Issues, Causes and Interventions. Human Resources and Operations Policy Working Paper 56. Washington, D.C.: World Bank.
UNDP. 2005. Human Development Report 2005. New York: UNDP.
UNICEF. 2005. The State of the World’s Children 2005. New York: UNICEF.
World Bank. 2005. Tajikistan Poverty Assessment Update. Washington D.C.: The World Bank.