3897 METHOD DEVELOPMENT AND VALIDATION OF RP-HPLC METHOD IN THE
DETECTION OF CEFDINIR IN BULK DRUG AND CAPSULE DOSAGE FORM
NDVR Saradhi 1 *, B Venkata Ramana 1, M Venkata Reddy 2
1Prabhath Institute of Pharmacy, Parnapally (v), Kurnool Dist, Andhra Pradesh
2Sree Dattha Institute of Pharmacy, Ibrahimpatnam, RR Dist, Telangana
*Corresponding author E-mail: [email protected]
ARTICLE INFO ABSTRACT
Key Words
Cefdinir, Isocratic RP-HPLC, UV-Visible detector, Method validation.
A simple, specific, accurate, rapid, inexpensive isocratic Reversed Phase – High Performance Liquid Chromatography (RP-HPLC) method was developed and validated for the quantitative estimation of Cefdinir in bulk and capsule dosage forms. RP-HPLC method was developed by using Develosil C18 column( 150×4.6mm,5µm).The mobile phase is composed of 0.05M phosphate buffer ( PH – 4.2 , adjusted with ortho phosphoric acid ) and acetonitrile (30:70v/v ). The flow rate was set to 0.8 mL/min. The responses were measured at 230nm using UV – Visible detector. The Retention time of Cefdinir was found to be 2.26 minutes. Linearity was established in the concentration range of 30 - 70µg/ml with correlation coefficient 0.999. The validation of the developed method was carried out for linearity, accuracy, precision, specificity and robustness. The developed method can be used for routine quality control analysis of Cefdinir in pharmaceutical capsule dosage form.
INTRODUCTION:
Cefdinir is an advanced generation, broad-spectrum Oral semi synthetic cephalosporin. Cefdinir is effective against gram positive and grand negative bacteria. It has been proven to effective for common bacterial infections of the ear, sinus, throat and skin.
Chemically, Cefdinir is 6R-[6α, 7β(Z)]-7-(2-amino-4-thiazolyl) hydroxyimino) acetyl] amino]-3-ethyl-8-oxo-5-Thia-1-azabicyclo-(4.2.0.)- Oct -2-one-2-carboxylic acid. The antibiotic has been approved for the treatment of community-acquired pneumonia, acute exacerbations of chronic bronchitis, acute maxillary sinusitis, treatment of respiratory and urinary tract infections, and for uncomplicated skin and skin structure infections. Thus, the third generation of cephalosporin is of great value
in medical treatment due to its broad spectrum bactericidal effect.
Structure:
Experimental:
Chemicals and reagents: The reference
sample of cefdinir standard was kindly supplied as gift sample by Aurabind Pharma, Hyderabad .Potassium dihydrogen ortho phosphate and ortho phosphoric acid were A.R. grade from SD fine chemicals limited, Mumbai. Methanol was A.R. grade from Loba chemicals, Mumbai. Acetonitrile was HPLC grade from Loba chemicals, Mumbai.
Chromatographic conditions: The
chromatographic separation was carried out
3898
using Develosil C18 column
(150mmΧ4.6mm, 5µ) as stationary phase with injection volume of 20µL.The mobile phase comprised of 0.05M potassium dihydrogen ortho phosphate (PH adjusted to 4.2 with ortho phosphoric acid) and Acetonitrile in the ratio of 30:70v/v at a flow rate of 1.0 mL/min and UV detection wavelength was 230nm.
Preparation of mobile phase:
0.05M phosphate buffer was prepared by dissolving 1.36g of potassium dihydrogen orthophosphate and 2.0mL of triethylamine(TEA) in 800mL distilled water. Adjust PH to 4.2 with ortho
phosphoric acid and add sufficient water to produce 1000mL.Filter the solution through 0.45µm membrane filter and sonicate to degas. The above prepared buffer and acetonitrile was mixed in the ratio of 30:70v/v.
Preparation of Standard solution:
Weigh accurately Cefdinir standard equivalent to 25mg of Cefdinir and transfer into 25ml volumetric flask, add 10ml of diluent, sonicate to dissolve and makeup to the volume with diluent. Pipette out 0.5ml of this solution into 10ml volumetric flask and dilute the volume up to the mark with diluent to obtain a concentration of 50 µg/ml. Filter the solution through 0.45µm nylon membrane filter.
Preparation of sample solution:
Weigh and finely powder 20 capsules (Adcef). Weigh capsule powder equivalent to 25mg of Cefdinir formulation and transfer into 25ml volumetric flask, add 10ml of diluent, sonicate for 15min and dilute to the volume up to the mark with diluent. Pipette out 0.5ml of this solution into 10ml volumetric flask and dilute the volume up to the mark with diluent to obtaining a concentration of 50 µg/ml. Filter the solution through 0.45µm nylon membrane filter.
Selection of detection wavelength:
The UV spectra of various diluted solutions of Cefdinir mobile phase were recorded using UV spectrophotometer. The
peak of maximum absorbance was observed at 230nm. This wavelength was used for detection of Cefdinir.
VALIDATION OF THE PROPOSED METHOD:
The developed method of analysis was validated as per the ICH for the parameters like system suitability, linearity, precision, accuracy and robustness.
System suitability:
System suitability was used to verify reproducibility of the chromatographic system. It is checked by repetitive injection of the drug solution at the concentration level 50µg/ml for Cefdinir to check the reproducibility of the system. At first the HPLC system was stabilized for 40 min. One blank followed by six replicates of a single calibration standard solution of Cefdinir was injected to check the system suitability. The parameters such as theoretical plates, peak asymmetry, retention time and parameters were taken and results were presented in table 2.
Linearity:
The linearity graphs were obtained over the concentration range of 30-70µg/ml of Cefdinir. The representative chromatograms indicating the Cefdinir were shown in Fig. 5to 9. A calibration curve was plotted between concentration and area response and statistical analysis of the calibration curve is shown in fig.9.
Precision:
Intra-day and inter-day precision study of Cefdinir was carried out by estimating corresponding responses 3 times on the same day and on 3 different days for the concentration of 50μg. The percent relative standard deviation (% RSD) was calculated which is within the acceptable criteria of not more than 2.0. The results for intra-day and inter-day precision were presented in Table 6 and Table 7 respectively.
Accuracy:
3899
Fig 1: Detection of wavelength of Cefdinir
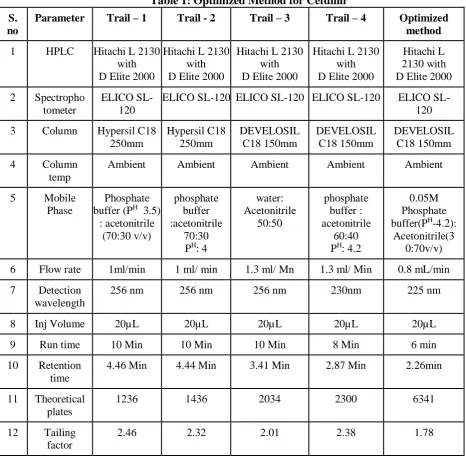
Table 1: Optimized Method for Cefdinir
S. no
Parameter Trail – 1 Trail - 2 Trail – 3 Trail – 4 Optimized
method
1 HPLC Hitachi L 2130 with D Elite 2000
Hitachi L 2130 with D Elite 2000
Hitachi L 2130 with D Elite 2000
Hitachi L 2130 with D Elite 2000
Hitachi L 2130 with D Elite 2000
2 Spectropho tometer
ELICO SL-120
ELICO SL-120 ELICO SL-120 ELICO SL-120 ELICO SL-120
3 Column Hypersil C18 250mm
Hypersil C18 250mm
DEVELOSIL C18 150mm
DEVELOSIL C18 150mm
DEVELOSIL C18 150mm
4 Column temp
Ambient Ambient Ambient Ambient Ambient
5 Mobile Phase
Phosphate buffer (PH 3.5)
: acetonitrile (70:30 v/v)
phosphate buffer :acetonitrile
70:30 PH: 4
water: Acetonitrile
50:50
phosphate buffer : acetonitrile
60:40 PH: 4.2
0.05M Phosphate buffer(PH-4.2):
Acetonitrile(3 0:70v/v)
6 Flow rate 1ml/min 1 ml/ min 1.3 ml/ Mn 1.3 ml/ Min 0.8 mL/min
7 Detection wavelength
256 nm 256 nm 256 nm 230nm 225 nm
8 Inj Volume 20µL 20µL 20µL 20µL 20µL
9 Run time 10 Min 10 Min 10 Min 8 Min 6 min
10 Retention time
4.46 Min 4.44 Min 3.41 Min 2.87 Min 2.26min
11 Theoretical plates
1236 1436 2034 2300 6341
12 Tailing factor
3900
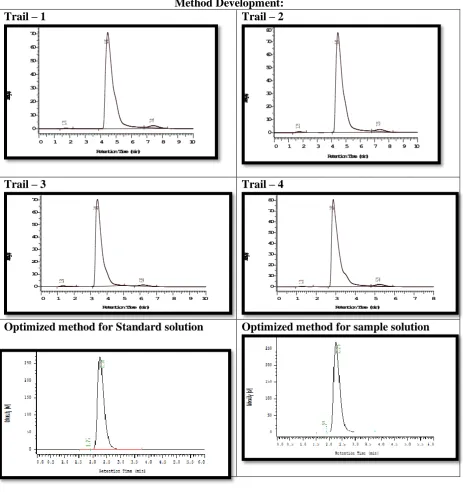
Method Development:
Trail – 1 Trail – 2
Trail – 3 Trail – 4
Optimized method for Standard solution Optimized method for sample solution
Results and Discussion:
Table 2: System suitability:
S. No Concentration Retention
time Peak area
Theoretical plates
Tailing factor
1 50 2.26 4371369 6320 1.01
2 50 2.26 4327048 6389 0.98
3 50 2.26 4372696 6366 0.99
4 50 2.26 4283857 6312 0.99
5 50 2.26 4340455 6353 0.96
6 50 2.26 4329302 6308 0.97
Avg 2.26 4339085 6341.333 0.98333
SD 0 36636.2 32.99495 0.01751
%RSD 0 0.84433 0.520316 1.78087
1.74
4.46
7.41
0 1 2 3 4 5 6 7 8 9 10
Retention Time (min) 0
10 20 30 40 50 60 70
Intensit
y (mV)
1.7
5
4.4
4
7.3
5
0 1 2 3 4 5 6 7 8 9 10
Retention Time (min) 0
10 20 30 40 50 60 70 80
Intensi
ty (mV)
1.34
3.41
6.18
0 1 2 3 4 5 6 7 8 9 10
RetentionTime(min) 0
10 20 30 40 50 60 70
Intensity
(mV)
1.31
2.87
5.23
0 1 2 3 4 5 6 7 8
RetentionTime(min) 0
10 20 30 40 50 60 70 80
Intensity
3901
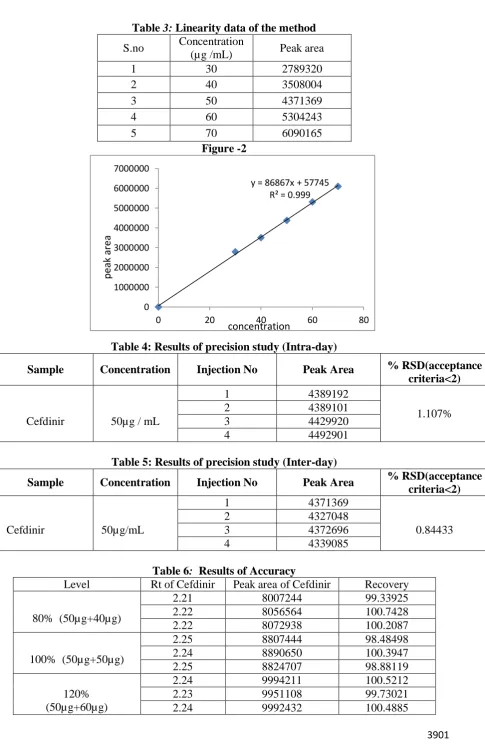
Table 3: Linearity data of the method
S.no Concentration
(µg /mL) Peak area
1 30 2789320
2 40 3508004
3 50 4371369
4 60 5304243
5 70 6090165
Figure -2
Table 4: Results of precision study (Intra-day)
Sample Concentration Injection No Peak Area % RSD(acceptance
criteria<2)
1 4389192
1.107%
2 4389101
Cefdinir 50µg / mL 3 4429920
4 4492901
Table 5: Results of precision study (Inter-day)
Sample Concentration Injection No Peak Area % RSD(acceptance
criteria<2)
1 4371369
2 4327048
Cefdinir 50µg/mL 3 4372696 0.84433
4 4339085
Table 6: Results of Accuracy
Level Rt of Cefdinir Peak area of Cefdinir Recovery
80% (50µg+40µg)
2.21 8007244 99.33925
2.22 8056564 100.7428
2.22 8072938 100.2087
100% (50µg+50µg)
2.25 8807444 98.48498
2.24 8890650 100.3947
2.25 8824707 98.88119
120% (50µg+60µg)
2.24 9994211 100.5212
2.23 9951108 99.73021
2.24 9992432 100.4885
y = 86867x + 57745 R² = 0.999
0 1000000 2000000 3000000 4000000 5000000 6000000 7000000
0 20 40 60 80
concentration
p
eak
3902
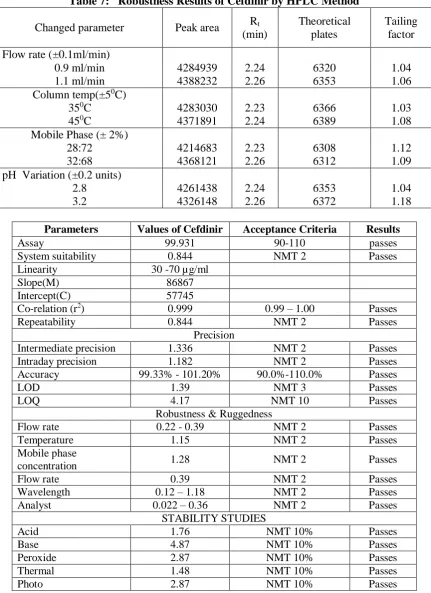
Table 7: Robustness Results of Cefdinir by HPLC Method
Changed parameter Peak area Rt (min)
Theoretical plates
Tailing factor
Flow rate (±0.1ml/min) 0.9 ml/min 1.1 ml/min
4284939 4388232
2.24 2.26
6320 6353
1.04 1.06 Column temp(±50C)
350C 450C
4283030 4371891
2.23 2.24
6366 6389
1.03 1.08 Mobile Phase (± 2%)
28:72 32:68
4214683 4368121
2.23 2.26
6308 6312
1.12 1.09 pH Variation (±0.2 units)
2.8 3.2
4261438 4326148
2.24 2.26
6353 6372
1.04 1.18
Parameters Values of Cefdinir Acceptance Criteria Results
Assay 99.931 90-110 passes
System suitability 0.844 NMT 2 Passes
Linearity 30 -70 µg/ml
Slope(M) 86867
Intercept(C) 57745
Co-relation (r2) 0.999 0.99 – 1.00 Passes
Repeatability 0.844 NMT 2 Passes
Precision
Intermediate precision 1.336 NMT 2 Passes
Intraday precision 1.182 NMT 2 Passes
Accuracy 99.33% - 101.20% 90.0%-110.0% Passes
LOD 1.39 NMT 3 Passes
LOQ 4.17 NMT 10 Passes
Robustness & Ruggedness
Flow rate 0.22 - 0.39 NMT 2 Passes
Temperature 1.15 NMT 2 Passes
Mobile phase
concentration 1.28 NMT 2 Passes
Flow rate 0.39 NMT 2 Passes
Wavelength 0.12 – 1.18 NMT 2 Passes
Analyst 0.022 – 0.36 NMT 2 Passes
STABILITY STUDIES
Acid 1.76 NMT 10% Passes
Base 4.87 NMT 10% Passes
Peroxide 2.87 NMT 10% Passes
Thermal 1.48 NMT 10% Passes
Photo 2.87 NMT 10% Passes
The recovery studies were carried out in the capsule in triplicate each in the presence of placebo. The mean percentage recovery of Cefdinir at each level was not less than 99% and not more than 101%. The results were presented in Table 8.
Robustness:
3903
composition (±2%), column temperature (± 50 C). The results were presented in Table 9.
Limit of detection:
Limit of detection is the lowest quantity of a substance that can be distinguished from the absence of that substance (a blank value) within a stated confidence limit (generally 1%) . the limit of detection estimated from the mean of blank, the standard deviation of blank and some confidence factor. whose concentration is not greater than 3.
Limit of Quantification:
Limit of Quantification is the lowest concentration at which analyte can not only be detected but at which some predefined goals for bias and imprecision are met. LoQ may be equivalent to LOD or it may be higher concentration. Whose value is not greater than 10
RESULTS AND DISCUSSION
The mobile phase consisting of 0.05M phosphate buffer (pH-4.2): acetonitrile (30:70% v/v at 0.8 mL/min flow rate was optimized which gave sharp peak, minimum tailing factor with short runtime for Cefdinir. The retention time for Cefdinir was 2.26min. UV spectra of Cefdinir showed that the drug absorbed maximum at 230 nm, so this wavelength was selected as the detection wavelength. All validation parameters for optimized chromatographic conditions are satisfied the ICH Guidelines.
CONCLUSION
A New validated RP-HPLC method has been developed for the quantitative determination of Cefdinir in bulk and pharmaceutical capsule dosage forms. Statistical analysis of the results shows that the proposed procedure has good precision and accuracy. The method was completely validated shows satisfactory results for all the method validation parameters tested and method was free from interference of the other active ingredients and additives used in the formulation. In fact, results of the study indicate that the developed method was found to be simple, reliable, accurate, linear, sensitive, economical, and reproducible and have short run time which makes the method rapid. Hence it can be concluded that this method may be employed for the routine
quality control analysis of Cefdinir in active pharmaceutical ingredient (API) and pharmaceutical capsule preparations.
REFERENCES:
1. Guay DRP.Cefdinir: An advanced – generation, broad – spectrum oral cephalosporin. Clinical therapeutics 2002; 24:473-489
2. DrehoblM, Comparison of cefdinir and cefaclor in treatment of
community –
acquirdpneumonia.Antimicrob Agents Chemother.1997; 41:1579-1583.[pubmed].
3. Tack , Cefdinir versus cephalexin for the treatment of skin and skin structure infections in adults. Clin Ther.1998; 20:244-256
4. USP-NF. The official compendia of standards.vol.3.Baltimore, US: The united states Pharmacopoeia Convention. City press; 2007.pp.1826-1827.
5. Tawara, Matsumoto, Matsumoto Y , Kamimura T , Goto S. Structure-binding relationship and Structure-binding sites of cephalosporins in human serum albumin. J Antibiotic.1992; 45:1346-1357
6. Chatterjee, Cefdinir: An oral alternative to parentral cephems.2005; 51:259-264.
7. Sethi , HPLC Quantitative Analysis Pharmaceutical Formulations, CBS Publishers and distributors, New Delhi, 2001: 7-22, 38-43, 94-105. 8. Snyder R, Kirkland J, Glajch L,
Practical HPLC Method Development, john Wiley and sons International publication, II Edn., 2011.
9. Ashutoshkar, Pharmaceutical Drug Analysis 2nd Edn, New Age International Private Limited Publishers, 2005: 452-474.
3904
11.Williard H.H , Merit ,Dean L.L, Settle F.A., Instrumental Methods Of Analysis, 6th Edn, C.B.S. Publishers and Dis tributors., New Delhi.: 430-440, 495-504,529-545.
12. Sharma B.K, Instrumental Methods of Chemical Analysis. GOEL Publishing House, Meerut: 286-300. 13.Gurdeep R. Chatwal, Sham K.
Anand, Instrumental methods of Chemical Analysis,5th edition, Himalaya Publishing House(Mumbai),2005, P-2.566 14.Feidmon. Validation of
bio-analytical methods. AAPS PharmSciTech 2004; 5(1): 57-68 15.Frank T. Peters, Hans H. Maurer.
bioanalytical method validation. pharmaceutical methods. AAPS PharmSciTech 2004; 5(1): 106-118. Article 22 (www.pharmscitech.org). 16.International Conference on
Harmonization, Harmonized Tripartite Guideline. Validation of Analytical Procedures. Text and Methodology. Q2 (R1). November 2005. See www.ICH.org.
17.International Conference on Harmonization (ICH). Validation of Analytical Methods: Definitions and Terminology. ICH Q2A. 1994. 18.International Organization for
Standardization. Accuracy (Trueness and Precision) of Measurement Methods and Results. ISO/DIS-5725-1 to 5725-3. 1994.
19.Srinivasa Rao Narala and K.Saraswathi, “RP- HPLC Methods for the Determination of Cephalosporins (Cefditoren Pivoxil and Cefdinir) in Pharmaceutical Dosage Forms”. Journal of pharmaceutical sciences and research, Vol. 3(1), 2011, Pg.No 1002 – 1004.