S t a t i s t i c s i n f o c u s
Agriculture and fisheries
Authors: Maria BERGUA, Marketa MACKOVA,
Pol MARQUER
50/2008
Farm structure in Poland - 2007
52% of agricultural land and 56% of livestock in farms of less than 20 ha
This Statistics in Focus is the first of a series of country-specific publications on the results of the Farm
Structure Survey (FSS) 2007. It provides a brief but nevertheless comprehensive insight into the farm
structure in Poland.
* * *
2.4 million agricultural holdings were recorded in
Poland through the 2007 Farm structure survey
(3.5% less than in 2005). This drop results mainly
from a fall in the number of the smallest holdings
which are not covered by the Single area payment
system. The number of farms using less than 2 ha
decreased from 84 000 in 2005 to 74 000 in 2007
(-12%).
* * *
Due to the different coverage of the FSS across
Member States, the total number of farms is not
comparable between countries. This is why the
present analysis, including Tables 1-4 and the
graphs focus on holdings of at least one ESU. See
the methodological notes for more information on
the concept of ESU.
In 2007, about
1.13 million agricultural holdings
had an economic size of at least 1 ESU, compared
to 1.08 million in 2005.
̇ They made use of
13.9 million ha of utilised
agricultural area
, which is on average 12.3 ha
per holding (compared to 12.1 ha in 2005);
̇ These holdings employed
1.7 million AWUs
(annual work units), the equivalent of 1.7 million
people working full time;
̇ They
had
10.7 million livestock units
(LSU) in
2007, 6% more than in 2005, mainly due to an
increase in bovine animals.
Amongst these 1.13 million agricultural holdings:
- 29% made use of less than one AWU, while
another 29% made use of 2 or more AWUs;
- 35% used less than 5 ha, while 2% used 50 ha
or more;
- 20% were producing mainly for own
consumption;
- 38% were holdings of the type mixed cropping;
- 36% were engaged in mixed livestock;
- 26% were mixed farms.
Amongst the sole holders:
- 23% were women in 2007, (compared to 22% in
2005);
- 23% were aged 55 or more, and 17% were
younger than 35 years;
- 32% of family labour force had another gainful
activity in 2007 (compared to 29% in 2005);
- Family labour force regularly employed has
increased, on the contrary to non family labour
force.
In Poland in 2007, 77% of the agricultural area was
owned by farmers (more than 90% in the holdings
with less than 20 hectares).
145 240 ha were organically farmed (1% of the
utilised agricultural area, compared to 0.6% in
2005).
Distribution of the utilised agricultural area
0 500 1000 1500 2000 2500 3000
<5 5-<10 10-<20 20-<30 30-<50 50-<200 >=200
Agricultural area size class (ha) 1000 ha
2005 2007
Description of the labour force in Poland
Non Family labour force 115770 AWUs
Agricultural labour force
Family labour force 2770110 persons of which 45% women 1622670 AWUs
Working full time 428040 persons
Working part time 692340 persons
Not working on farm 4390 persons
Working full time 79400 persons
Working part time 821350 persons
Working full time 43720 persons
Working part time 16170 persons Working full time
179540 persons
Working part time 565050 persons
Other family members
900750 persons of which 44% women 354720 AWUs
… regular
59890 persons of which 26% women 52580 AWUs
Holders
1124780 persons of which 23% women 798640 AWUs23
Spouses of the sole holders 744590 persons of which 80% women 469310 AWUs
… non regular 63190 AWUs
Distribution of the number of livestock units
0 1000 2000 3000 4000 5000 6000
<5 5-<50 50-<100 100-<500 >=500
Size class (LSUs*) 1000 LSUs
Poland – 2007
Table 1 – Labour force by size of the farms
Agricultural area (ha) All Livestock (LSU*) <5 5-<20 20-<50 >=50 farms 0 >0-<5 5-<50 >=50
484.3 959.7 206.7 87.7 1738.4 228.6 691.7 731.3 86.9
957.1 1497.7 262.3 53.1 2770.1 398.5 1277.1 1029.9 64.6
1000 annual work units 469.6 923.2 190.7 39.3 1622.7 179.3 677.9 714.6 50.9
6.1 6.6 5.2 42.0 59.9 21.8 2.0 3.2 32.9
5.2 5.3 4.1 38.0 52.6 18.4 1.4 2.7 30.0
9.5 31.2 11.9 10.5 63.2 30.8 12.4 14.0 6.0
1000 391.3 612.1 101.1 23.6 1128.1 205.6 508.0 389.9 24.6
(%) 31.2 19.4 9.5 7.0 22.3 25.0 28.1 14.3 7.1
- part-time: - under 50 % (%) 39.6 22.2 9.7 9.0 26.9 54.2 31.0 8.5 2.9
- part-time: - 50 % and over (%) 40.7 33.9 17.9 16.0 34.4 24.3 43.4 29.4 12.6
1000 391.1 611.7 100.8 21.2 1124.8 203.6 508.0 389.7 23.5
32.0 20.3 9.9 7.5 23.2 26.2 29.3 14.7 7.7
(%)
- under 35 years 13.3 18.3 20.3 20.4 16.8 15.8 15.0 19.3 20.3
- from 35 to 44 years 22.1 26.3 29.4 29.2 25.2 24.2 23.3 27.8 29.5
- from 45 to 54 years 31.5 36.4 36.9 36.2 34.7 35.7 32.3 37.2 36.6
- from 55 to 64 years 19.3 13.8 11.0 12.4 15.4 17.0 17.2 12.5 11.9
- 65 years and over 13.8 5.3 2.3 1.8 7.9 7.3 12.1 3.1 1.7
- part-time: - under 50 % (%) 39.6 22.2 9.8 10.0 26.9 54.7 31.0 8.5 3.0
- part-time: - 50 % and over (%) 40.8 33.9 18.0 17.8 34.5 24.6 43.4 29.5 13.2
(%) 40.1 29.9 14.4 15.0 31.7 47.9 36.6 18.6 6.9
- as a main occupation 32.1 21.6 8.9 8.6 23.8 38.6 27.9 12.1 3.5
- as a subsidiary occupation 8.1 8.3 5.5 6.4 7.9 9.2 8.7 6.5 3.4
1000 253.4 400.5 75.1 15.6 744.6 110.9 331.7 282.5 19.5
(%) 71.8 82.6 92.8 94.3 80.2 76.5 74.4 87.4 94.7
(%)
- under 35 years 14.3 19.5 23.6 23.1 18.2 17.3 16.1 20.8 23.0
- from 35 to 54 years 59.1 67.6 69.0 69.1 64.9 65.5 60.5 69.3 69.8
– 55 years and over 26.6 13.0 7.4 7.8 16.9 17.1 23.4 9.9 7.2
- part-time: - under 50 % (%) 49.9 32.8 20.3 24.4 37.2 60.3 44.2 21.5 14.0
- part-time: - 50 % and over (%) 36.6 39.9 39.5 38.0 38.7 23.1 39.7 43.6 39.4
(%) 38.8 27.0 14.3 16.7 29.6 47.4 34.2 18.4 9.4
1000 312.6 485.5 86.4 16.3 900.8 84.0 437.4 357.7 21.6
(%) 45.1 44.3 40.5 36.1 44.1 41.7 45.1 43.7 37.7
- part-time: - under 50 % (%) 75.5 66.3 55.1 50.4 68.2 71.7 73.9 61.7 46.3
- part-time: - 50 % and over (%) 19.8 24.4 26.8 25.1 23.0 18.7 20.9 26.3 27.5
(%) 30.1 20.3 11.7 10.9 22.7 24.5 27.4 17.4 8.6
Size of the farms
- with another gainful activity1
- women
–distribution by age - women
–distribution by age
Sole/main holders
1000 persons
- with another gainful activity - with another gainful activity
Other members of the holder’s family working on the holding Holding managers
Non regular non family labour force Total labour force
- women
1000 annual work units
- women
Family labour force
Non-family labour regularly employed
1000 annual work units
1000 annual work units
Spouse of sole holder
1000 persons
*LSU = Livestock Unit
1
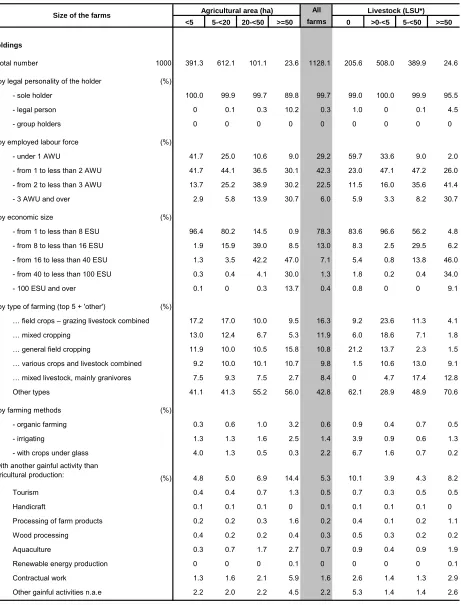
Poland – 2007
Table 2 – Agricultural holdings by size
"0" less than half of the unit or nil
All
<5 5-<20 20-<50 >=50 farms 0 >0-<5 5-<50 >=50
1000 391.3 612.1 101.1 23.6 1128.1 205.6 508.0 389.9 24.6
(%)
- sole holder 100.0 99.9 99.7 89.8 99.7 99.0 100.0 99.9 95.5
- legal person 0 0.1 0.3 10.2 0.3 1.0 0 0.1 4.5
- group holders 0 0 0 0 0 0 0 0 0
(%)
- under 1 AWU 41.7 25.0 10.6 9.0 29.2 59.7 33.6 9.0 2.0
- from 1 to less than 2 AWU 41.7 44.1 36.5 30.1 42.3 23.0 47.1 47.2 26.0
- from 2 to less than 3 AWU 13.7 25.2 38.9 30.2 22.5 11.5 16.0 35.6 41.4
- 3 AWU and over 2.9 5.8 13.9 30.7 6.0 5.9 3.3 8.2 30.7
- by economic size (%)
- from 1 to less than 8 ESU 96.4 80.2 14.5 0.9 78.3 83.6 96.6 56.2 4.8
- from 8 to less than 16 ESU 1.9 15.9 39.0 8.5 13.0 8.3 2.5 29.5 6.2
- from 16 to less than 40 ESU 1.3 3.5 42.2 47.0 7.1 5.4 0.8 13.8 46.0
- from 40 to less than 100 ESU 0.3 0.4 4.1 30.0 1.3 1.8 0.2 0.4 34.0
- 100 ESU and over 0.1 0 0.3 13.7 0.4 0.8 0 0 9.1
(%)
… field crops – grazing livestock combined 17.2 17.0 10.0 9.5 16.3 9.2 23.6 11.3 4.1
… mixed cropping 13.0 12.4 6.7 5.3 11.9 6.0 18.6 7.1 1.8
… general field cropping 11.9 10.0 10.5 15.8 10.8 21.2 13.7 2.3 1.5
… various crops and livestock combined 9.2 10.0 10.1 10.7 9.8 1.5 10.6 13.0 9.1
… mixed livestock, mainly granivores 7.5 9.3 7.5 2.7 8.4 0 4.7 17.4 12.8
Other types 41.1 41.3 55.2 56.0 42.8 62.1 28.9 48.9 70.6
(%)
- organic farming 0.3 0.6 1.0 3.2 0.6 0.9 0.4 0.7 0.5
- irrigating 1.3 1.3 1.6 2.5 1.4 3.9 0.9 0.6 1.3
- with crops under glass 4.0 1.3 0.5 0.3 2.2 6.7 1.6 0.7 0.2
(%) 4.8 5.0 6.9 14.4 5.3 10.1 3.9 4.3 8.2
Tourism 0.4 0.4 0.7 1.3 0.5 0.7 0.3 0.5 0.5
Handicraft 0.1 0.1 0.1 0 0.1 0.1 0.1 0.1 0
Processing of farm products 0.2 0.2 0.3 1.6 0.2 0.4 0.1 0.2 1.1
Wood processing 0.4 0.2 0.2 0.4 0.3 0.5 0.3 0.2 0.2
Aquaculture 0.3 0.7 1.7 2.7 0.7 0.9 0.4 0.9 1.9
Renewable energy production 0 0 0 0.1 0 0 0 0 0.1
Contractual work 1.3 1.6 2.1 5.9 1.6 2.6 1.4 1.3 2.9
Other gainful activities n.a.e 2.2 2.0 2.2 4.5 2.2 5.3 1.4 1.4 2.6
Size of the farms Agricultural area (ha) Livestock (LSU*)
- with another gainful activity than agricultural production:
Holdings
- total number
- by legal personality of the holder
- by employed labour force
- by type of farming (top 5 + 'other')
- by farming methods
[image:4.595.73.534.95.700.2]Poland – 2007
Table 3 – Land use by size of the farms
"0" less than half of the unit or nil
All
<5 5-<20 20-<50 >=50 farms 0 >0-<5 5-<50 >=50
(1000 ha)
1522.5 6833.7 3220.0 4186.2 15762.4 3462.5 3703.4 6379.3 2217.3
296.6 888.8 295.3 426.1 1906.9 524.6 549.0 668.9 164.3
156.5 513.3 156.8 96.1 922.6 165.9 314.3 391.2 51.2
1225.9 5944.9 2924.7 3760.0 13855.6 2937.9 3154.4 5710.4 2052.9
823.4 4421.2 2261.3 3192.1 10698.0 2302.2 2369.0 4298.8 1728.0
587.5 3411.6 1636.0 2048.6 7683.6 1505.0 1792.2 3261.5 1124.8
Common wheat and spelt 145.9 645.3 394.8 764.2 1950.2 585.2 448.6 583.0 333.3
Durum wheat 0 0 0 0 0 0 0 0 0
Rye 97.4 685.7 232.9 254.1 1270.0 226.8 352.6 574.6 116.0
Barley 78.2 458.4 270.3 355.2 1162.0 237.8 243.7 471.0 209.5
Oats 176.2 1010.3 400.7 217.1 1804.3 189.7 477.0 978.0 159.5
Grain maize 6.3 28.9 28.2 182.8 246.2 102.6 26.1 32.4 85.2
11.6 55.5 27.3 31.6 126.1 29.9 36.6 45.6 14.1 100.1 334.2 153.9 161.5 749.8 144.3 198.9 320.2 86.3
Potatoes 89.6 247.7 78.6 54.9 470.8 89.2 160.9 198.5 22.3
Sugar beet 4.1 69.8 70.2 103.1 247.2 50.8 29.1 105.0 62.4
Fodder root 6.3 16.7 5.1 3.5 31.7 4.4 8.9 16.7 1.7
20.0 136.8 136.1 561.6 854.6 322.0 118.9 173.2 240.5
Tobacco 4.2 11.4 1.5 0.4 17.5 2.7 8.5 6.2 0.1
Hops 0 0 0 0 0 0 0 0 0
Cotton 0 0 0 0 0 0 0 0 0
Rape and turnip 11.2 105.2 125.9 543.3 785.6 298.8 96.5 154.9 235.4
Sunflower 0 0 0 0 0 0 0 0 0
Soya 0 0 0 0 0 0 0 0 0
37.7 111.2 36.4 33.4 218.6 91.6 69.8 47.1 10.1
outside 35.2 107.9 36.1 33.3 212.5 88.0 68.0 46.4 10.1
under glass 2.5 3.3 0.2 0.1 6.1 3.7 1.7 0.7 0
2.4 0.9 0.2 0.5 4.0 2.9 1.0 0.1 0.1
outside 1.3 0.6 0.2 0.5 2.6 1.6 0.9 0.1 0.1
under glass 1.1 0.3 0 0 1.4 1.3 0.1 0 0
39.4 273.9 236.5 233.6 783.4 57.7 86.5 405.7 233.5 17.2 79.9 23.1 103.5 223.6 130.0 53.3 27.6 12.8
9.4 14.9 2.7 1.6 28.5 4.0 13.4 9.6 1.4
301.7 1328.9 625.5 532.6 2788.7 418.6 681.8 1370.3 318.0
91.4 180.0 35.2 33.7 340.4 213.1 90.2 31.6 5.5
Fruit and berry plantation 85.9 173.9 32.4 30.0 322.1 201.1 85.3 30.6 5.2 Citrus plantation 0 0 0 0 0 0 0 0 0
Olive trees 0 0 0 0 0 0 0 0 0
Vineyard 0 0 0 0 0 0 0 0 0
(ha) 3.1 9.7 28.9 159.4 12.3 14.3 6.2 14.6 83.3
(%)
91.6 90.1 76.9 52.7 77.3 68.8 87.6 83.5 56.3 43.2 52.9 53.8 46.6 50.5 42.0 47.8 56.4 50.5
0.3 0.6 1.0 2.1 1.0 1.9 0.6 0.9 0.9
0.3 0.4 0.5 0.7 0.5 1.4 0.3 0.2 0.5
... organic farmed ... irrigated
Area
Agricultural area per holding
Agricultural area...
... own farmed
... in less favoured or mountain area
- E. Kitchen garden
Fresh vegetables, melons, strawberry
- G. Permanent crops
Ratios
Flower and ornamental plants
Forage plants Fallow land
- F. Permanent pasture and meadows
Cereals
Dried pulses Root crops
Industrial crops
- D. Arable land
Livestock (LSU*) Agricultural area (ha)
Total area of agricultural holdings
· H. Other area
Wooded area
· Agricultural area
Size of the farms
Poland – 2007
Table 4 – Livestock by size of the farms
":" not available
"0" less than half of the unit or nil
Agricultural area (ha) All Livestock (LSU) <5 5-<20 20-<50 >=50 farms 0 >0-<5 5-<50 >=50
(1000 LSU) 1407.5 4621.1 2661.5 2052.2 10742.4 0 1150.2 5656.1 3936.1
of which grazing (%) 29.7 47.5 51.6 34.2 43.7 : 51.4 56.5 22.9
(1000 heads)
71.4 144.9 34.8 27.1 278.3 0 91.8 164.7 21.8
435.0 2688.1 1731.2 891.4 5745.7 0 638.4 3951.1 1156.3
Under 1 year 97.5 717.1 431.4 235.8 1481.8 0 160.7 1022.2 298.8
From 1 to less than 2 years 71.0 579.0 398.3 201.0 1249.3 0 100.2 878.0 271.1
Dairy cows 254.3 1275.8 800.9 358.1 2689.2 0 359.0 1854.2 476.0
Other cows 0.8 10.6 13.4 31.5 56.3 0 1.2 25.0 30.2
Other bovine animals 2 years and older 11.4 105.6 87.3 64.8 269.1 0 17.4 171.7 80.1
40.0 112.3 67.6 72.7 292.6 0 34.5 203.6 54.5
33.7 33.7 9.4 5.5 82.3 0 49.3 27.5 5.6
(1000 heads) 1352.9 8266.6 4477.9 4246.0 18343.3 0 1721.8 9778.3 6843.2
Piglets < 20 kg 421.2 2816.7 1339.8 1249.5 5827.2 0 721.0 3230.9 1875.2
Breeding sows 153.3 846.4 413.7 392.8 1806.3 0 202.6 997.2 606.5
Other pigs 778.4 4603.4 2724.5 2603.6 10709.9 0 798.2 5550.1 4361.5
(million heads) 61.0 42.5 18.0 24.6 146.1 0 12.7 13.2 120.2
Broilers 36.8 22.7 10.8 12.5 82.8 0 3.5 3.8 75.5
Laying hens 20.2 13.3 4.0 7.1 44.5 0 6.8 6.6 31.1
Other poultry 4.1 6.5 3.2 5.1 18.9 0 2.4 2.8 13.6
(1000 heads) 329.1 205.9 24.7 5.7 565.4 0 405.4 154.8 5.3
(1000) 329.7 159.0 24.6 6.3 519.6 204.9 220.0 90.4 4.3
(head/holding)
Equidae (head/holding) 1.6 2.4 4.4 13.1 2.4 : 1.4 3.2 11.4
Cattle (head/holding) 2.4 7.3 25.0 86.6 9.1 : 2.2 12.1 79.2
Dairy cows (head/holding) 1.5 3.8 12.7 41.5 4.7 : 1.4 6.1 37.3
Other cows (head/holding) 1.7 3.0 6.5 31.4 8.0 : 1.3 4.7 34.7
Sheep (head/holding) 11.7 24.5 58.2 162.0 30.5 : 7.8 40.9 236.0
Goats (head/holding) 3.0 3.1 8.1 17.1 3.5 : 2.9 4.2 19.9
Pigs (head/holding) 7.8 23.9 77.4 458.6 31.3 : 6.4 32.6 426.8
Breeding sows (head/holding) 2.1 3.4 8.8 52.8 4.8 : 1.7 4.1 45.7
Other pigs > 20 kg (head/holding) 5.5 15.7 51.0 291.4 21.5 : 3.8 20.3 275.8
Rabbits, breeding females (head/holding) 7.3 4.9 5.1 9.1 6.1 : 6.6 5.1 7.1
Laying hens (1000/holding) 0.1 0 0.1 0.9 0.1 : 0 0 2.6
Broilers (1000/holding) 0.3 0.1 0.3 2.5 0.2 : 0 0 9.3
Beehives (hive/holding) 29.7 14.4 9.8 17.2 20.8 52.0 17.6 11.0 14.1
Poultry
Rabbits, breeding females
Beehives
Average size of herds* Bovine animals
Sheep
Goats
Pigs Granivores Total livestock
Grazing livestock
Equidae
Size of the fram
Poland
–
2007
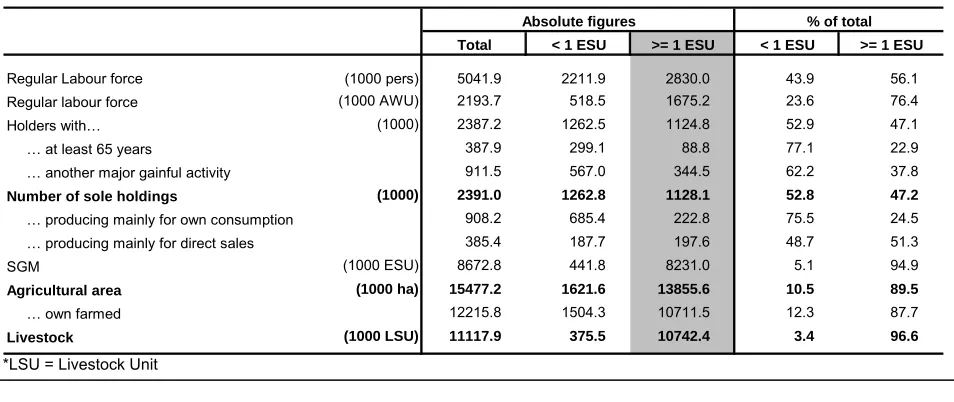
Table
5
–
Subsistence
farming
(1000 pers) 5041.9 2211.9 2830.0 43.9 56.1
(1000 AWU) 2193.7 518.5 1675.2 23.6 76.4
(1000) 2387.2 1262.5 1124.8 52.9 47.1
… at least 65 years 387.9 299.1 88.8 77.1 22.9
… another major gainful activity 911.5 567.0 344.5 62.2 37.8
(1000) 2391.0 1262.8 1128.1 52.8 47.2
… producing mainly for own consumption 908.2 685.4 222.8 75.5 24.5
… producing mainly for direct sales 385.4 187.7 197.6 48.7 51.3
(1000 ESU) 8672.8 441.8 8231.0 5.1 94.9
(1000 ha) 15477.2 1621.6 13855.6 10.5 89.5
… own farmed 12215.8 1504.3 10711.5 12.3 87.7
(1000 LSU) 11117.9 375.5 10742.4 3.4 96.6
Livestock
Regular labour force
Holders with…
Number of sole holdings
SGM
< 1 ESU >= 1 ESU % of total
Agricultural area
Absolute figures
Regular Labour force
Total < 1 ESU >= 1 ESU
*LSU = Livestock Unit