Mikkel Barslund is Research Fellow and Lars Ludolph is Researcher in the Economic Policy unit at CEPS. This research was funded by the Belgian Federal Science Policy Office (BELSPO) in the context of the Bel-Ageing Project. Correspondence may be addressed to: Lars Ludolph ([email protected]). The authors thank Matthias Busse, Daniel Gros and Willem Pieter De Groen for helpful suggestions and comments. The authors are responsible for all errors and omissions. CEPS Working Documents give an indication of work being conducted within CEPS’ research programmes and aim to stimulate reactions from other experts in the field. The opinions expressed in this document are the sole responsibility of the authors and do not necessarily represent the official position of CEPS.
978-94-6138-611-3
Available for free downloading from the CEPS website (www.ceps.eu) © CEPS 2017
Could the decrease in Belgian
government debt-servicing costs offset
increased age-related expenditure?
Mikkel Barslund and Lars Ludolph
No. 2017/06, June 2017
Abstract
1. Introduction ... 1
2. Savings, investment and the real rate of interest... 2
3. Secular drivers of savings and investment ... 4
3.1 Desired savings ... 4
Population ageing ... 4
Within-country income inequality... 5
Savings in emerging markets and Chinese financial market integration ... 6
3.2 Desired investment ... 8
Rise in the spread between the risk-free rate and the cost of capital ... 8
Relative price of capital goods ... 8
Reduced profitability of investment ... 8
Public investment decline in advanced economies ... 9
Monetary policy ... 9
4. The effect of persistently low real interest rates on public finances: The case of Belgium ...10
4.1 Belgium’s government debt maturity profile ...14
4.2 Can decreased debt-servicing costs offset increased age-related expenditure? ...15
5. Conclusion ...16
References ...17
Appendix ...20
List of Figures and Tables Figure 1. Global savings, investment and real interest ... 3
Figure 2. Gini coefficient of income inequality in the US and the OECD (average value of all OECD members) ... 6
Figure 3. Savings rates in emerging markets and developing countries (percentage of GDP) 1980-2020 ... 6
Figure 4. The equity risk premium, 2000-16 ... 7
Figure 5. Belgian general government net debt interest payments (percent of GDP) ...11
Figure 6. Weighted average fixed coupon on Belgian non-treasury bill debt maturing in the indicated years 2016-2030 (lhs) and savings on coupon payments as a percentage of GDP under a no-interest-rate-change assumption. 2016-2030 ...12
Figure 7. Historical and forecast aggregate savings on Belgian government net debt coupon payments, 2016-30 (percent of GDP)...13
Figure 8. Weighted average maturity of total Belgian government debt, in years ...14
Figure 9. Disaggregated changes in age-related expenditure in Belgium with base year 2013 as a percent of GDP, 2013-2030 ...16
Table 1. Selected European governments and their potential to save further on debt servicing costs ...10
Figure A1. Annual growth of CPI inflation in Belgium, 1986-2016 ...20
Figure A2. Belgian secondary market government bond yields (07/05/2017) and Belgian y-o-y CPI inflation (03/2017) (percent) ...20
Figure A3. Overall change in age-related expenditure by 2020 and 2030 in Belgium (base year 2013) ...21
1
Could the decrease in Belgian government
debt-servicing costs offset increased
age-related expenditure?
Mikkel Barslund and Lars Ludolph
CEPS Working Document No. 2017/06, June 2017
1. Introduction
One of the key stylised facts of advanced economies over the last three to four decades has been the persistent decrease in real interest rates. A related, parallel and intertwined development is the decline in the policy rate of central banks.
A number of negative effects stemming from the decline in these interest rates have been at the centre of monetary and financial policy debates in recent years. For central banks, the issue of the zero lower bound – i.e. how to conduct monetary policy when policy rates are at or just above zero – has been the central policy question. Pension funds and life insurers, which have traditionally relied on long-dated government bonds to finance liabilities, are finding themselves particularly challenged in meeting past commitments of financial return. Asset bubbles, in particular in the housing market, may further increase contingent liabilities of governments across the globe.
We argue in the paper, however, this preoccupation is one-sided. Another key consequence of falling interest rates is the reduction in the servicing costs of large sovereign debt burdens. With a focus on Belgium, we show that the favourable re-financing environment has benefitted public finances in several ways. Like other heavily indebted economies, Belgium has managed to save significantly on debt-servicing costs. In addition, there is an on-going process of decreasing government debt in real terms and the government has managed to make its debt maturity profile less vulnerable to interest rate shocks.
On the other hand, the main future challenge to public finances in developed countries is the rising pressure stemming from their ageing societies. In some European countries, the increased expenditure is projected to amount to up to 7% of GDP by 2060 (European Commission, 2015). For Belgium, the situation is less dire. After the pension reform in 2015, which reduced the projected increase in pension expenditures with 2 percentage points by 2030, Belgium now faces an additional public expenditure burden of around 0.9% of GDP by 2030 (Federal Planning Bureau, 2015).
in pension and health-related expenditures are to some extent driven by demographic changes and societal ageing. Thus, if one (partly) offsets the other, this should be taken into account when addressing the public finance challenges of an ageing population.
In this study, we first review recent contributions to the debate on persistently low real interest rates and conclude that none of the trends that led to a decrease in risk-free interest rates can be expected to reverse in the near future. We then contrast the two diametrical trends of decreasing debt-servicing costs and the rise in age-related expenditure and argue that, after the recent pension reform, they are likely to offset each other entirely. Our projections based on current secondary market yields on Belgian government bonds show a further decrease in net debt interest payments by 1.1 percentage points of GDP between 2013 and 2030. Even in a hypothetical scenario in which interest rates rise moderately, the savings on debt-servicing costs would cover the additional public expenditure.
The remainder of this paper is structured as follows. The second and third sections provide the theoretical and empirical background for the fall in real interest rates across developed countries. It makes an effort to reconcile the results from the diverse recent contributions that range from overlapping generation models to growth accounting and argues that a reversal of the strongest secular trends driving down real interest is not likely or imminent. In the fourth section, the focus turns to Belgium and the direct impact of persistently low interest rates on its public finances. The fifth section contrasts these potential net debt interest savings with increased age-related expenditure and argues that the former will easily offset the latter. Section six concludes.
2. Savings, investment and the real rate of interest
Figure 1. Global savings, investment and real interest
Note: EU7 real interest rate is the unweighted average of long-term real interest rates in Belgium, Denmark, France, Germany,
Italy, the Netherlands and the UK. Countries were selected based on long-term data availability. Source: Authors’ own configuration based on Bean et al. (2015, left); AMECO and IMF WEO (right).
Determining the shape of the investments/savings schedules and the concomitant move in the interest rate is a classic economic identification problem. Hence, the sensitivity of both savings and investment to changes in the interest rate has been analysed in a number of empirical studies. DeFina (1984) summarised all estimates that had been put forward by researchers at the time and found that the percentage change in savings associated with a one percentage point increase in real interest rates varied widely between 0% and 5.8%. The most recent calculations by the IMF (2014a) estimate the elasticity of investment to the real interest rate to be about −0.5, and an elasticity of saving to the real rate of about 0.15.
Although even extreme cases,1 i.e. a complete insensitivity of either desired investment or desired savings, cannot be ruled out, as noted by Bean et al. (2015), it is likely that the observed decline in real interest rates combined with unchanged relative volume is due to a shift in both the investment and savings schedules.
Given the uncertainties related to the shape of the investment and savings schedules and the observed trend in the real interest rate, recent contributions have focused on analysing secular trends that coincide with the decline in the real interest rate and affect either the savings and/or the investment schedule. Bean et al. (2015, p. 21) argue that “while we cannot rely on the evolution of the global savings/investment share to identify the drivers of the decline in interest rates, we can still look directly at the correlation between those drivers and the movements in interest rates” . While such an approach will not establish casual links in a strict
1 See the appendix for an illustration.
0% 1% 2% 3% 4% 5% 6% 7% Re al in tere st in % Investment/Savings (volume) Investment Savings 0% 1% 2% 3% 4% 5% 6% 7% 0% 5% 10% 15% 20% 25% 30%
Global investment/GDP (lhs) Global savings/GDP (lhs)
sense, with the aid of structural models of drivers of investment and savings, we nonetheless should be able to infer the direction of the effects (Eggertson et al., 2017). Our ambition here is therefore not to quantify these drivers, but rather to assess to what extent secular trends that have been considered important drivers of global real interest rates in the recent literature can be expected to reverse.
The relevant interest rates for our purposes is what are often referred to as the risk-free long-term advanced country interest rates, which are commonly measured by 10-year sovereign bond yields adjusted by inflation expectations to convert nominal into real rates.2 A more precise theoretical concept is that of the equilibrium real interest rate; the real interest rate where real GDP equals potential GDP, i.e. where the output gap is zero and where the inflation rate is at the level of the target inflation rate. This unobserved interest rate has received much attention in recent literature and several authors have suggested models for estimating it (Justiniano and Primiceri, 2010; Barsky et al., 2014; Cúrdia et al., 2015; Kiley, 2015; Laubach and Williams, 2015; Lubik and Matthes, 2015). While Taylor and Wieland (2016) point out some shortcomings of these model-based approaches, section 3 of this study is implicitly based on this theoretical baseline interest rate in order to emphasise that the decline in nominal interest rates across the globe cannot be attributed to a change in inflation (expectations).
3. Secular drivers of savings and investment
In this section, we review the secular drivers that have been decreasing both desired savings and desired investment. It is important to note that the impact is not directly observable, i.e. actual savings and actual investment have not changed in the same manner due to their interdependency.
3.1 Desired savings
Population ageing
Analyses of the effect of ageing on the real interest are based on the life-cycle model of consumption and savings (Brumberg and Modigliani, 1954). Individual savings takes place when people are in their high-earning years, typically starting in their late 30s until they reach retirement age. Börsch-Supan (2003) has conducted the most comprehensive empirical study on the issue by constructing synthetic panels from cross-sectional data. These analyse six advanced countries - the United States, the United Kingdom, Germany, the Netherlands, Italy and Japan – and their results indeed show the above-described hump shape for most countries.
Moreover, there is little dissaving, i.e. spending more than one has earned, at older ages. The analysis does find differences in the exact shape of the age-savings profiles across countries,
which cannot easily be accounted for. Some of this cross-country variation can be attributed to the generosity of domestic welfare systems3 and mortgage down payment ratios, but much of the variation cannot be so easily explained.
These differences, combined with the fact that capital is mobile internationally and therefore that ageing in large countries can affect smaller ones, make it difficult to assess the magnitude of the ageing population for the savings schedule. Moreover, the relatively recent trend of longer working lives adds additional uncertainty because it prolongs the prime savings years. The timing of the decline in real interest coincides exactly with the increased number of people in the age cohorts with the highest propensity to save; however, despite the fact that these cohorts will gradually enter into retirement over the next two decades, a complete reversion of the trend does not follow from most empirical analyses.
Carvalho et al. (2015) stress that an increased life expectancy exacerbates the propensity to save among the middle-aged cohort, as a prolonged retirement period is anticipated. At the same time, a slowdown in population growth has an ambiguous effect on the real interest rate: while the increase in capital per worker puts downward pressure on interest rates, the increasing number of retirees with a lower propensity to save might well offset this effect in the long run.
Within-country income inequality
While inequality between countries has fallen, within-country inequality has risen in recent decades. This observation has most remarkably been brought to the surface of the debate by Piketty (2014). He provides evidence for a rising share of income held by the top decile of the population for a number of advanced and emerging economies.
The rising marginal propensity to save with an increase in income has been stressed by several country-level US studies, starting with Dynan et al. (2004), who present evidence showing that the rich indeed save relatively more. These findings are supported by later US studies (Saez and Zucman, 2014).
While within-country inequality has indeed risen among OECD countries on average, detailed studies on the effect of rising inequality on savings are only available for the US where the effect is more pronounced than in other OECD countries, as shown in Figure 2.
Regardless of the causal effect of within-country inequality on global real interest rates, there appears to be no evidence of a trend reversal in the short to medium term.
Figure 2. Gini coefficient of income inequality in the US and the OECD (average value of all OECD members)
Source: Author’s own configuration based on OECD data.
Savings in emerging markets and Chinese financial market integration
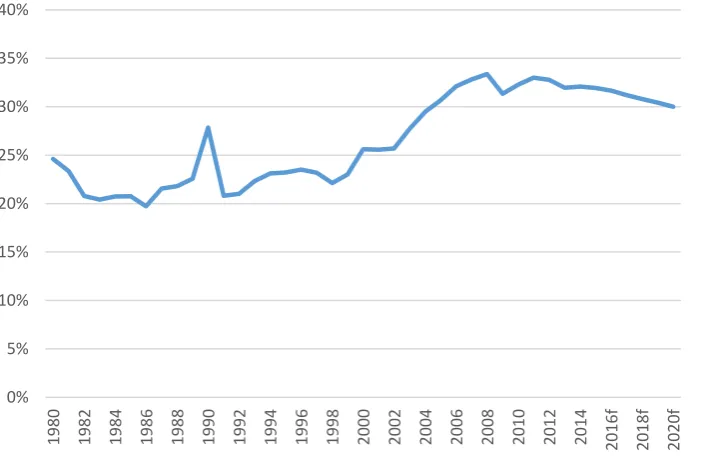
After 2000, savings in emerging markets relative to GDP have increased significantly, after being roughly constant in the preceding two decades (Figure 3).
Figure 3. Savings rates in emerging markets and developing countries (percentage of GDP) 1980-2020
Source: Authors’ own configuration based on IMF WEO data. 0.20
0.22 0.24 0.26 0.28 0.30 0.32 0.34 0.36 0.38 0.40 0.42
1975 1980 1985 1990 1995 2000 2005 2010
OECD USA
0% 5% 10% 15% 20% 25% 30% 35% 40%
[image:8.595.80.437.499.727.2]The IMF (2014) notes that global savings rates went up by 1.7 percentage points in emerging economies between 2000 and 2007, of which 1.5 percentage points were due to higher emerging market savings, 0.8 percentage points to the higher share of emerging markets in global GDP and a 0.6 percentage point decline to lower relative savings rates in advanced economies.
While foreign exchange accumulation in the aftermath of the 1997-98 crisis in the whole of Asia has certainly contributed to higher demand for safe advanced-economy assets, Bean et al. (2015) stress that China in particular has been a drag on global interest rates. The combination of a rise in savings and large current account surpluses caused by China’s export-led growth model resulted in an extensive outflow of funds. These went mainly into advanced economies where they pushed down real interest rates, enabled by Chinese financial market integration. Many underlying drivers for high net savings rates, which are deeply rooted in the household, the firm and the government sector, have been cited (Tao Yang, 2012). Ma and Yi (2010), for example, identify corporate restructuring, the Lewis model of transformation and rapid ageing as the main driving forces. In the medium term, these forces will reach a plateau and slightly reverse (Ma and Tao Yang, 2013). This trajectory is in line with IMF forecasts that predict a decline in both Chinese gross national savings and a more moderate current account. In the same vein, Chinese foreign exchange reserves have dropped sharply between the end of 2014 and 2016, but the latest numbers show that this trend is already faltering (IMF, 2016a).
[image:9.595.68.516.478.716.2]All in all, China and other emerging markets are unlikely to put further downward pressure on global real interest rates. But a complete reversal of current forces cannot be expected.
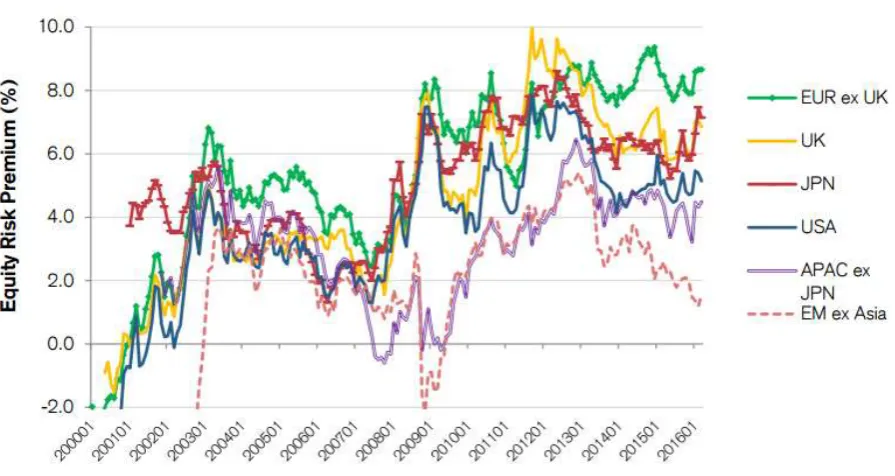
Figure 4. The equity risk premium, 2000-16
Note: Beginning of year data.
3.2 Desired investment
Rise in the spread between the risk-free rate and the cost of capital
There appears to be a clear shift in preference towards safe assets among investors.4 Figure 4 above shows the aggregate equity risk premium for most advanced and emerging economies between 2000 and 2016.
Overall, the equity risk premium, defined by the cost of equity minus the risk-free rate, has increased globally with the exception of emerging market economies where it has fluctuated around a constant level since 2000.
The reason this trend has important implications for global real interest rates is its impact on companies’ investment decisions. Investment decisions depend on the weighted average cost of capital (WACC), the weighted average of a company’s debt servicing costs and its cost of equity. With the equity risk premium shooting up, these costs increased vis-à-vis the risk-free rate, making corporate investment relatively less attractive.
However, the increase in risk aversion among investors is mostly observed across asset classes, not within them. Emerging market sovereign bonds premia have not risen over the past two decades, while the spread between corporate and sovereign bonds has remained approximately constant (Bean et al., 2015; Rachel and Smith, 2015).
The above observations should be taken with care as they are two-layered: They capture both changes in the perceived riskiness of assets and changes in risk appetite among investors. However, we currently do not find evidence for a reversal of these trends.
Relative price of capital goods
Cheaper capital may have two effects on investment: first, it may trigger more investment as lower marginal returns are needed to recoup the price of capital, and second, a given amount of investment can be maintained by dedicating a relatively smaller share of overall production to capital-intensive projects. As illustrated convincingly by Rachel and Smith (2015), the 30% decline in the relative price of capital goods since the 1980s had an overall negative effect on investment, as the elasticity of substitution between labour and capital is not sufficiently high (see also Thwaites, 2015).
Reduced profitability of investment
The above decline in the relative price of investment was predominant until the early 2000s. In the aftermath of the global financial crisis, a different force took over: a drop in investment profitability (IMF, 2014a).
In the near to medium term, we do not expect higher substitutability between labour and capital, nor do we see any signs of increasing investment profitability, absent substantial structural reforms.
Public investment decline in advanced economies
Public investment in advanced economies has been on a declining path since the 1980s, putting downward pressure on real interest rates (IMF, 2014b). Recent declines are partly explained by the downward pressure on total public expenditures in many countries after the 2008 financial crisis. However, Jäger and Schmidt (2016) suggest that the long-run trend is a structural feature of an ageing society. They predict that the trend will only reverse once the share of older people in the electorate reverses. Furthermore, analyses by the IMF (2016b) do not predict a reversal of this trend in the near future.
Monetary policy
Quantitative easing (QE) programmes in Japan, the United Kingdom, the United States and the euro area have certainly had a negative effect on long-term government bond yields.5 While the Federal Reserve and the Bank of England have terminated their asset purchasing programmes by now, the Bank of Japan (BOJ) and the European Central Bank (ECB) continue theirs. According to recent research by Allianz (Petersen, 2017), the Eurosystem’s holdings of public sector debt amounted to 16.4% of the eurozone gross government debt as of April 2017.
Refraining from a discussion on the different transmission channels of QE (see Alcidi et al., 2015), we believe that it is reasonable to assume a small moderate pick-up of government bond yields once the ECB and the BOJ terminate their programmes.6
In conclusion, while linking secular trends to the decline in the propensity to invest seems evident, explaining the rise in the propensity to save is more difficult. While emerging market reserve accumulation and structural phenomena in China certainly contributed to lower real interest rates in advanced economies, other secular trends such as the rise in within-country inequality and the link between ageing and desired savings, albeit widely accepted, are difficult to establish empirically. The conclusion we draw is that while we cannot quantify the importance of the different secular drivers of low real interest rates, we consider it unlikely that any of the causal factors will reverse any time soon.
5 See for example Breedon et al. (2012), who find that the Bank of England’s QE1 lowered government bond yields by 50 to 100 basis points.
4. The effect of persistently low real interest rates on public finances: The case of Belgium
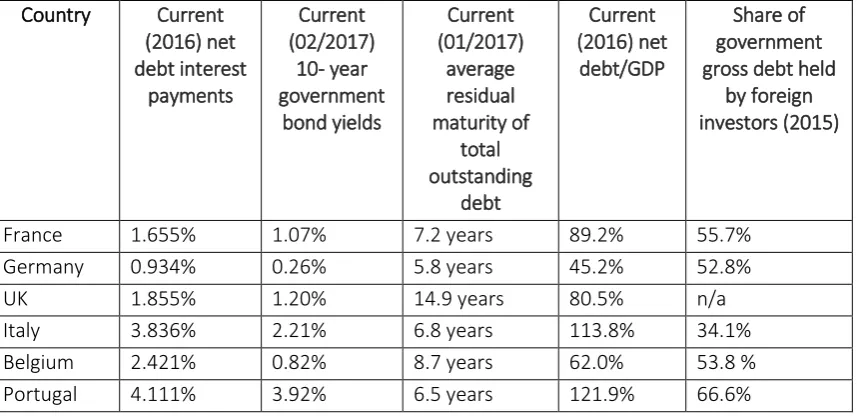
[image:12.595.76.506.246.454.2]The falling interest rates have led to lower government net debt interest payments throughout all European countries.7 Much of the gains have already been realised over the past decade. Table 1 below shows the current interest payments of selected European governments (column 2) and contrasts them with current 10-year benchmark yields (column 3) to indicate additional savings potential.
Table 1. Selected European governments and their potential to save further on debt servicing costs
Country Current
(2016) net debt interest
payments
Current (02/2017)
10- year government
bond yields
Current (01/2017)
average residual maturity of
total outstanding
debt
Current (2016) net
debt/GDP
Share of government gross debt held
by foreign investors (2015)
France 1.655% 1.07% 7.2 years 89.2% 55.7%
Germany 0.934% 0.26% 5.8 years 45.2% 52.8%
UK 1.855% 1.20% 14.9 years 80.5% n/a
Italy 3.836% 2.21% 6.8 years 113.8% 34.1%
Belgium 2.421% 0.82% 8.7 years 62.0% 53.8 %
Portugal 4.111% 3.92% 6.5 years 121.9% 66.6%
Data sources: OECD Economic Outlook 2016, IMF WEO 2017, Bloomberg, ECB and Eurostat.
The current average residual maturity (column 4) gives an additional indication of the cost-saving potential: The low interest rate environment makes it cheaper to de-risk the maturity profile of government debt. Governments that have issued debt with a longer average maturity have therefore more potential to save on the issuance of future debt. Current government net debt as a share of GDP (column 5) indicates the potential for savings relative to the total debt burden when assets held by the government are subtracted.
With government net debt (calculated as gross debt net of intra-governmental debt, financial assets held by the government and debt held by the central bank) of around 62.0% in 2016, a
fall in the real interest rates has had a substantial impact on public finances in Belgium.8 Net debt interest payments have decreased from about 7% of GDP in 1998 to the current level of around 2.4% (Figure 5).
Figure 5. Belgian general government net debt interest payments (percent of GDP)
Source: Authors’ illustration based on data from OECD Economic Outlook 2015.
The maturity profile indicates that spikes mostly emerge in the short term, with 16% of total government debt maturing in 2016 and slightly more than that in 2017. After a third peak in 2021, the profile flattens out (European Commission, 2016 and Bloomberg data). Major forecasts predict a decrease in interest rate expenditure between 0.5 percentage points of GDP (IMF, 2016c) and 0.3 percentage points of GDP (OECD Economic Outlook, 2015) over the next two years. Our own calculations confirm these projections. We extend our forecast for Belgium by approximating savings on government interest rate payments until 2030, assuming that the debt composition, i.e. the shares issued in treasury bills, government bonds and other loans, remains constant.9
Figure 6 (lhs) below shows the weighted average fixed coupons of non-treasury bill debt maturing by year (2016-30) respective years.10
8 Note that net government debt is decreasing in most euro area countries due to the ECB’s sovereign bond purchasing programme. In January 2017, the euro area national central banks held 14% of gross government debt in the euro area (with the exception of Greece, which is not eligible to participate in the programme).
9The Belgian government also entered into a number of forward rate agreements, typically using 3 months and 6 months Euribor as the floating rate. The resulting coupons are all very close to zero. We do not consider them in our analysis for both their negligible small amounts and simplicity reasons.
10Since treasury bills have a maximum maturity of one year, we do not expect further gains accruing to them. We thus focus our estimates on all other bonds.
Figure 6. Weighted average fixed coupon on Belgian non-treasury bill debt maturing in the indicated years 2016-2030 (lhs) and savings on coupon payments as a percentage of GDP under a no-interest-rate-change assumption. 2016-2030
Source: Authors’ elaboration on Bloomberg and IMF WEO data.
Rolling over maturing government bonds by issuing new bonds that pay coupons equal to the secondary market yields of bonds with a maturity equivalent to the weighted average maturity of total government bonds gives us an estimate of expected savings on interest payments (Figure 6, rhs).11
The highest gains are thus expected for 2017 and 2022, with declining interest rate expenditure of 0.3% and 0.25% of GDP, respectively. A further peak occurs in 2028.
In order to determine the lower bound for net debt interest payments, consider the following thought experiment: Bonds of a maturity equalling slightly above eight years – the weighted average maturity of all outstanding debt – currently pay 0.37%. Multiplying this number by outstanding Belgian net debt to GDP of 65.8% gives us a lower bound for net debt interest payments of 0.24% of GDP.12 Of course, this extreme scenario is not likely to materialise in full due to other considerations affecting the optimal composition of total government debt. Accumulating the expected gains displayed in Figure 3 and adjusting them downward to consider only interest payments on government net debt gives us an estimate for savings of about 1.1 percentage points of GDP until the end of 2030, taking 2015 as the base year (Figure 7).
11This assumption is conservative for two reasons. First, we assume a linear and positively sloped yield curve. Figure 10 below shows that this assumption is reasonable – the ‘flattening out’ of the yield curve for maturities >20 years only increases potential gains. Second, in reality, public debt management is not static. Increased future growth expectations that would result in a steeper yield curve could easily be compensated for by issuing more short-term debt.
12 Data on the Belgian net debt-to-GDP ratio were extracted from the IMF’s World Economic Outlook database.
0% 1% 2% 3% 4% 5% 6% 20 16 20 17 20 18 20 19 20 20 20 21 20 22 20 23 20 24 20 25 20 26 20 27 20 28 20 29 20 30 0.00% 0.05% 0.10% 0.15% 0.20% 0.25% 0.30% 0.35%
[image:14.595.113.521.153.343.2]Figure 7. Historical and forecast aggregate savings on Belgian government net debt coupon payments, 2016-30 (percent of GDP)
Source: Authors’ own calculations based on Bloomberg data.
An important question is how the savings (as a percent of GDP) on interest payments translate into an improvement of public finances. Since (part of) the windfall for the government in terms of lower interest payments represents a loss in interest income of the domestic population, it does have implications in terms of income and consumption taxes; government tax intake will be lower. In addition, there may be second-order general equilibrium effects. Because lower interest rates on debt is a global phenomenon, the extent to which the domestic population is exposed depends on the net international investment position of the country’s investors.13 As an example, foreigners hold around 50% of outstanding Belgian government debt (Table 1 above). If the volume of foreign debt held by Belgians (which experienced a similar decline in interest rates) was at a value of less than 50% of government gross debt, parts of the government savings on interest rate payments would be a windfall from abroad and would not affect the real domestic economy. If, on the other hand, Belgians held foreign bonds equivalent to a value greater than 50% of Belgian government gross debt, the global fall in interest rates would affect the domestic real economy to a relatively larger extent.
Belgium’s net international investment position (NIIP) shows that the country is a net global investor with net assets valued at approximate 50% of GDP, a value that has remained relatively stable over the past few years. However, this surplus is composed of a large surplus in equity securities (€147 billion or 35% of GDP) and a surplus in residual investment, including financial derivatives (€112 billion or 27% of GDP). The position in debt securities, on the other
13 The relative riskiness of the investment portfolio (i.e. the composition in terms of equity and debt instruments) across countries is also a factor. If Belgians are more likely to hold equity relative to other nationalities, lower interest rates would affect their investment income comparatively less.
0.0% 0.2% 0.4% 0.6% 0.8% 1.0% 1.2%
hand, shows a deficit of €66 billion (or -17% of GDP).14 Thus, the direct effect of a global decline in interest rates (and a rise in the equity premium) is likely to benefit Belgian investors.
The overall impact that lower interest rates have on consumption via implicit transfers from bond holders to the government is arguably small. First, there is a limited direct effect on households. In the case of Belgium, residents outside the financial sectors held only a very small share (<5%) of outstanding Belgian government debt in 2015.15 Hence, the effect would come from lower dividends or equity valuations of bank and insurance companies, which only have a small effect on consumption (Case et al., 2005). Other holders of government debt are pension funds and mutual funds invested in safe assets. The impact of their investment performance on household behaviour is arguably limited.
4.1 Belgium’s government debt maturity profile
[image:16.595.79.423.399.644.2]The low interest environment led to a shift in Belgium’s government debt maturity profile. The weighted average maturity of total outstanding government debt increased by 3.5 years between January 2010 and March 2017, allowing the Belgian government to de-risk its debt structure without paying a high default risk premium (Figure 8).16
Figure 8. Weighted average maturity of total Belgian government debt, in years
Data source: ECB.
14 All calculations based on 2016-Q4 data of the Bank of Belgium; GDP (2016) data as reported by Eurostat. 15 Eurostat data.
16 As pointed out by Gros (2016), purchasing domestic government bonds by national central banks effectively decreases their maturity to 0. As of 31 March 2017, the National Bank of Belgium held Belgian government debt worth €49 billion (11% of outstanding debt) with a weighted average maturity of 10.1 years within the ECB’s public sector purchase programme (PSPP). This effectively reduces the weighted average maturity of government debt still traded on the secondary market to 8.7 years and the weighted average maturity of total outstanding debt to 7.9 years, which still constitutes a large increase over the past years.
0 1 2 3 4 5 6 7 8 9 10
2009-12 2010-04 2010-08 2010
-12
2011-04 2011-08 2011-12 2012-04 2012-08 2012-12 2013-04 2013-08 2013-12 2014
-04
An extension of maturities is a difficult yet important task. Heavily indebted countries like Belgium usually have maturity profiles skewed to the short term as governments’ commitments to low inflation become less credible when debt is high (Blanchard and Missale, 1991). While the credibility argument only applies to a very limited extent in a monetary union, several authors emphasise a second reason.17 Default risk alone may explain the short-term nature of debt maturity profiles when governments have accumulated significant debt in the past (Alesina et al., 1992).
The more debt a government takes on, the higher the default risk premium investors demand on long-term debt. Rolling over large amounts of debt every year entails a high vulnerability to sudden rises in interest rates, rendering default exponentially more likely with every year. This motivates governments to take on high amounts of short-term debt, which exacerbates the issue rather than solves it. Escaping from such a bad equilibrium can generally only be accomplished by a significant reduction in the debt burden. Belgium and other heavily indebted advanced countries, however, seem to have managed a reduction of their short-term debt owing to the current low-interest environment.
In general, lengthening and thus smoothing the structure of government debt by avoiding maturity peaks make confidence crises among investors less likely. If the amount of debt maturing every year is small, even severe crises characterised by a rapid rise in sovereign bond yields would not put pressure on public finances. As these dynamics are typically priced in by financial market participants, the magnitude of a sovereign bond price decline will eventually be less severe.
All in all, the government of Belgium has thus benefitted substantially from the global decline in interest rates. Besides the immediately favourable effect on debt-servicing costs, Belgium’s government debt is currently decreasing in real terms and its maturity profile has become less risky. The direct gains from the latter two effects are difficult to quantify. The most significant indirect effect is the positive impact on Belgium’s credit rating as the above factors are taken into consideration by all major credit rating agencies. As stated in the introduction, we abstain from speculating on potential private sector losses that may eventually inflict costs on the public sector. Contrasting the increased financial market risk caused by the low interest rate environment with the gains on decreased government interest payments would be another useful exercise. Further analysis of Belgium should also consider the impact on pension funds and the ‘search-for-yield’ behaviour to meet commitments made to beneficiaries.
4.2 Can decreased debt-servicing costs offset increased age-related expenditure?
Combining information from the European Commission’s 2015 ageing report and the Belgium Federal Planning Bureau’s (2015) update on forecast pension expenditure allows us to display changes in age-related expenditure in Belgium from 2013 to 2030 (Figure 9).
Figure 9. Disaggregated changes in age-related expenditure in Belgium with base year 2013 as a percent of GDP, 2013-2030
Source: Authors’ illustration based on data from the European Commission and the Belgian Federal Planning Bureau.
Overall, age-related expenditure increases by 0.9 percentage points of GDP over the time horizon under consideration. Increased spending on public pensions (+0.5), long-term care (+0.5) and education (+0.2) are slightly counter-balanced by lower health care (-0.1) and decreased unemployment expenditure (-0.2).
Comparing these numbers to the projected savings on government net debt interest payments of 1.6 percentage points of GDP by 2030 shows that the latter more than offsets the former. This offset is robust to a moderate pick-up in interest rates. In a hypothetical scenario where secondary market yields on average maturity debt increase to 1% in 2017 (by 63 basis points) and to 1.5% in 2025 (by 113 basis points), savings on net debt interest payments would still cover 90% of the additional age-related expenditure (see Appendix).
5. Conclusion
In this paper, we review recent contributions to the debate on the drivers of real interest rates. We conclude that, while we are uncertain to what extent each secular driver contributed to the decline in real rates over the past two decades, there is no evidence that any of them could be reversed substantially in the near future. Thus, we expect real interest rates to remain low in the medium-term.
The following expected decrease in Belgium’s debt-servicing costs could offset the increase in age-related expenditure entirely. Even in a scenario of slowly increasing interest rates, the direct gains accruing to Belgian public finances from persistently low interest rates cover age-related financing needs until 2030 without any further adjustments to Belgium’s primary balance if these savings are channelled towards public pensions, long-term care and education. Furthermore, we point out indirect gains stemming from an extension of debt maturities and a decrease of Belgian government debt in real terms.
-0.4% -0.2% 0.0% 0.2% 0.4% 0.6% 0.8% 1.0% 1.2% 1.4%
2020 2030
Unemployment Education Long-term care Health care
References
Alcidi, C., M. Barslund, W.P. De Groen and D. Gros (2015), “Currency Interventions: Effective Policy Tool or Shortsighted Gamble?”, Intereconomics, 50(2), pp. 64-81.
Alesina, A., M. De Broeck, A. Prati, G. Tabellini, M. Obstfeld and S. Rebelo (1992), “Default Risk on Government Debt in OECD Countries”, Economic Policy, Vol. 7, No. 15, pp. 427-463.
Arnberg, S. and M. Barslund (2014), “The Crowding-out Effect of Mandatory Labour Market Pension Schemes on Private Savings: Evidence from renters in Denmark”, CEPS Working Document No. 389, CEPS, Brussels, February.
Barsky, R., A. Justiniano and L. Melosi (2014), “The Natural Rate of Interest and Its Usefulness for Monetary Policy”, American Economic Review: Papers & Proceedings, 104(5), pp. 37– 43.
Bean, C., C. Broda, T. Ito and R. Kroszner (2015), Low for long? Causes and consequences of persistently low interest rates, Geneva Reports on the World Economy, London: CEPR Press.
Blanchard, O.J. and A. Missale (1991), “The debt burden and debt maturity”, NBER Working Paper No. 3944, National Bureau of Economic Research, Cambridge, MA.
Börsch-Supan, A. (2003), Life-Cycle Savings and Public Policy: A Cross-National Study of Six Countries, San Diego, CA: Academic Press.
Breedon, F., J. S. Chadha and A. Waters (2012), “The financial market impact of UK quantitative easing”, BIS Papers No 65, Bank for International Settlements, Basel.
Brumberg, R. and F. Modigliani (1954), “Utility Analysis and the Consumption Function: An Interpretation of Cross-Section Data”, in K. Kurihara (ed.), Post Keynesian Economics, New Brunswick, CT: Rutgers University Press.
Case, K. E., J.M. Quigley and R.J. Shiller (2005), “Comparing wealth effects: the stock market versus the housing market”, BE Journal of Macroeconomics, 5(1), 1.
Carvalho, C., A. Ferrero and F. Nechio (2015), “Demographics and Real Interest Rates: Inspecting the Mechanism”, paper presented at European Commission Conference Paper on Post-Crisis Slump, Brussels, 1-2 October 2015.
Credit Suisse (2016), “HOLT Macro Insights – March 2016”, Credit Suisse Market Commentary,
Cúrdia, V., A. Ferrero, A., G.C. Ng and A. Tambalotti (2015), “Has US monetary policy tracked the efficient interest rate?”, Journal of Monetary Economics, 70, pp.72-83.
Draghi, M. (2016), “Addressing the causes of low interest rates”, Speech held at the panel on “The future of financial markets: A changing view of Asia” at the Annual Meeting of the
Asian Development Bank, Frankfurt am Main, 2 May
(https://www.ecb.europa.eu/press/key/date/2016/html/sp160502.en.html).
Dynan, K. E., J. Skinner and S.P. Zeldes (2004), “Do the Rich save more?”, Journal of Political Economy, Vol. 112, No. 2.
Eggertsson, G. B., N. R. Mehrotra, and J. A. Robbins (2017), “A Model of Secular Stagnation: Theory and Quantitative Evaluation”, NBER Working Paper No. 23093, National Bureau of Economic Research, Cambridge, MA.
European Commission (2015), “The 2015 Ageing Report - Economic and budgetary projections for the 28 EU Member States (2013-2060)”, European Economy 3.
European Commission (2016), “Country Report Belgium 2016”, Commission Staff Working Document 26 February (http://ec.europa.eu/europe2020/pdf/csr2016/cr2016_belgium
_en.pdf).
Federal Planning Bureau (Belgium) (2015), “Economic Policy Committee’s Ageing Working
Group Belgium: Country Fiche 2015” (http://www.plan.be/admin/uploaded/
201511271708080.Country_fiche_Belgium_20151126.pdf).
Gros, D. (2016), “QE infinity: What risks for the ECB?”, In-Depth Analysis, IP/A/ECON/2016-01, February (www. europarl. europa. eu/committees/en/econ/monetary-dialogue. Html).
International Monetary Fund (2014a), “Perspectives on global real interest rates”, World Economic Outlook, Ch. 3, April.
International Monetary Fund (2014b), “Is it time for an infrastructure push? The macroeconomic effects of public investment”, World Economic Outlook, Chapter 3, October.
International Monetary Fund (2016a), “Time Series Data on International Reserves and Foreign
Currency Liquidity”
(https://www.imf.org/external/np/sta/ir/IRProcessWeb/data/8802.pdf).
International Monetary Fund (2016b), “Fiscal Monitor: Acting Now, Acting Together”, Washington, D.C., April.
International Monetary Fund (2016c), “Article IV consultation on Belgium”, IMF Country Report No. 16/77, Washington, D.C.
Justiniano, Alejandro and Giorgio E. Primiceri (2010) “Measuring the equilibrium real interest rate,” Economic Perspectives, Federal Reserve Bank of Chicago.
Kiley, Michael T. (2015), “What Can the Data Tell Us About the Equilibrium Real Interest Rate?”, Board of Governors of the Federal Reserve, FEDS Working Paper No. 2015-077.
Laubach, Thomas and J. C. Williams (2015), “Measuring the Natural Rate of Interest Redux,” Federal Reserve Bank of San Francisco.
Liu, Z. and M.M. Spiegel (2011), “Boomer retirement: headwinds for US equity markets?”, FRBSF Economic Letter 2011-26.
Lubik, Thomas A. and Christian Matthes (2015), “Calculating the Natural Rate of Interest: A Comparison of Two Alternative Approaches,” Economic Brief, Federal Reserve Bank of Richmond, October.
Ma, G. and D. Tao Yang (2013), “China’s High Saving Puzzle”, IZA Discussion Paper No. 7223, Institute for Labour Economics.
Ma, G. and W. Yi (2010), “China’s high saving rate: myth and reality”, BIS Working Papers No 312, Bank for International Settlements, Basel.
Organisation for Economic Co-operation and Development (2015), “OECD Economic Outlook”, Vol. 2015 Issue 1.
Piketty, T (2014), Capital in the 21st Century, Cambridge, MA: Harvard University Press.
Petersen, Ann-Katrin (2017), “The ECB’s exit: First things first”, AllianzGI QE Monitor, 26 April (https://www.allianzglobalinvestors.de/MDBWS/doc/QE+Monitor_May+2015_e.pdf?4b c8334c2b03239835b06160629ef69e41f64da6).
Rachel, L. and T. Smith (2015), “Secular drivers of the global real interest rate”, Bank of England Staff Working Paper No. 571, London.
Saez, E and G. Zucman (2014), “Wealth inequality in the United States since 1913: evidence from capitalized income tax data”, NBER Working Paper No. 20625, National Bureau of Economic Research, Cambridge, MA.
Taylor, J.B. and V. Wieland (2016), “Finding the equilibrium real interest rate in a fog of policy deviations.” Business Economics, 51(3), pp. 147-154.
Tao Yang, D (2012), “Aggregate Savings and External Imbalances in China.” IZA Discussion Paper No. 6964, Institute for Labour Economics.
Appendix
Figure A1. Annual growth of CPI inflation in Belgium, 1986-2016
Data source: OECD.
Figure A2. Belgian secondary market government bond yields (07/05/2017) and Belgian y-o-y CPI inflation (03/2017) (percent)
Source: OECD.
-0.5 0 0.5 1 1.5 2 2.5 3 3.5 4 4.5 5
1986 1987 1988 1989 1990 1991 1992 1993 1994 1995 1996 1997 1998 1999 2000 2001 2002 2003 2004 2005 2006 2007 2008 2009 2010 2011 2012 2013 2014 2015 2016
-1 -0.5 0 0.5 1 1.5 2 2.5 1 ye ar 2 ye ars 3 ye ars 4 ye ars 5 ye ars 6 ye ars 7 ye ars 8 ye ars 9 ye ars 10 ye ars 11 ye ars 12 ye ars 13 ye ars 14 ye ars 15 ye ars 16 ye ars 17 ye ars 18 ye ars 19 ye ars 20 ye ars 21 ye ar s 22 ye ars 23 ye ars 24 ye ars 25 ye ars 26 ye ars 27 ye ars 28 ye ars 29 ye ars 30 ye ars
[image:22.595.78.479.493.748.2]Note: All government issued bonds are currently below the Belgian CPI inflation rate (Figure A2). Thus, virtually any newly issued bond decreases Belgian government debt in real terms.
Figure A3. Overall change in age-related expenditure by 2020 and 2030 in Belgium (base year 2013)
Source: Authors’ illustration based on data from the European Commission and Belgian FPB.
Figure A4. Forecast annual savings on net debt coupon payments (share of GDP)
Note: Based on a hypothetical scenario that assumes an increase in the average yield of maturity debt in the secondary market
from the current level of 1% in 2017 to 1.5% in 2025. Source: Authors’ own calculations based on Bloomberg data.
-0.2 0 0.2 0.4 0.6 0.8 1
2020 2030
0.0% 0.1% 0.2% 0.3% 0.4% 0.5% 0.6% 0.7% 0.8% 0.9%
[image:23.595.76.489.438.709.2]CEPS▪ Place du Congrès 1 ▪ B-1000 Brussels ▪ Tel: (32.2) 229.39.11 ▪ www.ceps.eu
Founded in Brussels in 1983, CEPS is widely recognised as the most experienced and authoritative think tank operating in the European Union today. CEPS acts as a leading forum for debate on EU affairs, distinguished by its strong in-house research capacity and complemented by an extensive network of partner institutes throughout the world.
Goals
Carry out state-of-the-art policy research leading to innovative solutions to the challenges facing Europe today
Maintain the highest standards of academic excellence and unqualified independence Act as a forum for discussion among all stakeholders in the European policy process Provide a regular flow of authoritative publications offering policy analysis and
recommendations
Assets
Multidisciplinary, multinational & multicultural research team of knowledgeable analysts
Participation in several research networks, comprising other highly reputable research institutes from throughout Europe, to complement and consolidate CEPS’ research expertise and to extend its outreach
An extensive membership base of some 132 Corporate Members and 118 Institutional
Members, which provide expertise and practical experience and act as a sounding board for the feasibility of CEPS policy proposals
Programme Structure
In-house Research Programmes
Economic and Finance Regulation
Rights Europe in the World Energy and Climate Change
Institutions
Independent Research Institutes managed by CEPS
European Capital Markets Institute (ECMI) European Credit Research Institute (ECRI)
Energy Climate House (ECH)
Research Networks organised by CEPS
European Climate Platform (ECP)