The
ECONOMIC
Background
THE INTERNATIONAL ENVIRONMENT Overview
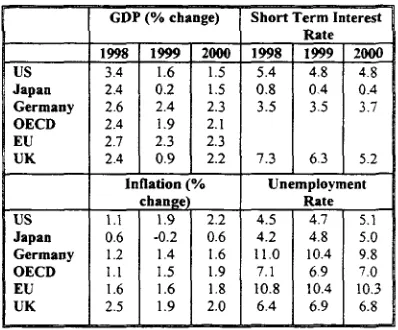
[image:1.513.273.472.262.427.2]Over the past few months the global economy has weakened slightly due to strong deflationary pressures. The monetary authorities have reacted to this by reducing the repo rate by 75 basis points in die US, by 125 points in the UK and by approximately 80 basis points in Euroland. There is a lack of demand in the Euro Area, more so in France, Germany and Italy mat is particularly disconcerting. The Japanese economy remains a major problem with the recession likely to last longer than first thought. The US continues to grow strongly and mere is an absence of inflationary pressures thus assisting global economic activity. Nearly all economic forecasters have revised down their growth figures for the major overseas economies with the exception of the US. Financial markets remain volatile and there is still uncertainty over the Far East, the emerging market economies (particularly Brazil) and the Eastern European economies. The Brazilian devaluation should see a restructuring of the partem of demand leaving the level of demand relatively unchanged with no significant adverse effect on world demand. This is unlike the Far East crisis that led to a reduction in overall demand and thus world demand. Both these shocks will be partially compensated for by lower commodity prices easing inflationary pressures in the developed economies. Forecasts of the main economic indicators for the world economy are set out in Table 1.
The US
The US is experiencing continued strong growth with GDP growth of 0.9% in 1998 Q3, (a 3.6% increase on an annual basis. This growth is
primarily due to private sector consumption and investment. Domestic demand was strong enough to offset a negative contribution to growth from net trade. Growth in 1998 Q4 is estimated to be 1.5%. There has now been three years of growth (in the range of 3.5-4.0%) with low inflation. This growth is underpinned by real income and wealth growth. There are some signs that this may slow down in 1999 as will employment growth. Unemployment has been at historically low levels and is forecast to rise slightly by the year 2000. During this year it is expected that the Fed will cut its rates again, possibly in the spring.
Table 1: International Economic Forecasts (main economic indicators)
US Japan Germany OECD EU UK US Japan Germany OECD EU UK
GDP (% change) 1998 3.4 2.4 2.6 2.4 2.7 2.4 1999 1.6 0.2 2.4 1.9 2.3 0.9 2000 1.5 1.5 2.3 2.1 2.3 2.2 Inflation (% change) 1.1 0.6 1.2 1.1 1.6 2.5 1.9 -0.2 1.4 1.5 1.6 1.9 2.2 0.6 1.6 1.9 1.8 2.0
Short Term Interest 1 Rate 1998 5.4 0.8 3.5 7.3 1999 4.8 0.4 3.5 6.3 2000 4.8 0.4 3.7 5.2 Unemployment Rate 4.5 4.2 11.0 7.1 10.8 6.4 4.7 4.8 10.4 6 9 10.4 6.9 5.1 5.0 9.8 7.0 10.3 6.8
Data Sources: Fraser of Allander Institute. IESR, Bank of England, OECD
Net export growth has declined by 1.3% in 1998 and is forecast to fall by 0.7% in 1999 (National Institute Economic Review, (1999), 167, January, p41). The housing market remains buoyant and an increase in investment is possible. Employment growth increased by 0.55% in 1998 Q4 and by 1.5% over 1998. Average earnings are expected to grow by 3.5-4.0% this year and next. If US inflation rises as in Table 1 then we would expect real wage growth to be moderated.
Japan and Asia
0.3% to growth in 1998 Q3 while net exports
added 0.7% to GDP over the year. It is the lack
of domestic demand that is the main problem.
This has compounded the effects of the Asian
crisis. The December Tankan survey reported
declining business sentiment in both
manufacturing and non-manufacturing.
Industrial production has remained weak, falling
6.6% in 1998 Q4 on 1997 Q4. Investment is
expected to fall by 2.6% for the latest fiscal year
while retail sales fell by 4.3% on an annual basis
to 1998 Q4. However retail sales were up 7.4%
when compared to 1998 Q3. Nominal wages
rose by 28.4% in 1998 Q4 taking in year end
bonuses but other forms of income that make up
20% of total pay have fallen. Unemployment
continues to rise (4.4% in November 1998) thus
limiting income growth therefore the housing
market remains fragile. New housing starts and
new orders have declined again. It is not clear
what effect the fiscal stimulus is having on the
economy but it certainly will not provide it with
a sustained path to recovery. For this to happen
domestic demand must increase and there must
be continued reforms in the financial sector.
Europe
Third quarter GDP growth in Germany was
0.9%, up by 2.7% on an annual basis compared
to zero growth in the second quarter. The main
contribution is from strong private consumption.
In France growth slowed to 0.5% (2.8% on an
annual basis) for the same period. Here there has
been a run down of stocks and a smaller
contribution from household demand. Both
France and Germany had positive contributions
from net trade. Together France and Germany
grew by 2.7% on a year earlier on 1998 Q3
while Italian growth was 1.2% on the same basis.
However the smaller economies of Europe
showed stronger growth at 2.9% leaving Euro
Area growth of GDP to be 2.4%. This gap
between the smaller economies and France and
Germany is narrowing.
The short run outlook is not encouraging as
German industrial production slowed and
manufacturing orders fell. In France annual
industrial production is also slowing. There has
also been a drop in business sentiment in these
countries but this has not yet affected
employment growth. Employment growth was
0.4% in France in 1998 Q3 (2.3% on the year)
and 0.3% (0.3% on an annual basis) in Germany.
Consumer confidence remains high, at the
moment perhaps reflecting that there is still
employment growth and low inflation in these
two countries. Unemployment has fallen
significantly in 1998 in Europe but remains
relatively high. The forecast for unemployment
is that it should continue to fall steadily in the
Euro Area. There is now quite clear evidence
that 1999 will see a considerable slowdown in
Europe while inflation will remain low.
Following the problems of East Asia net capital
flows to emerging markets fell by up to $150
billion in 1996/97 and $70 billion in 1998. This
has led to current account surpluses in the
affected emerging market economies and deficits
in the developed economies. This was evident in
the US but net trade made positive contributions
to GDP growth in France and Germany where
the surplus was 3.5% and 0.2% of GDP in 1998
Q3. Euro Area currencies depreciated in real
effective terms between 1996 and 1998 Ql in
contrast to the dollar. Europe growth will depend
on any slowdown in the US, the effects of the
recent appreciation of Euro Area currencies and
the fragility of emerging markets.
UK MACROECONOMIC TRENDS
In the third quarter of 1998, the estimate of GDP
at market prices - 'money' GDP - rose by
1.1%. After allowing for inflation, GDP at
constant 1995 market prices grew by 0.4%
during the quarter, compared with 0.5% in the
second quarter, 0.5% in the first quarter, 0.9% in
the fourth quarter of 1997, and 0.9% in the third
quarter. Over the year to the second quarter,
'real' GDP at constant market prices is
estimated to have risen by 2.3%. Preliminary
estimates of 'real' GDP growth for the fourth
quarter suggest that the economy grew by 0.2%
to a level 1.6% above the same period a year
ago.
5
4 5
4
-3 •
2.5
Constant eric* annual fourth rata* - on aama quarter In pravloua yaar
GDP at market prices
^ - ~ ^
/ \
/ V
t997 1 » » Sourca: ONS
\
than the same period a year ago. Within production: manufacturing experienced a decrease in output of 0.1% in the third quarter, output of the other energy and water supply industries rose by 1.3% in the third quarter, and mining & quarrying, including oil & gas extraction rose by 0.2%. Manufacturing output in the third quarter was 0.4% above the same period a year ago. The output of the service sector rose by 0.8% in the third quarter. Over the year to the third quarter service sector output rose by 3.6%. The construction industry experienced a decrease in output in the third quarter of 0.6% with output in the industry rising by only 0.4% over the year.
CMWtant p r k * MintMl v o w t h n ( M - on S M I M quartar In
Household expenditure
I 4
In the third quarter of 1998, real households' expenditure (which is consumers' expenditure
minus expenditure by non-profit making
institutions serving households) rose by 0.3%. This compares with a 0.5% rise in the second quarter, a 0.5% rise in the first quarter, and a 1.2% rise in the fourth quarter of 1997. Spending during the third quarter rose by 2.6% on the same period a year earlieT. In the third quarter, consumers' expenditure again failed to provide the main contribution to GDP growth with its contribution of 53% behind the 95% contribution from investment. The official seasonally adjusted estimate of retail sales volume for the fourth quarter fell by 0.1%. In the three months to January 1999 sales volumes were 0.4% higher than in the preceding three months. The rise over the year to the fourth quarter was 1.4% and 1.5% over the year to the three months to January. The amount of outstanding consumer credit rose by £1.38bn in January. This compares with an increase of £0.67bn in December. The household saving ratio fell to 7.2% in the third quarter of 1998, from 7.7% in the second quarter, and 6.7% in the first quarter. The publication of the average earnings index has now been reinstated after revisions to the underlying survey methodology. The reported underlying increase in average weekly earnings
in the year to December 1998 was provisionally estimated to have been 4.2%, which represents a decrease of 0.3% points from the November rate. Real household disposable income (RHDI) fell by 0.3% in the third quarter of 1998 to a level 0.7% higher than in the same quarter in 1997. The fall in the saving ratio in the third quarter reflects the faster growth of households' expenditure compared to the change in RHDI.
General government final consumption, rose by 0.2% in the third quarter, compared to an increase of 0.4% in the second quarter, and increases of 0.9%, 0.6% and 0.2% in, respectively, the first quarter, the fourth quarter
1997 and the third quarter of that year. Government consumption in the third quarter was 2.2% higher than in the corresponding quarter of 1997. The contribution to GDP growth has fallen back again in recent quarters, from 36% in the first quarter 1998, to 15% in the second quarter and 10% in the third quarter.
•
V
Gonatant prica annual growth rata* • on • a m * quarter In pravloua yaar
General government final consumption
/
/
~ ~ ~ \ /
\ y
'"'
V-"~~
SMtrca: ONS
Real gross fixed investment or Gross fixed capital formation rose by 1.1% in the third quarter to a level 7.7% higher than in the third quarter of 1997. As a result, the contribution of investment to GDP growth rose appreciably (from minus 2 1 % to 95% of GDP growth).
Constant prica annual growtti rata* • oft I M M quarter In prvvtoua yaar
Gross fixed captial formation
12
i
0
~\-—""\ ,
\ /
1 » T
^ /
/
Sowca: ONS
"" "
tsaa
second quarter, a deficit of £1.4bn in the first
quarter, a surplus of £0.6bn in the fourth quarter
of 1997 and surpluses of £1.9bn in the third
quarter, £1.8bn in the second quarter and £1.9bn
in the first quarter. For trade in goods and
services, the deficit deteriorated to £1.83bn in
the third quarter, from £1.45bn in the second
quarter and £1.43bn in the first quarter. The
deficit in traded goods increased to £5.23bn in
the third quarter from £4.69bn in the second
quarter and £4.46bn in the first quarter. For
income and current transfers, there was a
surplus of £4.1 bn in the third quarter, reflecting a
record surplus of £5.2bn on investment income.
This can be compared to a small surplus of
£0.1bn in the second quarter and a surplus of
£0.1 bn in the first quarter. The deterioration in
the trade balance meant that net exports made a
significant negative contribution to growth in the
third quarter of 115%.
Constant price annual growth rata* - on asms quarter in pravioua yaar Exports and imports at goods and services
• ^ — S
1996 1997 1998 Sourca: ONS
UK LABOUR MARKET
Employment and Unemployment
Seasonally-adjusted UK claimant unemployment
fell by 18,000 in the quarter to January and by
88,500 over the full year. UK claimant
unemployment has been declining almost
continuously since February 1994 and now
stands at 1,305,300 giving an overall
unemployment rate of 4.5%, with a male and
female rate of 6.3% and 2.4% respectively. On
the ILO definition, unemployment is slightly
higher. For the quarter to December 1998, it
stood at 1,790,000 which is a rate of 6.2%. On
the ILO definition there has been a reduction in
unemployment by 14,000 since the previous
quarter and 103,000 over the year. The UK
unemployment rate remains below the OECD
total and also the EU average rate. For over two
years there has been a consistent increase in UK
employment which matches the fall in
unemployment. Total employment in the quarter
from October to December 1998 numbered
27,286,000 and this represents an employment
rate of 73.8%. This was an increase of 121,000
(0.4%) on the previous quarter and 304,000
(1.1%) on the previous year. However, the
employment experience in the various sectors of
the UK economy varied markedly. The biggest
proportionate increase in employment has
occurred in construction. This is particularly
pronounced for male jobs. Total and male
employment in this sector has increased by 9.8%
and 10.3% respectively over the year to
September. On the other hand, total employment
in agriculture and fishing, energy and water and
manufacturing fell in the year by 8.5%, 2.2%
and 0.8% respectively. Moreover, the more
up-to-date figures for the mining, energy and water
supply industries combined and for
manufacturing industry gives employment 1%
and 2% lower respectively in December 1998 as
against the figure for 12 months earlier. Whilst
the total employment and unemployment figures
change in a rather consistent manner, the level of
vacancies notified at Jobcentres has fluctuated.
The notified vacancy figure fell in November
and December but increased in January to a level
15.8% higher than the corresponding figure for
January 1998.
Earnings and Productivity
quarter of 1997. In the recent past manufacturing productivity growth has been disappointing and this remains the case. In December 1998 the annual rise in manufacturing productivity was only 1.1%. Given the manufacturing productivity growth figures of the past couple of years this is a relatively good performance but still lower than the whole economy figure. The resulting annual increase in unit labour costs to the third quarter of 1998 was 2.8% for the whole economy and 2.15% in manufacturing.
UK OUTLOOK
GDP growth of 0.2% in the fourth quarter was better than expected. However, manufacturing output continues to fall. In the three months to November output fell by 1.1%. Yet recent survey evidence suggests that manufacturing may be recovering. The February Purchasing Managers' Index revealed that the decline may be slowing down, reflecting increased domestic demand for consumer goods. Service sector output on the other hand continues to rise. In the fourth quarter output rose by 0.6% compared to a 0.8% rise during the previous three months.
Despite the sharp fall in retail sales volumes in December, the first quarterly fall since Q3 1992, there were signs of an upturn in February with optimism and sales rising. Surveys suggest that consumer confidence picked up in January as did demand for consumer credit. However, care must be exercised in interpreting the consumer credit figures. The Bank of England has pointed out that consumer demand is related to borrowing and equity withdrawal. Equity withdrawal has fallen recently so that the boost to demand of the increase in borrowing may be weaker than might appear at first sight. The housing market is relatively flat. The Halifax price index noted a 0.5% rise in January after the 0.1% fall in December. Mortgage lending is down. New house building activity is weak. Leading indicators suggest stagnant or falling transactions in the coming months.
Investment growth is slowing in manufacturing while investment in services continues to rise but at a slower rate. De-stocking continues, which is consistent with falling manufacturing output in the fourth quarter. Surveys reveal that stocks are still high relative to expected demand.
The deficit on traded goods is widening, especially with the non-EU. Export volumes are falling while imports are rising. During 1998, the value of exports to SE Asia fell by 27%, while imports rose by 3%.
The underlying rate of inflation (RPDt) rose by 0.1% points to an annual rate of 2.6% in December. Commodity and input prices, including oil, are still very weak, with commodity prices having fallen by over 22% since September 1995. According to the new series, earnings growth is slowing and given assumptions about productivity growth is broadly within the inflation target.
In the jobs market, LFS employment rose by 0.4% (98,000) in the three months to November. During this period the previous decline in self-employment reversed. However, the total number of hours worked rose more slowly over the same period, by 0.1%. Official data on jobs contrast strongly with recent survey evidence, which suggests that employment is falling in both manufacturing and services. Both new notifications and the stock of vacancies fell slightly in December. Yet, unemployment continues to fall.
The Treasury comparison of independent forecasts indicates a significant slowdown in GDP growth during 1999. From an anticipated outturn of 2.5% in 1998, the average forecast for 1999 is 0.6%, with a range o f - 0 . 5 % to 2.1%. We broadly agree with the National Institute for Social and Economic Research, who expect growth of 1% in 1999. We have persistently taken the view that the slowdown will be comparatively mild, largely due to the substantial easing of monetary and fiscal policy during 1998. Inflation is expected to be below target by the end of this year and there is a good chance that it will remain below during 2000 and 2001. Unemployment will rise during 1999 but only modestly. There will be little employment growth this year but no significant contraction either despite the slowdown in growth. This is because of the lack of wage pressure and the slowing of productivity growth. Finally, export growth is expected to recover towards the end of 1999. Import growth will also slow. And the current balance will continue to deteriorate although at a slower rate.