Building systems and indoor environment: simulation for design decision support
J L M Hensen1 and J A Clarke2
1
Centre for Innovation in Buildings TNO-TU/e Eindhoven University of Technology
The Netherlands
2
Energy Systems Research Unit University of Strathclyde, Glasgow
Scotland
ABSTRACT
This paper outlines the state-of-the-art in integrated building simulation for design support. The ESP-r system is used as an example where integrated simulation is a core philosophy behind the development. The paper finishes with indicating a number of barriers, which hinder routine application of simulation for building design.
1 BACKGROUND
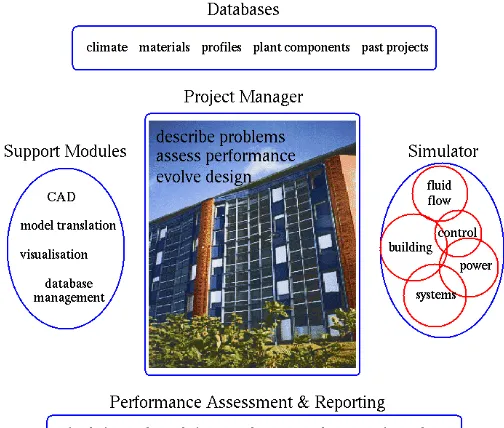
Many buildings are still constructed or remodelled without consideration of energy conserving strategies that could, in many cases, be incorporated in a cost-effective manner. For example, it is estimated that nearly 80% of new commercial buildings constructed each year are of 2,000 square meter or less in size. These buildings, as well as most single- and multifamily residential buildings, are generally designed and constructed by builders or design-build contractors, without the benefit of computerised building energy analyses and equipment sizing. To provide substantial improvements in energy consumption and comfort levels, there is a need to treat buildings, with their individual subsystems, as complete optimised entities - as indicated in Figure 1 - not as the sum of a number of separately designed and separately optimised components.
Building simulation is ideal for this because it is not restricted to the building structure itself but includes the indoor environment, while simultaneously taking into account the outdoor environment, mechanical, electrical or structural systems, and traditional and renewable energy supply systems. Building simulation can be used to characterise and assess proposed new equipment and system integration ideas, and to aid in the identification of such ideas. Simulation can thus be used for building analysis and design in order to achieve a good indoor environment in a sustainable manner, and in that sense to care for people now and in the future.
for larger firms have moved to computer design programs for the physical elements of buildings and building systems (piping, ductwork, etc.) there has been little effort by the design community to learn and apply energy analysis as a standard part of the design process. This is generally left to “specialists” at HVAC consulting firms after the building has been defined.
Figure 1: The building as an integration of energy systems
Since there are real opportunities to affect the building energy use through tradeoffs in building siting, orientation, spatial definition and envelope configuration, waiting until these have been completed, and perhaps even the HVAC and other systems are defined, can result in missed opportunities for energy savings.
To elaborate the current state-of-the-art in integrated building simulation, what follows is a summary and demonstration of one modelling system.
2 ESP-r - AN EXAMPLE OF STATE-OF-THE-ART
The ESP-r system (Environmental Systems Performance - research; Clarke 1985) has been the subject of sustained developments since 1974. The aim, now as always, has been to permit an emulation of building performance in a manner that a) corresponds to the reality, b) supports early-through-detailed design stage application and c) enables integrated performance assessments in which no single issue is unduly prominent. ESP-r is available under research (cost-free) and commercial (low cost) license from the University of Strathclyde. In both cases source code is made available.
the support applications. Most importantly, the PM supports an incremental evolution of designs as required by the nature of the design process.
Figure 2: Architecture of ESP-r showing the central Project Manager and its
support tools.
The typical starting point for a new project is to scrutinise and make ready the support databases. These include hygro-thermal and optical properties for construction elements and composites, typical occupancy profiles, pressure coefficient sets for use in problems involving air flow modelling, plant components for use in HVAC systems modelling, mould species data for use with predicted local surface conditions to assess the risk of mould growth, and climate collections representing different locations and severity. ESP-r offers database management for use in cases where new product information is to be appended.
Although the procedure for problem definition is largely a matter of personal preference, it is not uncommon to commence the process with the specification of a building's geometry using a CAD tool. ESP-r is compatible with the AutoCad (Autodesk 1989) and XZIP (Stearn 1993) systems, either of which can be used to create a building representation of arbitrary complexity (Figure 3 - left).
The PM provides coloured, textured physically correct images via the RADIANCE system (Ward 1993) and wire-frame photomontages via the VIEWER system (Parkins 1977), automatically generating the required input models and driving these two applications (Figure 3 - right).
Figure 3: Defining problem geometry using AutoCad (left) and using
RADIANCE to quantify luminance for a visual comfort/impact assessment or illuminance as input to a lighting controller (right).
As required, component networks are now defined representing HVAC systems (Hensen 1991, Aasem 1993, Chow 1995), distributed fluid flow (for the building-side air or plant-side working fluids) (Hensen and Clarke 1991, Hensen 1991) and electrical power circuits (Kelly 1996). These networks are then associated with the building model so that the essential dynamic interactions are preserved.
Control system definitions can now proceed depending on the appraisal objectives. Within ESP-r this involves the establishment of several closed or open loops, each one comprising a sensor (to measure some simulation parameter at each time-step), an actuator (to deliver the control signal) and a regulation law (to relate the sensed condition to the actuated state). Typically, these loops are used to regulate plant components, to associate these components with building zones, to manage building-side components such as blinds, and to co-ordinate flow components (e.g. window opening) in response to environmental conditions. Control loops can also be used to change portions of a problem with time (e.g. substitute alternative constructions) or impose replacement parameters (e.g. heat transfer coefficients).
For specialist applications, the resolution of parts of the problem can be selectively increased, for example:
• ESP-r's default one-dimensional gridding scheme representing wall conduction
can be enhanced to a two- or three-dimensional scheme to better represent a complex geometrical feature or thermal bridge (Nakhi 1995).
• A one-, two- or three-dimensional grid can be imposed on a selected space to
• Special behaviour can be associated with a material, e.g. electrical power
production via crystalline or amorphous silicon photovoltaic cells (Clarke et al 1996).
• Models can be associated with material hygro-thermal properties to define their
moisture and/ or temperature dependence in support of explicit moisture flow simulation and mould growth studies (Anderson et al 1996).
The PM requires that a record be kept of the problem composition and to this end is able to store and manipulate text and images which document the problem and any special technical features. It is also possible to associate an integrated performance summary with this record (Figure 4) so that the design and its performance can be assessed without having to commission further simulations.
The problem - from a single space with simple control and prescribed ventilation, to an entire building with systems, distributed control and enhanced resolutions - can be passed to the ESP-r simulator where, in discretised form, the underlying conservation equations are numerically integrated at successive time intervals over some period of time. Simulations, after some minutes or hours, result in time-series of "state information" (temperature, pressure, etc.) for each discrete region.
ESP-r's results analysis modules are used to view the simulation results and undertake a variety of performance appraisals: changes to the model parameters can then follow depending on these appraisals. While the range of analyses are essentially unrestricted, interrelating the different performance indicators (Figure 4), and translating these indicators to design changes, is problematic because of the lack of performance standards and the rudimentary level of simulation scholarship and training.
3 EXAMPLE APPLICATION: DESIGN OF EMBEDDED ENERGY SYSTEMS
The Lighthouse Building, designed by Charles Rennie Mackintosh, is the centrepiece of Glasgow's celebrations as UK City of Architecture and Design 1999. This refurbished city centre building is of major architectural significance. A specially configured portion of the building serves as a showcase for state-of-the-art technologies that demonstrate the integration of complementary passive and active renewable energy components at the urban scale.
While a more complete description can be found in (Clarke et al. 1999), the following sections outline the design process undertaken and the system configuration adopted to achieve:
i. lowest practical energy demands (without compromising building
functionality),
ii. sizing of the embedded micro-scale generation systems to match a significant
portion of these demands, and
3.1 Renewable energy systems
Implementation of renewable energy systems at the local level can be fraught with technical problems. When undertaking such tasks within an urban environment adds additional problems to a project such as impact on building aesthetics and most importantly, planning requirements which impair system performance. After careful consideration, the renewable energy systems deemed suitable and chosen for this demonstration were categorised as: type (i) are those that reduce energy demands and type (ii) are those that generate electricity to meet some of these demands. The 3 passive (type i) components were:
1. advanced glazings, including a triple glazed, double low-e coated, argon filled
component, a light redirecting component and a variable transmission component;
2. daylight utilisation through illuminance based luminaire control; and
3. transparent insulation with integral shading.
The 2 active systems (type ii) consisted of:
1. facade-integrated photovoltaic cells with heat recovery; and
2. roof mounted, ducted wind turbines with integral photovoltaic aerofoils.
Based on detailed energy simulations using the ESP-r system, it was concluded that the passive components had the potential of reducing annual energy demands by up to 64%, relative to an initial best practice compliant design hypothesis. It was also concluded that the active components had the potential to match a significant portion of the residual demand.
3.2 Evaluation methodology
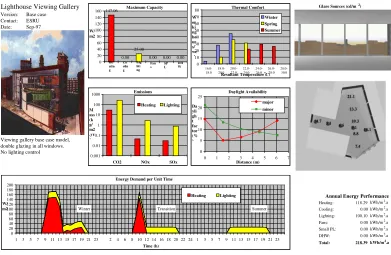
The evaluation procedures adopted adheres to a standard performance assessment method (PAM) (Clarke et al 1996) whereby computer simulation is used to determine the multivariate performance of an initial model of the building (in this case corresponding to current best practice design). The multivariate performance data are then presented in the form of an integrated performance view (IPV) as shown in Figure 4. The model is then modified by incorporating one of the renewable technologies and the overall performance re-assessed. In this way, the contribution of both passive and active renewable technologies, applied separately or jointly, may be assessed and the different possible permutations compared.
3.3 Energy demand reduction techniques
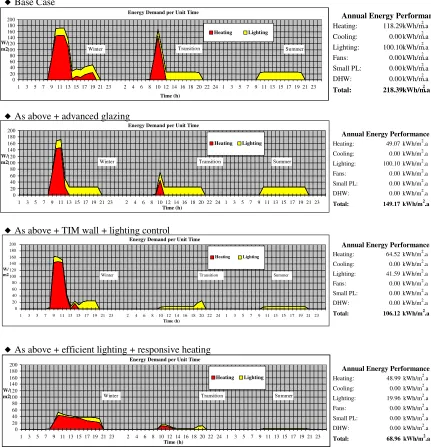
A number of reference models were developed to assess the contributions from alterations to glazing systems, the adoption of critical control strategies and the incorporation of various passive and active renewable energy technologies. The first
reference model replaced the standard double glazing with low ε coated, argon filled
triple glazing, with a centre pane U-value of 0.8 W/m2 K. This resulted in a 58%
[image:7.595.133.524.297.552.2]reduction in annual heating energy and a 31% reduction in overall energy requirements (heating plus lighting). Further reductions were achieved using daylight responsive lighting control. The addition of a south facing transparent insulated (TI) thermal mass wall reduced the duration of the heating season, with the TI wall supplying the building's heating requirements during the transitional seasons, while auxiliary heating was confined to the winter period.
Figure 4: Performance appraisal of initial design.
Lighthouse Viewing Gallery Glare Sources (cd/m2)
Version: Base case Contact: ESRU Date: Sep-97
Viewing gallery base case model, double glazing in all windows. No lighting control
Annual Energy Performance
Heating: 118.29 kWh/m2.a
Cooling: 0.00 kWh/m2.a
Lighting: 100.10 kWh/m2.a
Fans: 0.00 kWh/m2.a
Small PL: 0.00 kWh/m2.a
DHW: 0.00 kWh/m2.a
Total: 218.39 kWh/m2.a Maximum Capacity
147.06
0.00 25.00
0.00 0.00 0.00 0 20 40 60 80 100 120 140 160 He atin g Co olin g Lig hti ng Fan s SPL
DH W W/ m2 Thermal Comfort 0 10 20 30 40 50 60 70 80 16.0-18.0 18.0-20.0 20.0-22.0 22.0-24.0 24.0-26.0 26.0-28.0 28.0-30.0
Resultant Temperature (o C) W or ki ng ho ur s/ we ek Winter Spring Summer Daylight Availability 0 5 10 15 20 25
0 1 2 3 4 5 6 7
Distance (m) Da yli gh t fac tor (% ) major minor Emissions 0.001 0.01 0.1 1 10 100 1000
CO2 NOx SOx
M ass (k g/ m2 .yr ) Heating Lighting
Energy Demand per Unit Time
0 20 40 60 80 100 120 140 160 180 200
1 3 5 7 9 11 13 15 17 19 21 23 2 4 6 8 10 12 14 16 18 20 22 24 1 3 5 7 9 11 13 15 17 19 21 23
Time (h) W/
m2
Heating Lighting
Winter Transition Summer
In comparison with the initial design hypothesis, the cumulative effect of the advanced glazings, lighting control and TI facade resulted in a 45% reduction in annual heating energy, 59% reduction in lighting energy and a 51% reduction to the overall annual energy demands.
lighting energy demand and a 68% reduction in overall energy demand. Figure 5 details the energy savings and capacity reductions achieved when under-taking the various permutations adopted within this study.
Figure 5: The energy reductions achieved by the various permutations
Energy Demand per Unit Time
0 20 40 60 80 100 120 140 160 180 200
1 3 5 7 9 11 13 15 17 19 21 23 2 4 6 8 10 12 14 16 18 20 22 24 1 3 5 7 9 11 13 15 17 19 21 23
Time (h) W/
m2
Heating Lighting
Winter Transition Summer
Energy Demand per Unit Time
0 20 40 60 80 100 120 140 160 180 200
1 3 5 7 9 11 13 15 17 19 21 23 2 4 6 8 10 12 14 16 18 20 22 24 1 3 5 7 9 11 13 15 17 19 21 23
Time (h) W/
m2
Heating Lighting
Winter Transition Summer
Annual Energy Performance Heating: 118.29kWh/m2.a Cooling: 0.00 kWh/m2.a Lighting: 100.10kWh/m2.a Fans: 0.00 kWh/m2.a Small PL: 0.00 kWh/m2.a
DHW: 0.00 kWh/m2.a
Total: 218.39kWh/m2.a
Energy Demand per Unit Time
0 20 40 60 80 100 120 140 160 180 200
1 3 5 7 9 11 13 15 17 19 21 23 2 4 6 8 10 12 14 16 18 20 22 24 1 3 5 7 9 11 13 15 17 19 21 23
Time (h) W/
m2
Heating Lighting
Winter Transition Summer
Annual Energy Performance Heating: 64.52 kWh/m2.a Cooling: 0.00 kWh/m2.a Lighting: 41.59 kWh/m2.a Fans: 0.00 kWh/m2.a Small PL: 0.00 kWh/m2.a DHW: 0.00 kWh/m2.a
Total: 106.12 kWh/m2.a
Annual Energy Performance Heating: 49.07 kWh/m2.a Cooling: 0.00 kWh/m2.a Lighting: 100.10 kWh/m2.a Fans: 0.00 kWh/m2.a Small PL: 0.00 kWh/m2.a DHW: 0.00 kWh/m2.a
Total: 149.17 kWh/m2.a
Energy Demand per Unit Time
0 20 40 60 80 100 120 140 160 180 200
1 3 5 7 9 11 13 15 17 19 21 23 2 4 6 8 10 12 14 16 18 20 22 24 1 3 5 7 9 11 13 15 17 19 21 23
Time (h) W/
m2
Heating Lighting
Winter Transition Summer
Annual Energy Performance Heating: 48.99 kWh/m2.a Cooling: 0.00 kWh/m2.a Lighting: 19.96 kWh/m2.a Fans: 0.00 kWh/m2.a Small PL: 0.00 kWh/m2.a DHW: 0.00 kWh/m2.a
Total: 68.96 kWh/m2.a
As above + advanced glazing
As above + TIM wall + lighting control Base Case
As above + efficient lighting + responsive heating
3.4 Embedded renewable energy systems
[image:9.595.134.558.324.599.2]Two electricity generating renewable energy technologies were appraised and subsequently accepted for incorporation within the building. These were a photovoltaic (PV) component operating in hybrid mode to give both power and heat outputs; and ducted wind turbines (DWTs) with an integral photovoltaic aerofoil section. The hybrid PV system was incorporated within the south-facing facade, while the DWTs were positioned along the south and west-facing roof edges; south-west being the predominant wind direction in Glasgow. To maximise electricity generation, a high efficiency monocrystalline silicon component was chosen for both the hybrid PV and DWT systems. Figure 6 summarises the final performance results in the form of an IPV as produced by ESP-r.
Figure 6: Performance appraisal with active and passive renewable energy
systems applied.
Lighthouse Viewing Gallery Glare Sources (cd/m2)
Version: reference 3 opt 2 + RE Contact: ESRU
Date: Sep-97
Viewing gallery with advanced glazing in all windows. On/off lighting control, EE lighting.
TI wall.
PV hybrid + ducted wind turbines
Annual Energy Performance
Heating: 48.99 kWh/m2.a Cooling: 0.00 kWh/m2.a Lighting: 19.96 kWh/m2.a Fans: 0.00 kWh/m2.a
Total: 68.96 kWh/m2.a
DWT 25.03 kWh/m2.a
PVe 33.79 kWh/m2.a
PVh 40.91 kWh/m2.a
Maximum Capacity 48.13 0.00 12.00 41.60 58.40 38.60 0 20 40 60 80 100 120 140 160 He atin g Co olin g Lig hti ng PV e PV h D WT W/ m2 Thermal Comfort 0 10 20 30 40 50 60 70 80
16.0-18.018.0-20.020.0-22.022.0-24.024.0-26.026.0-28.028.0-30.0Resultant Temperature (o
C) W or ki ng ho ur s/ we ek Winter Spring Summer Daylight Availability 0 5 10 15 20 25
0 1 2 Distance (m)3 4 5 6 7
Da yli gh t fac tor (% ) major minor Emissions 0.001 0.01 0.1 1 10 100 1000
CO2 NOx SOx
M ass (k g/ m2 .yr ) Heating Lighting
Energy Demand per Unit Time
0 20 40 60 80 100 120 140 160 180 200
1 3 5 7 9 11 13 15 17 19 21 23 2 4 6 8 10 12 14 16 18 20 22 24 1 3 5 7 9 11 13 15 17 19 21 23
Time (h) W/ m2 Heating Lighting DWT PVe PVh
Winter Transition Summer
3.5 Results
energy demands. However, an electrical storage system is required to cater for the temporal mismatch between renewable energy supply and demand since the former is largely available out with the times of building operation.
The combination of DWTs and PV components proved to be a successful matching of renewable energy systems to meet the seasonal energy demands. The DWTs produce electricity predominately during the winter period when the PV components can contribute little. Conversely, the PV components supply power predominately during the summer period when the winds are light. The combination of the two systems gives rise to an embedded RE approach which is well suited to the climate of Glasgow.
4 SIMULATION FOR BUILDING DESIGN
Although most practitioners will be aware of the emerging building simulation technologies - and their potential for building design -, few as yet are able to claim expertise in its application. This situation is poised to change with the advent of:
• performance based standards;
• societies dedicated to the effective deployment of simulation - such as the
International Building Performance Simulation Association (IBPSA
-http://www.ibpsa.org)
• appropriate training and continuing education;
• and the growth in small-to-medium sized practices offering simulation-based
services.
One thing is clear: as the technology becomes more widely applied, the demands on simulation programs will grow. While this is welcome, in that demand fuels development, it is also problematic because the underlying issues are highly complex. Although contemporary programs are able to deliver an impressive array of performance assessments, there are many barriers to their routine application in practice. The main issues, which must be addressed, include:
• To ensure the quality of routine application in practice there is a need for an
evaluation methodology such as the one indicated earlier. In principle it should be possible to automate, at least, parts of such methodology. To a certain extent (e.g. automatic generation of design alternatives, rank ordering of design options, etc.) this is already achieved in software such as Energy-10 (Balcomb 1997).
• Since all design assumptions are subject to uncertainty, programs must be able to
operate on the basis of uncertainty bands applied (automatically) to their input and output data. Such a facility is currently under development for ESP-r (Macdonald 1996) so that performance risk may be assessed on the basis of prediction ranges resulting from uncertainty considerations applied to the input (design) parameters.
• Validation and calibration testing procedures must be agreed and routinely applied
• Program interoperability must be enabled so those design support environments
evolve in response to inter-disciplinary design needs. This was the goal of the EC's COMBINE project (Augenbroe 1992) in which a prototype Intelligent, Integrated Building Design System was developed (Clarke et al 1995). The SEMPER/ S2 project (Mahdavi et al. 1999) is another research example. Major international industry initiatives in this area are currently co-ordinated by the International Alliance for Interoperability (IAI - http://iaiweb.lbl.gov).
• A means is required to place program development on a task-sharing basis in
order to ensure the integrity and extensibility of future systems. This was the objective of the EPSRC funded Energy Kernel System (Clarke et al 1992), which sought to eliminate the inefficient theoretical and software de-coupling of current programs. A recent initiative in this area is the Modelica effort (http://www.modelica.org/) which seeks to design a physical systems modelling language for multi-domain modelling.
• In terms of the building life cycle, currently modelling and simulation is mainly
restricted to the detailed design phase. However there is a definite need for use of modelling and simulation both in earlier and later stages. Practitioners need early stage, strategic design tools. These are being developed however usually they are rule based and -therefor - restricted to single issues; for example to lighting (Groot 1999). To be able to integrate various issues as discussed above, a combination of knowledge base and simulation could well be the solution. During later stages of the building life cycle, modelling and simulation could play important roles in commissioning, auditing, control and maintenance of building systems.
• The importance of modelling and simulation and how it will benefit in an
economical and environmental context is clear. Since many people in the field are not yet aware of this, there is a necessity of an organisation such as IBPSA. It’s main role is to alleviate this problem and thus for moving this technology in everyday practice of engineers and architects.
ACKNOWLEDGEMENTS
The ESP-r system has evolved to its present form over 20 years. Throughout this period many individuals have made substantial contributions. In particular, we would like to acknowledge the contributions of some of our ESRU colleagues: Jon Hand, Milan Janak, Cameron Johnstone, Nick Kelly, Iain Macdonald, John McQueen, Abdul Nakhi, Cezar Negrao and Paul Strachan. Our hope is that the many other contributors, too numerous to mention, will be content with collective thanks.
REFERENCES
Anderson J G A, Clarke J A, Kelly N, McLean R C, Rowan N and Smith J E (1996) `Development of a technique for the prediction/alleviation of conditions leading to mould growth in houses' Final Report for Contract Number 68017 Scottish Homes, Edinburgh.
Augenbroe G (1992) `Integrated Building Performance Evaluation in the Early Design Stages' Building and Environment V27, N2, pp149-61.
Autodesk Ltd (1989) `AutoCAD Release 10 Reference Manual' Autodesk Ltd. Exeter.
Balcomb J D (1997). “Energy-10: a design-tool computer program”, in Proc. 5th International IBPSA Conference Building Simulation '97 in Prague, Vol. I, pp. 49-56, International Building Performance Simulation Association.
Chow T (1995) `Air-Conditioning Plant Components Taxonomy by Primitive Parts' PhD Thesis ESRU, University of Strathclyde, Glasgow.
Clarke J A (1985) ‘Energy simulation in building design’ Adam Hilger, Bristol and Boston.
Clarke J A, D Tang, K James and D F Mac Randal (1992) `Energy Kernel System' Final Report for GR/F/07880 Engineering and Physical Science Research Council, Swindon.
Clarke J A, Hand J W, Mac Randal D F, Strachan P A (1995) `The Development of an Intelligent, Integrated Building Design System Within the European COMBINE Project' Proc. Building Simulation `95, University of Wisconsin, Madison, USA.
Clarke J A, Dempster W M and Negrao C (1995) `The implementation of a
computational fluid dynamics algorithm within the ESP-r system' Proc. Building Simulation `95, University of Wisconsin, Madison, USA.
Clarke J A, Hand J W, Johnstone C M, Kelly N, Strachan P A (1996) `The Characterisation of Photovoltaic-Integrated Building Facades Under Realistic Operating Conditions' Proc 2nd European Conference of Architecture Berlin, 26-29 March.
Clarke J A, Hand J W, Hensen J L M, Johnsen K, Wittchen K, Madsen C and
Compagnon R (1996) “Integrated Performance Appraisal of Daylight-Europe Case Study Buildings” Proc. 4th European Conference on Solar Energy in Architecture and Urban Planning, Berlin.
Clarke J A, Hensen J L M, Johnstone C M and Macdonald I (1999). "On the use of simulation in the design of embedded energy systems," in Proc. 6th International IBPSA Conference Building Simulation '99 in Kyoto, Vol. I, pp. 113-119, International Building Performance Simulation Association.
Groot E H de (1999). “Integrated lighting system assistant.” Doctoral dissertation Eindhoven University of Technology.
"Building Simulation '91", Nice, Aug 1991, pp. 219-226, Int. Building Performance Simulation Association.
Hensen J L M (1991) "On the thermal interaction of building structure and heating and ventilating system," Doctoral dissertation Eindhoven University of
Technology.
Macdonald I (1996) `Development of Sensitivity Analysis Capability within the ESP-r PESP-rogESP-ram' PhD PESP-rogESP-ress RepoESP-rt ESRU, UniveESP-rsity of StESP-rathclyde.
Mahdavi A, Ilal M E, Mathew P, Ries R, Suter G and Brahme R (1999). “The architecture of S2” in Proc. 6th International IBPSA Conference Building Simulation '99 in Kyoto, Vol. III, pp. 1219-1226, International Building Performance Simulation Association.
Nakhi A (1995) `Adaptive Construction Modelling Within Whole Building Dynamic Simulation' PhD Thesis ESRU, University of Strathclyde, Glasgow.
Negrao C O R (1995) `Conflation of Computational Fluid Dynamics and Building Thermal Simulation' PhD Thesis ESRU, University of Strathclyde, Glasgow.
Kelly N (1996) `Electrical Power Flow Modelling in Buildings' PhD Progress Report ESRU, University of Strathclyde, Glasgow.
Parkins R P (1977) `VIEWER (the BIBLE) Users Manual' ABACUS Publication University of Strathclyde.
Stearn D (1993) `XZIP Users Manual' IES Ltd, Glasgow.