7-22-2016
Understanding the Impact of Diversity in Software
Bugs on Bug Prediction Models
Harold Valdivia-Garcia
Follow this and additional works at:http://scholarworks.rit.edu/theses
This Dissertation is brought to you for free and open access by the Thesis/Dissertation Collections at RIT Scholar Works. It has been accepted for inclusion in Theses by an authorized administrator of RIT Scholar Works. For more information, please [email protected]. Recommended Citation
Bug Prediction Models
by
Harold Valdivia-Garcia
A dissertation submitted in partial fulfillment of the
requirements for the degree of
Doctor of Philosophy
in Computing and Information Sciences
PhD Program in Computing and Information Sciences
B. Thomas Golisano College of Computing and
Information Sciences
Rochester Institute of Technology
Rochester, New York
Harold Valdivia-Garcia
Committee Approval:
We, the undersigned committee members, certify that we have advised and/or supervised the candidate on the work described in this dissertation. We further certify that we have reviewed the dissertation manuscript and approve it in partial fulfillment of the requirements of the degree of Doctor of Philosophy in Computing and Information Sciences.
______________________________________________________________________________ Dr. Meiyappan Nagappan Date
Dissertation Advisor
______________________________________________________________________________ Dr. Ernest Fokoue Date
Dissertation Committee Member
______________________________________________________________________________ Dr. Mehdi Mirakhorli Date
Dissertation Committee Member
______________________________________________________________________________ Dr. Pengcheng Shi Date
Dissertation Committee Member
______________________________________________________________________________ Dr. Emad Shihab Date
Dissertation Committee Member
______________________________________________________________________________ Dr. Joseph Hornak Date
Dissertation Defense Chair
Certified by:
______________________________________________________________________________ Dr. Pengcheng Shi Date
Nowadays, software systems are essential for businesses, users and society. At the same time such systems are growing both in complexity and size. In this context, developing high-quality software is a challenging and expensive activity for the software industry. Since software organizations are always limited by their budget, personnel and time, it is not a trivial task to allocate testing and code-review resources to areas that require the most attention. To overcome the above problem, researchers have developedsoftware
bug prediction modelsthat can help practitioners to predict the most bug-prone software
entities. Although, software bug prediction is a very popular research area, yet its industrial adoption remains limited.
In this thesis, we investigate three possible issues with the current state-of-the-art in software bug prediction that affect the practical usability of prediction models. First, we argue that current bug prediction models implicitly assume that all bugs are the same without taking into consideration their impact. We study the impact of bugs in terms of experience of the developers required to fix them. Second, only few studies investigate the impact of specific type of bugs. Therefore, we characterize a severe type of bug called
Blocking bugs, and provide approaches to predict them early on. Third,false-negative
filesare buggy files that bug prediction models incorrectly as non-buggy files. We argue
that a large number of false-negative files makes bug prediction models less attractive for developers. In our thesis, we quantify the extent of false-negative files, and manually inspect them in order to better understand their nature.
most sincere gratitude to my previous supervisor and committee member Dr. Emad Shihab for introducing me to this research area. I would also like to thank my other committee members: Dr. Mehdi Mirakhorli, Dr. Ernest Fokoue and Dr. Pengcheng Shi, for their interest and valuable feedback on my research topic. A special thanks also to Dr. Linwei Wang for her valuable discussions on the class imbalance problem in my data set.
Thanks to all my dear friends from RIT with whom I shared many good moments. In particular, I would like to thank Kevin Campusano, Catherine Ramirez (la madrina), Adonias Landa, Felivel Vasquez, Nuthan Munaiah, Priyank Kapadia and Joanna Santos for being my friends.
I am in debt to the staff and administration of the PhD Program in the Golisano College. Special thanks to Charles Gruener and Lorrie Jo for providing me the computing resource and helping me with all of the paperwork.
Thanks to my mother, Naty Garcia for her love, support and prayers. You worked so hard to give us a good education. I would be lost without you. To my beloved wife Paola, thank you for your patient and love. You make me a better person. Finally, I would like to thank my friends from my home group for sharing with me their strength and hope.
1 Introduction 11
1.1 Problems to be Addressed . . . 13
1.1.1 Thesis Structure . . . 14
2 Background 16 2.1 Software Repositories . . . 16
2.2 Software Metrics . . . 17
2.2.1 Source-code Metrics . . . 18
2.2.2 Process Metrics . . . 19
2.3 Software Bug Prediction Models . . . 20
2.3.1 Prediction Settings and Evaluation Criteria . . . 20
2.4 Kind of Software Bugs . . . 21
2.4.1 Re-opened Bugs . . . 21
2.4.2 Dormant Bugs . . . 22
2.4.3 Security and Performance Bugs . . . 22
2.4.4 High-impact Bugs . . . 22
3 Data Collection Process 24 3.0.1 Bug Report Collection . . . 24
3.1 Code and Process Metrics Collection . . . 25
3.1.1 Studied Projects . . . 25
3.1.2 Bug fix Collection . . . 26
3.1.3 Code and Process Metrics . . . 26
4 Not all Bugs are the same 29 4.1 Introduction . . . 30
4.2 Motivating example and Contributions . . . 31
4.3 Related Work . . . 32
4.4 Case Study Design . . . 35
4.4.1 Dependent Variables . . . 35
4.5 Case Study Results . . . 36
4.5.1 RQ1. Are all bugs in a software the same? . . . 36
4.5.2 RQ2. What are the consequences of considering that all bugs are the same? . . . 42
4.5.3 RQ3. How do developers define impactful bugs? and What aspects of bugs are the most important for prioritizing their fix? . . . 48
4.6 Comparison with other Linear Models . . . 49
4.7 Threats to validity . . . 51
4.8 Conclusions . . . 52
5 Characterizing Blocking Bugs 54 5.1 Introduction . . . 54
5.2 Approach . . . 57
5.2.1 Defining Blocking and Non-Blocking bugs . . . 57
5.2.2 Data Collection . . . 57
5.2.3 Factors Used to Predict Blocking Bugs . . . 61
5.2.4 Textual Factor Preprocessing . . . 64
5.2.5 Prediction Models . . . 65
5.2.6 Performance Evaluation . . . 68
5.3 Case Study . . . 69
5.3.1 RQ1. What is the impact of blocking bugs? . . . 69
5.3.2 RQ2. Do files with blocking bugs have higher complexity than files with non-blocking bugs? . . . 72
5.3.3 RQ3. Can we build highly accurate models to predict whether a new bug will be a blocking bug? . . . 76
5.4 Relaxing the Data Collection Process . . . 82
5.4.1 Prediction models using data available 24 hours after the bug report submission . . . 82
5.4.2 Dealing with the Reporter’s name factor . . . 83
5.5 Threats to Validity . . . 84
5.6 Related Work . . . 86
6 False Negative Files in Bug Prediction 90
6.1 Introduction . . . 90
6.2 Related Work . . . 93
6.3 Case Study Design . . . 94
6.3.1 Identifying False-Negative Files . . . 95
6.4 Case Study Results . . . 99
6.4.1 RQ1. Are FN-files different from TP-files? . . . 99
6.4.2 RQ2. Are the bugs affecting FN-files different from bugs affecting TP-files? . . . 102
6.5 Threats to validity . . . 107
6.6 Conclusion . . . 108
7 Conclusions and Future Work 110 7.1 Conclusions . . . 110
7.2 Future Work . . . 112
Bibliography 113
Appendix A Variability Contribution of Prediction Models 133
List of Figures
4.1 Boxplots for Developer Experience . . . 37
4.2 Distribution of the Developer Experience . . . 39
4.3 Distribution of the impact . . . 40
4.4 Developer experience for impactful and non-impactful bugs . . . 41
4.5 The four most meaningful topics (out of ten) related to impactful bugs . . 50
5.1 Converting textual factor into Bayesian-score . . . 64
5.2 Example of a Decision Tree . . . 66
6.1 Boxplots of the FN-rate for the six machine learning techniques . . . 96
6.2 Agreement among the machine learning techniques when identifying FN-files 96 6.3 Boxplots of the metrics for FN-files, TN-files and TP-files in Cassandra 1.2.0100 6.4 Boxplots of the metrics for FN-bugs and TN-bugs in Cassandra . . . 103
6.5 All categories all projects . . . 106
B.1 Topics related to impactful bugs - Part I . . . 145
B.2 Topics related to impactful bugs - Part II . . . 146
3.1 Description and aggregate metrics of 11 Apache projects . . . 25
3.2 Information on the releases studied in each of the projects . . . 27
3.3 Collected code and process metrics . . . 28
4.1 Interquartile Ranges for Developer Experience for each of the studied projects . . . 38
4.2 Relative Standard Deviation of Developer Experience at bug level . . . . 38
4.3 Average variance explained in each project when different dependent variables are used . . . 43
4.4 Average contributions across three releases of each project from each independent variable when different dependent variables are used . . . 44
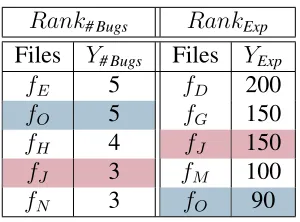
4.5 Sample - Ranking of files . . . 46
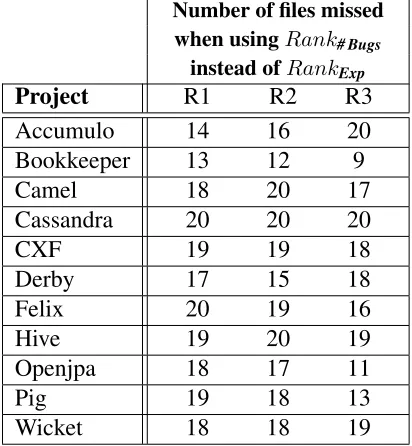
4.6 Number of missed files over three releases of each project. . . 47
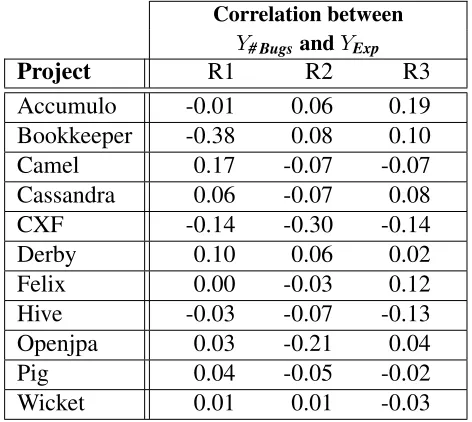
4.7 Correlation of the dependent variables for buggy files. . . 48
4.8 Spearman Rank-Order Correlation using different prediction techniques . 51 5.1 Description of the case study projects . . . 58
5.2 Summary of the collected bug reports . . . 58
5.3 Distribution of the number of blocking and non-blocking files . . . 60
5.4 Distribution of source code files across different programming languages. In each of columns three to five, we report the percentage of files that belong to a particular programming language. . . 61
5.5 Median fixing time in days and the result of the Wilcoxon rank-sum test for blocking and non-blocking bugs . . . 70
5.6 Degree of Blocking Dependency . . . 71
5.7 Median bug-fix size and the result of the Wilcoxon rank-sum test for
blocking and non-blocking bugs . . . 71
5.8 Median lack of cohesion for blocking and non-blocking files . . . 73
5.9 Median coupling for the blocking and non-blocking files . . . 74
5.10 Median cyclomatic complexity for blocking and non-blocking files . . . . 74
5.11 Median LOC for blocking and non-blocking files . . . 75
5.12 Performance of blocking files prediction models . . . 76
5.13 Performance of the decision tree models . . . 77
5.14 Predictions different algorithms . . . 79
5.15 Top Node analysis results . . . 81
5.16 Performance of the decision tree models using data collected 24 hours after the initial submission . . . 83
5.17 Number of different reporters (nominal levels) . . . 83
5.18 Comparison between Decision Tree models without and with reporter’s name . . . 84
6.1 Bug prediction outcomes using majority vote . . . 95
6.2 Bug prediction outcomes using PCA + SMOTE . . . 98
6.3 Covariance Comparison† . . . 101
Introduction
Software systems have become pervasive in modern society, and are at the backbone of our economy and daily life. We use software and computing systems in a wide variety of domains ranging from entertainment (e.g., video gaming, on-demand streaming media), communication (e.g., instant messaging and video chat applications), finance (e.g., e-commerce, internet-banking), science (e.g., nuclear simulations, climate modeling) to critical systems (e.g., air traffic control and battlefield control systems). For the past few decades, the software industry revenue has constantly increased. According to Gartner Group, in 2013, the worldwide revenue of the software vendors was approximately $407 billions [47].
This explosive growth of the software industry, is also accompanied by the ever-increasing demand for high-quality and more sophisticated software systems delivered in shortened intervals. Unfortunately, the quality of software systems is significantly affected by the occurrence of software bugs. The consequences of software bugs vary from cosmetic issues to huge economic and reputational losses, or even the loss of human life. Two prominent incidents caused by software bugs are the Therac-25 accident [79] and the Mars Climate Orbiter failure [17]. A radiation therapy machine called Therac-25 overdosed six people and caused the death of four of them due to a bug in its software. The NASA’s Mars Climate Orbiter (a $125 million spacecraft) wast lost because engineers used English units instead of metric units in the navigation software. Furthermore, in 2002 the National Institute of Standards and Technology (NIST) estimated that software bugs cost over $59.5 billion annually to the U.S. economy.
To remain competitive in the market and provide desirable levels of quality, software organizations have adopted several Software Quality Assurance (SQA) activities such code inspection [7] and testing [61]. Code inspection is a manual examination of source code performed by a group of developers other than the original authors. Software testing refers to the process of executing a piece of software under specified conditions in order to determine its correctness. Although prior studies have shown that code inspection and testing are valuable techniques in finding and reducing software bugs before a release, they are very expensive and labor-intensive activities [153, 157]. Furthermore, given that development teams are always constrained by their limited budget, personnel and time, it is almost impossible to fully inspect and test all the code that might be affected by software bugs. Therefore, researchers have developed bug prediction models to help developers to better allocate their available SQA resource to those areas of the software system which are most likely to contain bugs.
Broadly speaking, bug prediction models use supervised techniques to learn the rela-tionship between various software metrics and the bug-proneness of the software artifacts (e.g., modules, files, functions, etc). Bug prediction models are trained using software metrics that have been collected from previous releases of the software. Then, these models can be used in the following releases in order to prioritize the software artifacts based on their predicted values.
1.1 Problems to be Addressed
In brief, we can summarize the problems to be addressed as follows:
Problem Statement: Software bug prediction is one of the most popular research areas in software engineering and yet its adoption in the software industry remains limited. We identify and empirically examine three possible issues with the current state-of-the-art in bug prediction. First, the impact of software bugs are not taken into account when tailoring the models. Second, different types of severe bugs are seldom studied and characterized. Third, the large number of buggy files that are not identified by prediction models.
bug-report, bug-fix and file levels can provide insightful information to better understand their severity. In addition, we propose to build prediction models to help practitioners to identify early on whether a bug will be a blocking bug or not.
Even though prior studies have shown promising results, prediction models are not perfect and could fail in identifying buggy files. In this context, another aspect that has not been investigated in software bug prediction so far, is What are those buggy files
that prediction models incorrectly predict as bug-free files (i.e., false negative)?. The
inability to detect a large number of buggy files, might limit the adoption of bug prediction models. Therefore, in this work we quantitatively analyze buggy files incorrectly predicted (false negative) and buggy files correctly predicted (true positives) along various software metrics. Additionally, we investigate the root causes, impact and affected components of the software bugs related to false negative files.
1.1.1 Thesis Structure
The main contributions of this work are described in the following chapters:
• Chapter 2describes common concepts in Mining Software Repositories.
Addition-ally, we briefly discuss the state of the art in Software Bug Prediction related to our work.
• Chapter 3details core ideas of our approach common to the three problems to be
addressed. We describe the software project studied, data collection process and the extracted software metrics we use during our experiments.
• Chapter 4empirically shows that bugs have different impact in terms of the devel-oper experience. Then, we compare models predicting number of bugs and models predicting developer experience in terms of their ranking abilities (i.e., prioritization) and their variance explained.
• Chapter 5studies a severe type of bug calledBlocking bugsin 8 open source projects.
We build prediction models to help developers to identify such bugs early on. We also analyze the impact of blocking bugs at bug-fix and file level. Our analysis shows that files with blocking bugs are bigger, more complex, have higher coupling and less cohesion than files with non-blocking bugs.
identified by prediction models. We also found that although bothfalse negative files
and truetrue positive filesare buggy files, they are significantly different along the 8 software metrics. In a further qualitative analysis of bug reports, bug-fix commits (i.e., code changes) and mailing list discussion, we find that bugs affecting false
negative filesare similar totrue positive files.
• Chapter 7restate the problem addressed in this thesis, briefly describes the
Chapter 2
Background
2.1 Software Repositories
Building and maintaining high quality software systems is a complex task that require the coordination of many developers grouped on different software teams. During the development process, these software teams generate a huge number of artifacts such as source-code files, documentation, reported bugs, technical discussions, etc. Software teams rely on software engineering tools calledSoftware Repositoriesin order to manage these artifacts and keep track of their complete history of changes. The most widely used software repositories when developing software systems are:
• Version Control Systems (VCS).Sometimes calledSource-Code Repositoriesare
specialized database systems used to manage the code base of a software system and store every version of the source code. These tools allow developers to work simultaneously in the same code files and also provide conflict resolution mecha-nisms when there are overlaps between the changes of two developers. The smallest unit of change recorded into the source-code repository is termed acommit. Each commit has a unique identifier, the name and email of the developer who submitted the commit, the date of submission, the commit message (a textual description of the change), the list of the affected files, the actual change performed on the files (usually called patch), etc.
• Issue Tracking Systems. An Issue Tracking System is a specialized database used
to track and document software issues reported by end-users and developers. Such tracking systems also enable developers to collaboratively fix the reported issues
and keep track of their progress and status. Anissue reportis an structured record composed of several fields such as the textual description of the issue, the comments of the developers, the severity and priority of the issue, the status, etc. Issue reports include: software bugs, feature requests, enhancements and refactoring actions. When a issue report represents a software bug, we refer to it asbug report. In the remaining of this thesis, we also refer to issue tracking systems asBug Tracking
Systems (or Bug Repositories), because we exclusively use data extracted from bug
reports.
• Mailing List System.Generally speaking, a mailing list system is a software
appli-cation that broadcast e-mails among users who are subscribed to such system. In the Open Source Community, software developers widely used mailing list systems as their principal communication channel to discuss development, maintenance and organizational topics. In addition, mailing list systems offer a public environ-ment through which end-users can report symptoms of potential software bugs to developers, ask for support, new functionalities, etc.
In this work, we leverage software data from these repositories. All the metrics described in the next section are extracted mainly from the source-code and bug repositories. To extract the developers’ discussions on software bugs, we use the developers’ mailing lists.
2.2 Software Metrics
2.2.1 Source-code Metrics
These metrics are extracted directly from software artifacts (e.g., modules, subsystems, files, functions, etc). There are three sub-groups of source-code metrics: traditional (e.g., LOC, Cyclomatic [84] and Halstead [52]), object-oriented (e.g., CK metrics suite [28]) and network metrics (e.g., call-graph dependency). Many studies have extensively investigated the practical value of these metrics.
• Traditional Metrics. Lines of Code (LOC): It counts the number of lines of a software artifact. Prior studies have investigated the ranking ability of LOC [1, 40, 114, 165]. These works found that LOC is a good metric for ranking the most buggy modules. For example, Zhang et al. [165] showed that the top 20% of the largest files contains 51%-63% of the bugs. In bug prediction, LOC was reported to be a moderate/good predictor of software bugs [40, 50, 91, 114, 167].
Cyclomatic Complexity: It counts the number of independent paths in the control
flow graph of a piece of code. Although Cyclomatic Complexity is correlated to LOC [40, 100], it is still widely used as predictor of software bugs [91, 110, 113, 169, 174] and vulnerabilities [29, 137]. Halstead’s metrics: This family of metrics is based on the number of operands and operators in a piece of code. While some previ-ous research has suggested that Halstead’s metrics are effective for bug predic-tion [92, 161], other work found that they are not better than LOC or Cyclomatic Complexity [40, 100, 121]. In this work, we extensively use LOC and Cyclomatic Complexity.
• Object-oriented Metrics. Chidamber & Kemerer (CK) metrics [28] are the most popular object-oriented metrics. CK metrics are aimed at measuring the design complexity (e.g., number of methods, coupling, cohesion, etc) of objected-oriented systems at class level. Prior studies have validated the effectiveness of these metrics [8, 20, 21, 27, 50, 139] and showed their usefulness for predicting buggy classes [?, 32, 37, 110, 167]. Nevertheless, some works have suggested that CK metrics are strongly correlated to LOC [21, 22, 36, 168]. In Chapter 5, we use coupling and cohesion to assess the impact ofBlocking bugsat file-level.
• Network Metrics.These metrics take into account the structural interactions of the
different parts of a software system. They are extracted from thedependency graph
of the software system. In the dependency graph, each vertex represents asoftware
two software modules. There are two types of network metrics that can be computed for each module - (a) ego metrics that measure the local importance of the module within its neighborhood and (b) global metrics that measure the importance of the module within the whole software system. There has been considerable disagreement about the effectiveness of network metrics [82, 118, 119, 148, 170]. For example, Zimmermann and Nagappan [170] reported that network metrics are better than complexity metrics when predicting bug-prone binaries in Windows Sever 2003. On the other hand, Prateek et al. [118] found that network metrics were inferior to other source-code metrics. Additionally, it is important to mention that the generation of the dependency graph is expensive and time-consuming. Therefore, we do not consider network metrics in our work. We only include this kind of metrics in our literature review for the sake of completeness.
2.2.2 Process Metrics
Although source-code metrics have been successfully used to assess the quality of software systems, they do not take into account the impact of the development process used to implement such systems. Process metrics (sometimes called change-history metrics) are quality measurements extracted from the history of the development process.
For some time, researchers have suggested that process metrics might be good indicator of buggy software artifacts. Yu et al. [162] were among the first that used process metrics to perform bug prediction. They found that number of prior bugs is a good predictor of future bugs. Graves et al. [46] showed that process metrics suchprior number of changes
Previous studies in bug prediction also incorporated metrics extracted from the social structure of developers. Meneely et al. [90] used social network based metrics to predict bugs at file level. Shin et al. [137] provided evidence that metrics such developer activity metrics can help to localize software vulnerabilities. The developer network is generated using the history of changes of the software system. If two developers modified at least one file in common, then they are connected in the network. Similarly, studies from Microsoft [15, 116] used collaboration network metrics to investigate the impact of code ownership on software quality.
Several comprehensive studies have compared the predictive power of process and code metrics [6, 63, 106, 123]. They found that process metrics consistently outperform code metrics for bug prediction models. In Chapter 3 (Approach), we describe the process metrics used in this work and how they were collected.
2.3 Software Bug Prediction Models
Many different statistical and machine learning techniques have been proposed to learn the relationship between various software metrics (predictors) and bug-related metrics (dependent variable) extracted from the software artifacts. The most common dependent variables used in prior research are: bug-proneness (buggy/non-buggy), likelihood of having a bug, number of bugs, bug density, etc. In a survey of more than 100 papers related to software bug prediction, Shihab [132] identified approximately 70 different prediction techniques. Out of them, the following six techniques were the most widely used: Logistic Regression was used in 47% of the prior studies, Decision Trees in 26%, Linear Regression in 16%, Random Forest in 15% and SVM in 8% of the studies. We also extensively use prediction techniques in this work.
2.3.1 Prediction Settings and Evaluation Criteria
The three most widely used settings in which bug prediction models are evaluated are Cross-validation, Forward-release prediction and Cross-project prediction. InCross-validation, the data set is split into 10 parts (i.e folds) of the same size and preserving the original distribution of the classes. Then, each fold is used as the testing set for a prediction model built using the remaining 9 folds. The overall performance is calculated as the average performance of the 10 models evaluated in the testing sets.Forward-release prediction
Here the prediction model is trained using data from older releases of the software system and then evaluated on the next immediate release. InCross-project prediction, a model trained on data from one software project is used to predict bugs in another project (usually in the same domain). This approach is used when the target project is still young (i.e., it is the first release of the project) and there is insufficient data to build a prediction model.
2.4 Kind of Software Bugs
In Software Bug Prediction, only few works have studied the impact of specific types of bugs such breakage, performance, reopened and dormant bugs [26, 134, 136, 164, 172]. Similar to these studies, we also investigate a severe type of bugs calledBlockinb bugs. In this Section, we review prior studies on different types of bugs.
2.4.1 Re-opened Bugs
2.4.2 Dormant Bugs
It refers to bugs that were introduced in one release (e.g.,r.1.0) of a software system and are only discovered very late in a future release (e.g.,r.9.0). Chen et al. [26] analyzed dormant bugs in 20 open source projects written in java. The authors found that about 33% of the bugs introduced in a given release, remain undiscovered until much later in time. In addition, they found that about 20% of the bugs found in a given release were not introduced in such a release but in an old one.
2.4.3 Security and Performance Bugs
Security and performance are two critical non-functional quality attributes of software systems. Performance is the capability of a system to effectively accomplish its service with a given time-constraint and specific resources. Performance bugs are software bugs that significantly degrade the responsiveness (time to accomplish a user request) and throughput (number of tasks accomplished per unit of time) of a software system. Security is the capability of a system to prevent unauthorized access to sensitive information or computing resources [73]. Security bugs (also known software vulnerabilities) are software bugs that violate the security policy of a software system. Zaman et al. [164] compared security and performance bugs in the Firefox open source project. Their results show that security bug fixes are larger than performance bug fixes. In terms of fixing time, security bugs are fixed faster than performance bugs. In a subsequent study [163], the authors found that reproducing performance bugs is more challenging than other bugs. Zimmermann et al. [173] used logistic regression and SVM for predicting vulnerabilities in Windows Vista.
2.4.4 High-impact Bugs
Chapter 3
Data Collection Process
In order to perform our study, we extract software data from three kind of software repositories namely: Bug repository, Source-code repository and Mailing list repositories. In particular, we mine the repositories of various open source projects, since they allow public access to their repositories. Different software projects use different technologies for their Bug (e.g., Jira, Bugzilla) and Code (e.g., Subversion, GIT) repositories. Although the mining process is similar among different technologies, we developed specialized scripts for each of them, in order to handle their peculiarities. We collect bug-reports, bug-fix commits and source code files from software repositories.
The data collection process of Chapter 4 (Not all bugs are the same) and Chapter 6
(False-Negative files) are very similar. Therefore, here, we detail the software projects,
data preprocessing and software metrics shared by these two chapters. On the other hand, in this chapter, we only provide a brief description of the data collection of Chapter 5
(Blocking bugs).
3.0.1 Bug Report Collection
We queried the bug repositories using their APIs (JIRA1, Bugzilla2, Google Issue Tracker3)
in order to extract the bug reports (i.e., issues of the type Bug). We only consider closed or verified bug reports that have been marked as fixed (i.e., bug’s resolution = ‘Fixed’).
1https://developer.atlassian.com/jiradev/jira-apis
2https://code.google.com/p/support/wiki/IssueTrackerAPI 3https://wiki.mozilla.org/Bugzilla:REST API
For our blocking bugs study, we extract 14 bug report metrics. Therefore, in Chapter 5, we provide a more detailed description of the data sets, preprocessing and the extracted bug report metrics also known asfactors.
3.1 Code and Process Metrics Collection
3.1.1 Studied Projects
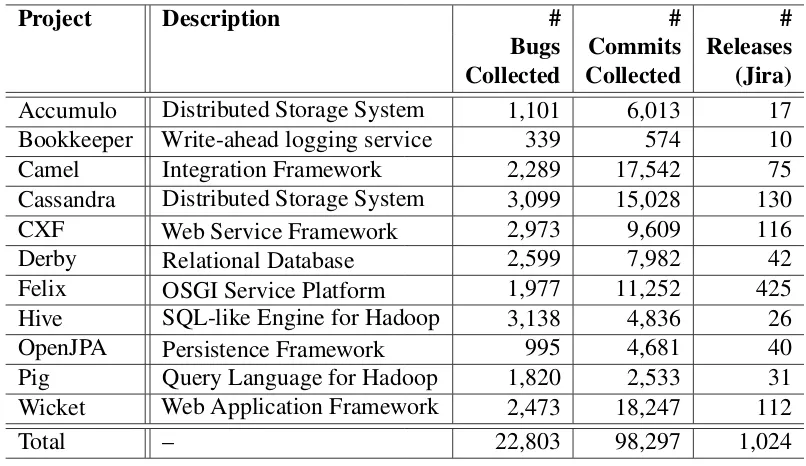
[image:27.612.102.505.414.647.2]For our analyses in Chapter 4 and Chapter 6, we collect data from 11 Apache Software Foundation projects. Theses projects are written in Java and cover a wide range of domains (i.e., SQL and NoSQL databases, Enterprise, Service and Web frameworks, Data Analytics platforms, etc). Table 3.1 summarizes the size of our projects in terms of bug-reports, commits and number of releases. We leveraged code, process and bug metrics from the bug tracking system and source-code repository of each project. In total, we extracted 22,803 bug reports and 98,297 commits. We selected these projects because they are long-lived and large projects that have been used in prior works [26, 125, 126].
Table 3.1: Description and aggregate metrics of 11 Apache projects
Project Description # # #
Bugs Commits Releases Collected Collected (Jira)
Accumulo Distributed Storage System 1,101 6,013 17
Bookkeeper Write-ahead logging service 339 574 10
Camel Integration Framework 2,289 17,542 75
Cassandra Distributed Storage System 3,099 15,028 130
CXF Web Service Framework 2,973 9,609 116
Derby Relational Database 2,599 7,982 42
Felix OSGI Service Platform 1,977 11,252 425
Hive SQL-like Engine for Hadoop 3,138 4,836 26
OpenJPA Persistence Framework 995 4,681 40
Pig Query Language for Hadoop 1,820 2,533 31
Wicket Web Application Framework 2,473 18,247 112
3.1.2 Bug fix Collection
Abug-fixis a commit that fixes a reported bug. It is a common practice among developers
to include bug information in their commits. To collect bug-fixes, we link bug reports and their related commits. Our linkage process follows an approach similar to previous studies [125,126]. First, we checked out all therelease-branchesfrom the code repositories. Then, we extracted all commits that contain bug-related words (e.g., bug, fixed, failed, crashed, etc) and potential bug-identifiers (e.g., BUG-567) in their commit messages. In order to validate the collected commits, we checked that the bug-identifier in the commits are present in the data set of bug reports previously extracted from the bug repositories. Since, we are dealing with more than one release-branch, we are at risk of including duplicate commits in our data set. For example, we found two identical commits fixing bug-issue CAMEL-8091 in release-branchescamel-2.13.xand camel-2.14.x. The aforementioned situation can inflate our metrics and therefore bias/invalidate our conclusions. Therefore, we removed all duplicate commits that have the same message and patch (diff) information. Additionally, bug-fix commits were filtered to remove non-source code (e.g., XML, html, log, documentation files, etc) and unit-test files that were part of the bug-fix commit.
Out of the 22,803 bug reports extracted, 17,032 were successfully linked to at least one commit. Similarly, out of the 98,297 commits extracted, 21,899 were successfully linked to at least one bug report. It is important to emphasize that in our experiments we only consider bug reports and commits that were explicitly linked.
3.1.3 Code and Process Metrics
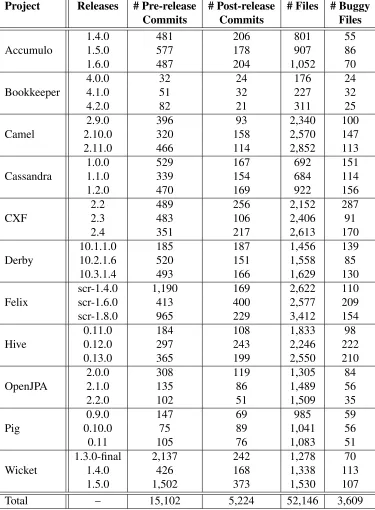
We use the source-code and commit history (from code repositories) along with the bug report information to extract code and process metrics from files in three major releases of each software project. Not all the projects deal with the releases in the same way. Some projects use only tags, whereas others use only branches (although they periodically merge back into master). In the latter case, the code repositories record neither the creation date nor the starting point of a release-branch. Therefore, to identify the releases and their release-dates, we use the release information posted in the websites of the bug repositories. We use the closest commits to the release-dates as the identifiers of the releases in the code repositories. We selected the three consecutive major releases with the largest number of post-release bug-fixes, in each project (see Table 3.2 for a detailed list of the major releases). Given two consecutive releasesAandB, we consider the middle point between
Commits Commits Files
1.4.0 481 206 801 55
Accumulo 1.5.0 577 178 907 86
1.6.0 487 204 1,052 70
4.0.0 32 24 176 24
Bookkeeper 4.1.0 51 32 227 32
4.2.0 82 21 311 25
2.9.0 396 93 2,340 100
Camel 2.10.0 320 158 2,570 147
2.11.0 466 114 2,852 113
1.0.0 529 167 692 151
Cassandra 1.1.0 339 154 684 114
1.2.0 470 169 922 156
2.2 489 256 2,152 287
CXF 2.3 483 106 2,406 91
2.4 351 217 2,613 170
10.1.1.0 185 187 1,456 139
Derby 10.2.1.6 520 151 1,558 85
10.3.1.4 493 166 1,629 130
scr-1.4.0 1,190 169 2,622 110
Felix scr-1.6.0 413 400 2,577 209
scr-1.8.0 965 229 3,412 154
0.11.0 184 108 1,833 98
Hive 0.12.0 297 243 2,246 222
0.13.0 365 199 2,550 210
2.0.0 308 119 1,305 84
OpenJPA 2.1.0 135 86 1,489 56
2.2.0 102 51 1,509 35
0.9.0 147 69 985 59
Pig 0.10.0 75 89 1,041 56
0.11 105 76 1,083 51
1.3.0-final 2,137 242 1,278 70
Wicket 1.4.0 426 168 1,338 113
1.5.0 1,502 373 1,530 107
[image:29.612.117.492.120.630.2]period for releaseB. In total, we ended up with a data set of 52,146 files from all the
projects, out of which only 3,609 were buggy files (⇡7%).
For each of the major releases, we collected code and process metrics during the
pre-release period. More precisely, we checked out the code repository at each release and extracted variouscode metricsfrom all the source-code files using the commercial tool called UNDERSTAND4. To extract process metrics from the commits in the pre-release, we developed several Python and Bash scripts. For thepost-release period, we collected twobug-related metrics(dependent variables) from the bug-fixes: number of bugs and developer experience (defined as the number of previous bug-fixes contributed by a developer). We calculated thenumber of bugsin the source-code files of a particular release by counting the number of different bug-reports related to the bug-fixes that modified such files. To calculate thedeveloper experience, we first identified the developers who fixed at least one post-release bug by extracting their emails from the bug-fixes. Then, for each developer, we count the number of previous bug-fixes from their first contribution until their last contribution before the release-date. When a file was modified by more than one developer, we use the average experience. It is important to mention that if a file has not been touched after the release-date, we set the post-release metrics to zero. Table 3.3 provides a brief description of the collected metrics.
Table 3.3: Collected code and process metrics
Metrics Description
Code LOCCyclomatic Lines of CodeCyclomatic Complexity
Process
Churn Cumulative code churn
Added Churn Added lines in the churn
Deleted Churn Deleted lines in the churn
# Commits Number of pre-release commits
# Dev Number of Developers
# Pre-release Bugs Number of fixed pre-release bugs
Bug-related # BugsDev Experience Num. post-release bugsNumber of previous commits made by the developer
Not all Bugs are the same
There have been decades of research on prioritizing software entities to help practitioners allocate their QA resources using prediction models. However, in most of the past work the dependent variables of the prediction models have simply been the number of bugs in a file. Such a dependent variable assumes that all bugs are the same. We qualitatively analyze the bugs from 11 open source projects and find that the impact of the bugs are very diverse. In our study, we choose one possible dimension of diversity: experience of the developers fixing the bugs defined as their previous fixes to the project. We find that indeed different bugs are fixed by developers with different levels of experience. Then we examine the impact of using just the number of bugs versus the developers experience as dependent variable in the prediction model. We measure the impact on prioritization of entities, and the relationship between previously studied independent variables and the dependent variables. We find that the prioritization of files is considerably different when we use different dependent variables. We also find that when the dependent variable changes, the relative importance of the independent variables remain the same, but the variability explained in the model drops considerably. Thus we find compelling evidence that the choice of dependent variable greatly affects the prediction model. Hence, we conclude that research needs to be conducted into determining the dependent variables that practitioners most care about, and come up with approaches to capture and mine this
information.
4.1 Introduction
Software systems have become ubiquitous in our daily life for use in applications ranging from entertainment (e.g., games, multimedia), to finance (e.g., e-commerce, internet-banking) as well as mission critical systems (e.g., aircraft navigation). In the report released by the National Institute of Standards and Technology in 2002, they estimate that the cost of inadequate testing infrastructure to software users is $38.3 Billion [143]. In order to prioritize the inadequate testing infrastructure, software engineering researchers have developed bug prediction models. More than 100 papers on bug prediction have been published in the past decade [132]. Using the prediction models, the researchers aim to prioritize bug prone software entities such as subsystems, files, function, etc. to guide the quality assurance (QA) activities of practitioners.
The majority of prior work on bug prediction is along two dimensions - (1) to investi-gate the usefulness of different independent variables or software metrics (product [174], process [108] and organizational [116] metrics) in order to improve the performance of the bug prediction models, and (2) to investigate the usefulness of different prediction techniques (statistical techniques like linear regression [55, 108, 174] or machine learning techniques like Random Forest [48, 63, 86]).
When it comes to what the researchers are trying to predict (dependent variable in the prediction models) all the prior work predict only one of four things - (a) whether an entity has a bug or not [53, 69, 72], (b) what is the likelihood that an entity has a bug [5, 49, 110], (c) how many bugs are present in each entity [114, 170, 174], or (d) what is the bug density of each entity [72, 109, 145]. Some recent studies examine the impact of specific types of bugs such as breakage [134, 136], performance [164], reopened [172] and blocking bugs [151]. However, past studies consider thatall bugs are the sameor predict only one type of bug (and consider all bugs of that type to be equal as well).
The only exceptions are the studies based on the effort datasets published in the PROMISE repository [95]. In these datasets (for example CHINA, Nasa93, and OpenEf-fort), the dependent variable is the effort in hours spent on each entity. However, since then nobody has curated a dataset with effort spent (possibly because it might be really difficult to track/measure effort). The only research on effort is with respect to effort-aware models, where researchers challenge the assumption that different entities require the same effort for testing or inspection [5, 6, 63, 86]. Even such studies on effort-aware models do not examine the possible differences among bugs.
empirically examine, if indeed there is diversity among bugs. If there is diversity, then we want to examine empirically if the diversity has an impact on the prediction models, and what we learn from them. Such an empirical evidence, will not only be a more scientific way to establish a problem in the current state-of-the-art, but also serve to quantify the extent of the problem.
4.2 Motivating example and Contributions
It may have been a reasonable assumption to consider all bugs as the same in early bug prediction research. However, with decades of research already completed and millions of dollars spent on bug prediction research, it may now be time to relax this assumption and examine its impact more closely. Consider for example that there exists a large file A with 10 simple bugs that could be fixed by a novice developer, and there exists a small file B with a blocking bug that can delay the release of a software which can only be fixed by a highly experienced developer. Past bug prediction research would prioritize A before B, because it has more bugs. Effort aware research would prioritize A over B, because file A is larger and hence requires more effort to inspect. However, a developer would like to prioritize B over A since the bug in file B is of a more serious threat.
Software teams are always constrained by limited time, budget and personnel, and therefore we should start investigating what developers care the most when prioritizing their QA resources. Such investigation may require many iterations and should be performed only if there is a problem with current bug prediction models. While, it might seem obvious that all bugs are not the same, in this chapter, we find hard evidence that such a assumption has serious consequences on bug prediction and prioritization. The rest of this section lists our contributions:
• We conduct a case study on 11 open source projects, where we mine and link the
bug repository data to the code repository data, in order to examine our goal.
• From quantitatively analyzing the case study subjects we find that indeed not all bugs are the same in terms of the experience required to fix them (RQ1-a). For example, in Cassandra project, the developer experience at the 25th percentile is 20 previous fix commits, while at the 75th percentile is 920 previous bug-fix commits.
• From qualitatively analyzing the bugs in the case study subjects we find that the
• We also find that the prioritization of entities (files) based on different dependent
variables are vastly different (RQ2-b). For example, in Cassandra, the top 20 files with the most bugs has no file in common with the top 20 files that require a high degree of experience in the codebase.
• Finally, we find that when the dependent variable changes in a prediction model,
the relative contribution of the independent variables to the variance explained in the model remain the same. Additionally, the actual variance explained changes drastically when the dependent variable changes. For example, in one of our case studies (Cassandra), the prediction model based on number of bugs, explains 44% of the variance whereas the prediction model based on the developer experience explains only 6%.
4.3 Related Work
Software Metrics: Prior work on bug prediction uses a wide variety of product level metrics derived from the source code such as LOC, Cyclomatic Complexity and object oriented metrics [50, 110, 174]. Other studies include process metrics (e.g., prior bugs, prior changes, developer information, etc) in their models [55, 90, 106, 108]. These metrics are used as independent variables in the bug prediction models. In this chapter, we consider two code metrics (LOC, Cyclomatic Complexity) and one process metric (Churn) as our independent variables. Although the aforementioned studies use a large number of independent variables, we think our three independent variables are enough to address our research questions, since past work has shown the importance of size and churn metrics [126]. The way we are different from previous work is in the fact that, we consider developer experience as dependent variable instead of number of bugs.
described in Section 4.4.1). Note that in our study we use the developer experience metric as an alternate dependent variable, but we are not advocating everyone to switch to this metric, but rather pointing out the importance of choosing the appropriate metric.
Variability in SE data Software engineering data is highly skewed and has a large amount of variability. Therefore, prediction models built using heterogeneous data from one project may not generalize well 1) over time, 2) at different granularity levels, 3) to subsets within the project and 4) to other projects [10, 35, 93, 117]. The main difference with our work is that we neither split the data into smaller subsets along the independent variables (i.e., pre-dictor space) nor analyze their variability. Instead, we analyze and compare the variability of two dependent variables: number of bugs and developer experience.
Effort-aware Models Code inspection is a costly and yet very important QA activity during software development. Previous studies [5, 63, 86] have pointed out that allocating QA resources based oninspection effortrather thannumber of bugsmight be more cost-effective. Arisholm et al. [5, 6] suggested that inspection effort is roughly proportional to the size of the inspected file. Therefore, researchers such as Mende et al. [86] and Kamei et al. [63] proposed models to predict the relative treatment effort of a module. The relative treatment effort is defined as number of bugs in a module over the effort required to inspect such module. Following Arisholm et al.’s suggestion [5], other researchers used the size of the module as a proxy metrics of inspection effort [63, 86]. Our work differs from these previous studies in that we use the experience that a developer has before fixing a bug as dependent variable. We use number of previous fix commits performed by a developer as a proxy measure of experience. Our goal is not to determine a new prioritization technique, but rather shed light on the fact that depending on what metric we use for prioritization, we will get different files that need QA effort. Therefore, we want our work to spur the discussion on dependent variables and which ones may be the most appropriate for a particular stakeholder.
More recently, Mo et al. [101] proposed an architectural model called DRSpaces to identify novel hotspot patterns. Although the authors found that the occurrence of such hotspots increase the maintenance cost and effort in terms of error-proneness and change-proneness, their work does not directly predict error-proneness neither change-proneness. In this chapter, we do not focus on predicting files with architectural smells. Rather, we investigate how the prioritization of files changes when using developer experience instead of number of bugs as the dependent variable.
that these high-impact bugs have high severity and seem to be related to requirement problems. Zaman et al. [163, 164] analyzed different characteristics (e.g., triage and fix time, experience) between security and performance bugs. Zimmermann et al. [173] and Shin et al. [137] use traditional, organizational and developer activity metrics to build vulnerability prediction models. Shihab et al. [134] investigated reopened bugs in Eclipse. They found that the time of re-opened bugs is twice or more longer than the fixing-time of non-reopened bugs. Zimmermann et al. [172] also investigated re-opened bugs in Windows Vista and Windows 7. They performed a survey to identify possible causes of reopened bugs. The authors showed that bugs reported by customers and during system testing are more likely to be reopened.
More recently, researchers studied two special type of severe bugs: blocking and dormant bugs. Following an approach similar to [134], Valdivia-Garcia and Shihab [151] studied blocking bugs in six open-source projects. Even though that blocking bugs represent less than 5% of the total number of bugs, the authors found that such bugs require 15-40 more days to be fixed compared with non-blocking bugs. Chen et al. [26] conducted a study to analyze dormant bugs in 20 open source projects. Their analysis showed that about 33% of the bugs introduced in a given release are discovered very late in future releases. They also found that fixes of dormant bug involve more LOC than those of non-dormant bugs, even though they are fixed faster and by more experienced developers.
All of the above works investigate types of bugs with different impact on software systems and propose specialized models to predict them. This is an indication that not all bugs may be the same, and that some bugs may be more important than others. However, the goal of these papers was not to show that bugs can be different. Instead, the goal was to study one specific type to bug. In our work, we gather evidence on the extent and impact of different bugs in terms of the experience of developers that fix such bugs.
Severity Prediction: There are also works focused on bug severity prediction [76,77,144]. These works are related to automatically identifying the severity level (e.g., trivial, minor, major, etc) of a new bug report during the bug triaging process. In this chapter, we do not focus on predicting the severity or any such characteristic of bugs. Instead we want to differentiate the bugs that are linked to software entities in current prediction models.
4.4 Case Study Design
In this section, we discuss in more detail the metrics we use as dependent variables. The list of the eleven software projects used as case studies in our empirical study, and the data collection process can be found in Chapter 3.
4.4.1 Dependent Variables
In this section, we describe the two dependent variables we use for our analysis, and provide a brief motivation for why we use them.
Number of bugs: As the name suggests, this dependent variable captures the total num-ber of bugs in an entity. This dependent variable has been used in many of the past studies [46, 113, 114, 130, 170, 174]. In our study, we use this dependent variable as the baseline. We compare how the prediction models and prioritization (in RQ2-a and RQ2-b respectively) for developer experience differ from the baseline.
Developer experience: We measure the experience of the developer fixing a bug by counting the number of fix commits contributed by the developer before the release-date. If a bug has been fixed by two or more developers, we use the mean value. Our intuition is that the experience of the developer can capture the cost of fixing a bug. More experienced developers, may have more limited time, cost more to employ, and could therefore work on more difficult bugs. Thus we believe that experience of developer could be an interesting dimension to examine the diversity of bugs. Prior works have used similar metrics to measure experience [103, 134, 164].
hope that as researchers, we will begin exploring more meaningful dependent variables for practitioners.
Certainly we could have included other dependent variables like bug-fix size, time to fix a bug or the severity/priority of a bug. However, even though we could have just as easily collected these variables from our data, we decided not to. Past research has shown that severity/priority fields in bug trackers are not used appropriately by developers [11]. Also time to fix bugs, currently is calculated as the time between when a bug is opened and when a bug is closed. Thus a long bug-fix time could either mean that the bug is so difficult that it has taken a long time, or that a bug is so insignificant that no one bothered to fix it. There are similar reasons for not considering bug-fix size as dependent variable. Although bug-fix size could be related to bug-cost, it might not reflect the real fixing-cost (e.g., program understanding, testing costs, etc). If there was a more accurate way to measure the bug-fix size or bug-fix time (as the effort data sets in PROMISE repository have), we would have done that. However, until there are serious threats (like the ones explained above), in such metrics, we refrain from using them in our study, since the goal of this chapter is to examine if there is a problem in the current state-of-the-art in bug prediction models. We do not want to make any conclusions from possibly flawed and/or non-representative data. Once software projects collect such information, it would be easy to add that to our analysis. We hope that the study in this chapter might provide the necessary motivation into collecting effort and other such similar metrics in software projects for each bug fix.
4.5 Case Study Results
4.5.1 RQ1. Are all bugs in a software the same?
RQ1-a. Quantitative Analysis
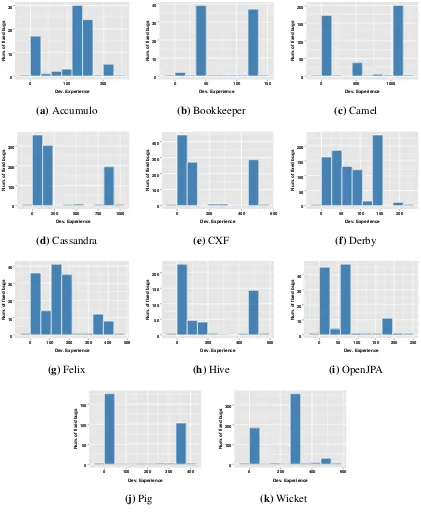
Approach. For the quantitative analysis, we examine the dependent variable developer experience as the characteristic along which we compare the bugs. Also we examine the bugs not at the file-level, but at the bug-level (i.e., we use the experience of the developers who fix the bugs). Given that developer experience is a cumulative metric, developers fixing bugs in early releases will have less experience than the same developers fixing bugs in recent releases. Therefore, in this RQ, we did not consider all the bugs since the beginning of the project, but instead we analyze the bugs of the latest release. For our analysis, we use box plots to examine if all bugs are the same, and use the relative standard deviation to examine the extent to which bugs differ.
10 100 1,000
Accumulo Bookkeeper Camel Cassandra CXF Derby Felix Hive Openjpa Pig Wicket
De
v. Experience
Figure 4.1: Boxplots for Developer Experience
Results. In Figure 4.1, we plot the developer experience before fixing the bugs in each project, which results in a boxplot. From the boxplots in Figure 4.1, it is clear that not all bugs in each project are the same in terms of the experience of the developer fixing the bug. This is evident from the wide distribution that is visualized in the boxplots. If we had gotten boxplots where distribution of the values were narrow, then we can make the claim that all bugs are similar. However, that is not the case in any of the projects.
Table 4.1: Interquartile Ranges for Developer Experience for each of the studied projects
Accumulo Bookkeeper Camel Cassandra CXF Derby Felix Hive OpenJPA Pig Wicket Dev. Experience 14 75 558 900 436 104 114 483 76 336 0
In order to more robustly evaluate the extent to which bugs differ, we calculated the Relative Standard Deviation (RSD). The RSD quantifies how large is the variability of the developer experience fixing a bug, when compared to its mean. The RSD also allows us to compare the dispersion of the developer experience across different projects. For example, consider two projectsAand B that have average developer experiences of 60 and 200
previous fix commits, and standard deviations of 30 and 40. Although the deviation forA
is smaller than forB, the variability forA(50%) is larger than for B (20%).
Table 4.2 shows the RSD calculated for our proposed dependent variable in each of the projects. We can observe that the variability for our developer experience metric is relatively high, with values ranging from 50% (Bookkeeper) to 129% (Cassandra).
Table 4.2: Relative Standard Deviation of Developer Experience at bug level
Project Dev. Experience
Accumulo 54%
Bookkeeper 50%
Camel 88%
Cassandra 129%
CXF 117%
Derby 70%
Felix 77%
Hive 111%
Openjpa 99%
Pig 113%
Wicket 70%
0 10 20
0 100 200
Dev. Experience
Num. of fix
ed b
(a)Accumulo
0 10 20
0 50 100 150
Dev. Experience
Num. of fix
ed b
(b)Bookkeeper
0 50 100
0 500 1000
Dev. Experience
Num. of fix
ed b (c)Camel 0 100 200 300
0 250 500 750 1000 Dev. Experience
Num. of fix
ed b ugs (d)Cassandra 0 100 200 300 400
0 200 400 600
Dev. Experience
Num. of fix
ed b ugs (e)CXF 0 50 100 150 200
0 50 100 150 200 Dev. Experience
Num. of fix
ed b ugs (f)Derby 0 10 20 30 40
0 100 200 300 400 500 Dev. Experience
Num. of fix
ed b ugs (g)Felix 0 50 100 150 200
0 200 400 600
Dev. Experience
Num. of fix
ed b ugs (h)Hive 0 10 20 30 40
0 50 100 150 200 250 Dev. Experience
Num. of fix
ed b ugs (i)OpenJPA 0 50 100 150
0 100 200 300 400 Dev. Experience
Num. of fix
ed b ugs (j)Pig 0 100 200 300
0 200 400 600
Dev. Experience
Num. of fix
ed b
ugs
[image:41.612.93.514.105.623.2](k)Wicket
values, suggesting that the project has a relatively large number of bugs fixed by novice developers. The second group is closer to medium-large values, suggesting that a large number of bugs is fixed by developers with high experience in the project.
Summary. We find that in all of the 11 projects there exists quantitative evidence to show that not all bugs are the same in terms of the developer experience required to fix such bugs.
RQ1-b. Qualitative Analysis
Approach. For the qualitative analysis, we manually inspect the bug reports and bug-fix commits related to post-release bugs in order to identify their impact. Similar to prior work on bug categorization [141], we classify the impact of a bug into six disjointed categories: Data Corruption (Corrupt), Performance Degradation (Perf), Hang, Crash, Incorrect Functionality (Incorrect) and Other. In our study, we randomly selected 352 of 4,211 post-release bugs to have a 95% confidence level and 5% confidence interval1. For
more details about the impact categorization, we refer the reader to Tan et al. [141].
0.0 0.1 0.2 0.3 0.4
Corrupt Perf Hang Crash Incorrect Other
Impact
P
er
centa
g
e of b
[image:42.612.164.444.380.588.2]ugs (%)
Figure 4.3: Distribution of the impact
Results. In Figure 4.3, we show the distribution of the different impacts. As we can observe from the figure, the dominant impacts are Crash and Incorrect Functionality,
contributing to 44% and 41% of the bugs respectively. Although the other categories are proportionally smaller, together they account for about 15% of the bugs, which is a considerable portion. In addition, bugs in such categories are still real problems that can have catastrophic consequences for the users (e.g., bugs that cause data loss). For example, we found a bug in Cassandra that was causing the utilityupgradesstablesto purge active data in a production system2.
We also investigate the relationship between the kind of impact and the developer experi-ence required to fix bugs. Therefore, we split the bugs into two groups: impactful(data corruption and performance degradation) andnon-impactful(hang, crash and incorrect functionality) bugs, and then we compare them in terms of their developer experience using the Wilcoxon rank-sum test. The results show that there is no statistically significant difference between developer experience (p-value of 0.31) forimpactfulandnon-impactful
bugs. To complement our results, we plot the developer experience for these two groups in Figure 4.4. From the figure, we can observe thatnon-impactfulbugs have higher developer experience and variability thanimpactfulbugs. However, it is important to note that data corruption bugs have higher developer experience on median than thenon-impactful-bugs.
0 200 400 600
Corrupt Perf Hang Crash Incorrect
De
veloper Experience
Impactful Non−impactful
Figure 4.4: Developer experience for impactful and non-impactful bugs
Summary. Therefore, from the distribution of the impact categories in this RQ, we find that not all bugs cause the same type of impact (failure) to users.
4.5.2 RQ2. What are the consequences of considering that all bugs
are the same?
Motivation. Current bug prediction models can help software teams to prioritize their QA resources by predicting the likelihood or number of bugs in an entity. Prediction models are also used to better understand the relationship between independent variables and dependent variables. Such analysis can help practitioners to identify independent variables that contribute the most to the prediction (i.e. most important variables), and whether they significantly improve the performance of the models. Moreover, since organizations are always constrained by limited time, budget and personnel, they might be interested in prioritizing their buggy entities not only based on number of bugs but also on other dependent variables that better reflect their constraints. Given that in RQ1, we found that not all bugs are the same, in this question we want to investigate if the relationship between independent and dependent variables as well as the prioritization significantly change when using developer experience as dependent variable instead of number of bugs. We break up this RQ into two sub-questions:
RQ2-a: Does changing the dependent variable have an impact on the prediction models?
Approach. To answer this question, we build linear regression models to predict the dependent variables that we defined in Section 4.4.1: number of bugs (Y# Bugs) and developer
experience (YExp). We normalize the independent variables (LOC, Cyclomatic Complexity,
and Churn) to better understand their effects on the dependent variables. We also normalize the dependent variables to ease comparison of independent variables across models with different dependent variables for the same release of the same project.
To analyze the impact of changing the dependent variable, we calculate the variance explained by each of the models and the variability contribution of the independent variables in each of the models. Similar to prior work [126], we use the Lindemen, Merenda and Gold (LMG) method to measure the contribution of LOC, Cyclomatic Complexity and Churn to the variability explained by our models (i.e.,R2). In essence the idea behind LMG
is: first to build the same model for all possible orderings of the independent variables. For exampleM1 :y=f(x1, x2)and M2 : y = f(x2, x1)represent the same model but
ordering. Then, use the average contribution over the orderings as the contributions of the independent variables.
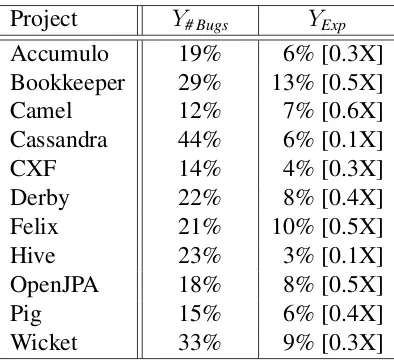
Table 4.3: Average variance explained in each project when different dependent variables are used
Project Y# Bugs YExp
Accumulo 19% 6% [0.3X]
Bookkeeper 29% 13% [0.5X]
Camel 12% 7% [0.6X]
Cassandra 44% 6% [0.1X]
CXF 14% 4% [0.3X]
Derby 22% 8% [0.4X]
Felix 21% 10% [0.5X]
Hive 23% 3% [0.1X]
OpenJPA 18% 8% [0.5X]
Pig 15% 6% [0.4X]
Wicket 33% 9% [0.3X]
Results. Table 4.3 summarizes and compares the average variance explained by the prediction models in all the projects. Here, we consider modelY# Bugs as our baseline to
perform the comparison. We can obverse that the variance explained by theYExpmodel is
consistently smaller than that ofY# Bugsmodel (⇡0.1-0.6times smaller). This result implies
Table 4.4: Average contributions across three releases of each project from each indepen-dent variable when different depenindepen-dent variables are used
Prediction Models
Project Features Y# Bugs YExp
Accumulo XLOC 39.3% 41.0%
XCC 38.7% 40.6%
XChurn 22.0% 18.3%
Bookkeeper XLOC 39.9% 36.9%
XCC 34.5% 31.6%
XChurn 25.6% 31.5%
Camel XLOC 47.5% 46.1%
XCC 47.6% 47.7%
XChurn 4.9% 6.2%
Cassandra XLOC 34.6% 38.1%
XCC 38.7% 43.1%
XChurn 26.7% 18.8%
CXF XLOC 36.5% 38.4%
XCC 38.4% 46.5%
XChurn 25.1% 15.1%
Derby XLOC 44.1% 48.6%
XCC 42.9% 39.6%
XChurn 13.0% 11.8%
Felix XLOC 38.1% 44.4%
XCC 30.8% 29.0%
XChurn 31.1% 26.5%
Hive XLOC 49.0% 47.8%
XCC 47.6% 47.6%
XChurn 3.4% 4.6%
OpenJPA XLOC 37.7% 36.9%
XCC 48.7% 47.6%
XChurn 13.6% 15.6%
Pig XLOC 28.4% 45.2%
XCC 23.1% 32.5%
XChurn 48.5% 22.3%
Wicket XLOC 34.9% 34.9%
XCC 30.9% 31.2%
More precisely, we report the average variability contribution of the three releases for each of the projects. For example the average contribution of LOC in Accumulo when the dependent variable is number of bugs is reported to be 39.3% in Table 4.4. We found that the average total variability (R2) explained in Accumulo over the three releases is 19% (see
Table 4.3) when the dependent variable is number of bugs. This means that the independent variable, LOC, contributed 39.3% towards the 19% of the variability explained. A detailed information about the built models (i.e., coefficients, contributions, variance explained and statistical significant) for all of the projects and releases can be found in Appendix A.
Discussion. While prior works have found that process metrics outperform product met-rics [46, 63, 106, 108], we find that churn consistently has the least relative contribution (as shown in Table 4.4). They only exception is Pig, in which Churn has the highest contribu-tion forY# Bugs. Also, the order of importance among LOC, CC and Churn does not change
even when the dependent variable changes. This implies that irrespective of the depen-dent variable chosen, the contribution of the independepen-dent variables to the total variability explained remains the same. Therefore, our current understanding of the relationship between various bug prediction metrics (independent variables) and the number of bugs as dependent variable may not change when the dependent variables change. This finding in an excellent reason why we should not assume the obvious and instead empirically examine any assumption, as we have done in this chapter.
Summary. When we use different dependent variables in bug prediction models, we find that the variance explained by such models significantly changes. This result implies that when dependent variables change, the current set of SE metrics (independent variables), may not enough to explain a considerable portion of the variability in the data, and therefore researchers need to come up with new metrics that can explain the variability in datasets when different dependent variables are used. At the same time, we find that the relative contribution (i.e., order of importance) of independent variables remain the same in both models.
RQ2-b. Does prioritization of entities based on different dependent variables pro-duce similar results?
Approach. In this RQ, we tailor and analyze rankings of buggy entities based on number of bugs and developer experience. For each of the releases, we first sort the files by the number of bugs per file (Y# Bugs) in the post release phase. Alternatively, we sort the files
based on the experience of the developer(s) fixing the bugs in a file (YExp) as calculated in