© TÜBİTAK
doi:10.3906/elk-1805-84 h t t p : / / j o u r n a l s . t u b i t a k . g o v . t r / e l e k t r i k /
Research Article
A new failure protection algorithm for circuit breakers using the power loss of
switching arc incidents
Behnam FEIZIFAR,, Ömer USTA∗,
Department of Electrical Engineering, Faculty of Engineering, İstanbul Technical University, İstanbul, Turkey
Received: 13.05.2018 • Accepted/Published Online: 06.03.2019 • Final Version: 15.05.2019
Abstract: The principal function of circuit breakers (CBs) is to isolate a portion of the power network from the rest of it in a timely manner following an opening command. Any failure in the opening operation of CBs, especially following a fault condition, will almost certainly result in a catastrophic event. Therefore, the issue of failure detection of CBs is essential and has a vital role in power system protection. This paper presents a novel power-based algorithm for failure detection of CBs. The power loss of CBs due to an arcing event increases as the arcing time gets longer. The arcing time of CBs increases with defective operations originating from any failure or malfunction for different reasons. The proposed method uses the power difference between the input and output terminals of CBs to calculate the power loss due to an arcing event, which can then be used to estimate the arcing energy. A trip signal is initiated whenever the estimated arcing energy for a single opening operation reaches a predefined trip level, which shows a failure in CB operation. This predefined trip value is related to the integration of the maximum power capacity of the CB during an opening operation time. Computer simulation studies conducted to analyze the performance of the proposed technique demonstrate that the algorithm is capable of discriminating between normal and abnormal arcing energies and thus identifying malfunctions or failures in the opening operations of CBs.
Key words: Arcing energy, arc model, arcing time, circuit breaker, failure detection
1. Introduction
The objectives of a protection system are to detect and locate the fault and initiate a trip signal for the right circuit breaker (CB) to isolate the fault. CBs are needed to achieve the final objective of a protection system. In the case of a CB failure, the protection system’s response to a fault is ineffective and this results in a critical situation for the protected network. In this regard, any failure or malfunction in the opening operations of a CB needs to be detected as quickly as possible. Typical reasons for malfunctions or failures of CBs include operating mechanism failures; degradation of external insulation; failures due to voltage transients; misapplications; failures in resistors, capacitors, and current transformers; animal interferences; manufacturing or maintenance errors; and failures in the internal dielectric and interrupter [1]. In this sense, a comprehensive failure detection technique is needed to detect any failure resulting from any of the above-mentioned causes and to produce a trip signal for upstream CBs to prevent the occurrence of catastrophic consequences in the power system.
Condition monitoring is defined as the process of evaluating certain parameters of equipment for identi-fying a breach from threshold values, which indicates a developing fault. It is used to predict the maintenance
∗Correspondence: [email protected]
times of equipment. In the case of CBs, the number of interruptions, sum of the interrupted currents, and operation time can be monitored in order to determine appropriate maintenance times [2].
Failure detection is the process of identifying a failure occurrence, even without knowing the root cause of the failure. In the literature, the mechanical condition of CBs has been analyzed for detecting abnormal conditions using vibration analysis, signal processing, and decision-making algorithms [3]. Moreover, continuous vibration monitoring for CBs was proposed, which analyzes a number of vibration samples collected during each opening or closing operation and compares them to signatures for detecting deviations in time and frequency domains [4]. Also, acoustic diagnosis of CBs has been used to identify mechanical malfunctions, wear of contacts, and other abnormal conditions [5]. Furthermore, an expert system has also been applied for failure detection of CBs using acoustic signals. In this regard, the decomposition of voiced and feature extraction of acoustic signals has been performed in the time domain [6].
A numerical overcurrent protection function for breaker failure protection of CBs was proposed to enhance the function of breaker failure protection. Overcurrent protection logic requires the measurement of the current after CB operation to check whether it is interrupted or not. If the current is not interrupted within a predefined time delay, then it will be evaluated as a CB failure. However, the overcurrent relay cannot distinguish between permissible and nonpermissible arcing times during CB operation [7,8].
Some of the most effective features of the CB’s coil current have been detected based on the trip and close coil current signals. The disparities of these detected features corresponding to healthy operations of CBs have been captured and categorized. Therefore, failure detection of CBs has been performed using the most affected features of the CB’s coil current waveform [9]. On the other hand, the authors recently proposed a protection algorithm for CBs that uses the total harmonic distortions of arcing voltages to discriminate between the healthy and faulty operations of CBs [10].
Failure diagnosis is the process of pinpointing one or more root causes of a failure in order to choose an adequate corrective action. In this regard, the mechanical condition of CBs has been analyzed using mechanism dynamic features and artificial neural networks (ANNs) [11]. Also, vibration signatures from healthy and faulty CBs have been represented by wavelet features and an ANN has been used to classify these features for CB failure detection [12]. Energy entropy of empirical mode decomposition and a support vector machine (SVM) were used to analyze the features of vibration signatures to detect failures of CBs with more promising results compared to those obtained from wavelet analysis [13]. Furthermore, a SVM model based on a genetic algorithm has also been developed to identify optimal parameters of the SVM with more precise outcomes compared to those obtained from the combination of the ANN and SVM [14]. The combination of a wavelet packet and SVM was also applied for detecting failures of CBs using vibration analysis [15]. The methods based on vibro-acoustic measurements for protection of CBs are nonintrusive but their main drawback is that they can be affected by vibro-acoustic noises in industrial environments and hence their protective outcomes can be distorted.
of failures. Finally, insulation failures of CBs have been diagnosed using electromagnetic pulse signals generated by high-frequency partial discharges [20].
This paper introduces a protection algorithm for CBs based on the power loss of switching arc incidents. The algorithm utilizes the sampled values of voltage across the CB and current going through the CB to measure the instantaneous power during arcing conditions. This power is then used for estimating the arcing energy. An abnormal arcing energy during an opening operation is an indication of malfunction or failure in CB operation. The method is capable of detecting any malfunction or failure that causes abnormal arcing energy. Therefore, it provides a comprehensive protection scheme for CBs and can be implemented within a real-time framework.
2. Modeling and simulation of circuit breaker operation in EMTP-RV framework
Whenever a CB operates and opens its contacts, an electric arc forms between its separating contacts due to high current interruption and high temperature, which ionizes the medium. An electric arc that produces nonlinear conductance is the basis for CB modeling. There are two fundamental arc models in the literature proposed by Cassie and Mayr [21,22].
The Cassie model is the first arc model introduced in 1939, which represents the change in arc conductance in high-current regions as follows:
1 Gc
dGc
dt =
1 τc
( v2
v2 0
−1 )
= 1
τc (
i2
v2 0G2c
−1 )
, (1)
where Gc is the arc conductance,t is time, τc is the arc time constant,v is the arc voltage,v0 is the constant
section of arc voltage, andiis the arc current related to the Cassie model.
The Cassie arc model represents an electric arc channel with fixed quantities of temperature, current density, and electric field intensity. In this model, the variation of arc conductance is in accordance with the arc cross-section and the release of energy that occurs by convection.
The Mayr model is the second arc model, introduced in 1943, which represents the change in arc conductance in low current regions as follows:
1 Gm
dGm
dt =
1 τm
( vi P0−
1 )
= 1
τm (
i2
P0Gm− 1
)
, (2)
whereGm is the arc conductance,tis time, τm is the arc time constant,vis the arc voltage,iis the arc current, andP0 is the constant power loss due to arc event related to the Mayr model. The Mayr model assumes a high
amount of changes in arc temperature despite constant size and shape of the arc column. Therefore, the main principle behind the release of energy is thermal conduction. A generalized arc model was introduced in 1993 based on two basic arc models as follows [23]:
1
G=
1 Gc
+ 1
Gm
. (3)
Figure 1. Implementation of the generalized arc model in EMTP-RV using TACS.
A transient recovery voltage (TRV)-adjusting branch including a resistor, an inductor, and a capacitor has been also utilized in parallel with the arc conductance to simulate the transient oscillations that occur following the end of arc extinction. The electrical equivalent circuit of the CB model is shown in Figure 2 [24].
TRV Branch
R
L C
G
Arc Model Branch
Figure 2. A CB model using the generalized arc conductance and TRV branches.
The simulation study consists of a short line fault (SLF) for analyzing the CB operating condition. In order to perform this task, EMTP-RV has been utilized. A SLF has been simulated on a single-phase network including a 17.32 kV AC voltage source (30 kV line to line) connected to a power frequency reactance, a TRV-adjusting branch, and a time-delaying capacitance on the source side.
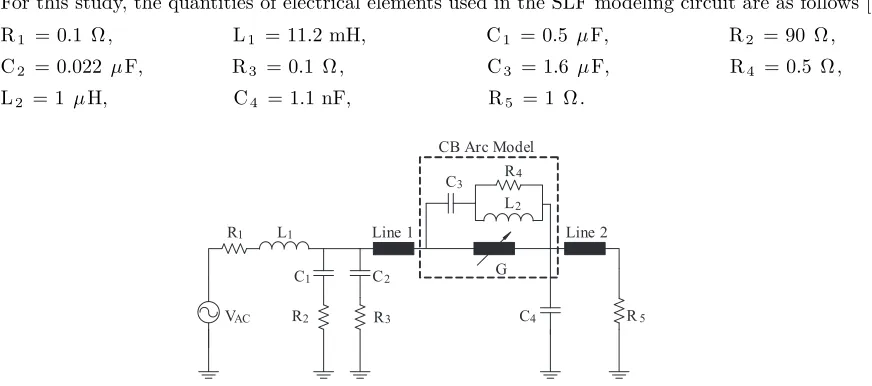
[image:4.612.223.385.421.575.2]For this study, the quantities of electrical elements used in the SLF modeling circuit are as follows [24]:
R1 = 0.1 Ω, L1 = 11.2 mH, C1 = 0.5 µF, R2 = 90 Ω,
C2 = 0.022 µF, R3 = 0.1 Ω, C3 = 1.6 µF, R4 = 0.5 Ω,
L2 = 1 µH, C4 = 1.1 nF, R5 = 1 Ω.
VAC
R1 L1
C1 C2
R2 R3
Line 1 Line 2
R4
L2 C3
C4 CB Arc Model
[image:5.612.93.529.95.288.2]R5 G
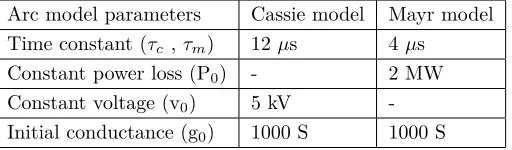
Figure 3. Simulated circuit diagram for the SLF modeling of a 30 kV CB.
The electrical characteristics of the modeled CB are listed in Table 1 [25]. The tie-lines (lines 1 and 2) are represented using the constant parameter line model and related parameters are listed in Table 2 [24]. The constant parameters of the generalized arc model for the modeled CB are listed in Table 3 [26]. These arc parameters are assumed for the minimum oil-type CB. However, in the case of having different arc parameters, the response of the algorithm remains stable as both the trip level and estimated arcing energy will be affected. The sampling frequency of the simulation study is set to 10 MHz and the simulation time of 100 ms is selected, which is 5 cycles of the power system frequency. The fault current occurs at 0 ms and the modeled CB opens at 40 ms to interrupt the SLF current.
Figure 4a illustrates the voltage and current signals associated with the modeled CB opening at 40 ms to isolate the SLF. The arc voltage starts to develop and it lasts about 4 ms before the arc extinguishes. After the mechanical opening operation, the current signal cannot be interrupted immediately because of the ongoing arcing event and it continues to the point of arc extinction. After the arc extinction, the voltage signal recovers with the related oscillations due to the TRV. The TRV is eliminated after about one cycle of the power system frequency. Ultimately, the current signal goes to zero after 4 ms following the arc extinction. It is obvious that while the CB is fully closed, the voltage across its terminals is zero. On the other hand, when the CB is fully open, the current going through the CB goes to zero after small oscillations due to the TRV. Therefore, only during the arcing event both voltage and current signals are nonzero and that results in arcing power.
Figure 4b shows the case where the arc duration has been increased due to the electrical wear of the CB’s contacts. In this case, the arcing voltage and current continue for more than a half cycle of the power system frequency. As the arcing time is still less than the maximum permissible arcing time, the operation is a successful interruption.
Figure 5b shows the case where the arc is consistent due to the complete breakdown of the CB. This situation might be caused by any of the reasons mentioned in the introduction. In this condition, the arcing voltage and current signals never vanish and the arcing time persistently increases. This is a dangerous condition for the health of CBs and protected networks, which needs to be detected as fast as possible.
Table 1. Technical specifications of the simulated CB.
Technical features Description
CB type SBK 36 mc 1000 (low-oil-volume)
Rated voltage 30 kV
Rated breaking capacity 1000 MVA
Rated current 1250 A
Rated frequency 50 Hz
Rated breaking current 19.2 kA RMS
Rated making current 49 kA PEAK
[image:6.612.181.428.347.411.2]Maximum permissible arcing time 15 ms
Table 2. Constant parameters of the simulated lines.
Line parameters Line 1 Line 2
Line length 105 m 700 m
Resistance 0.0003Ω/m 0.0003Ω/m
Characteristic impedance 260Ω 450 Ω
[image:6.612.179.435.461.536.2]Propagation speed 2.9E+8 m/s 2.9E+8 m/s
Table 3. Arc constant parameters of the simulated CB.
Arc model parameters Cassie model Mayr model
Time constant (τc ,τm) 12µs 4µs
Constant power loss (P0) - 2 MW
Constant voltage (v0) 5 kV
-Initial conductance (g0) 1000 S 1000 S
Meanwhile, it is worth mentioning that the voltage and current signals obtained from simulation studies illustrated in Figures 4 and 5 are in accordance with those measured from real-time tests presented in [27-29].
3. Failure protection of circuit breakers
3.1. Overcurrent relay for failure detection of circuit breakers
0 10 20 30 40 50 60 70 80 90 100 Time (ms) -6 -4 -2 0 2 4 6 8
(a) Voltage and current signals
Voltage Current eg atl o V (pu ) – t ne rr u C (pu )
0 10 20 30 40 50 60 70 80 90 100
Time (ms) -6 -4 -2 0 2 4 6 8
(b) Voltage and current signals
[image:7.612.67.548.91.244.2]Voltage Current V ol ta ge (pu ) – Curre nt (pu )
Figure 4. Voltage and current signals of the CB interrupting the SLF current. (a) First case study: a successful interruption with normal operation time. (b) Second case study: a successful interruption with one restrike.
0 10 20 30 40 50 60 70 80 90 100
Time (ms) -6 -4 -2 0 2 4 6 8
(a) Voltage and current signals
Voltage Current e ga tl o V (pu ) – t ne rr u C (pu )
0 10 20 30 40 50 60 70 80 90 100
Time (ms) -6 -4 -2 0 2 4 6 8
(b) Voltage and current signals
[image:7.612.66.550.305.465.2]Voltage Current Volt age (pu ) – Current (pu )
Figure 5. Voltage and current signals of the CB interrupting the SLF current. (a) Third case study: a faulty interruption with two restrikes. (b) Fourth case study: an unsuccessful interruption.
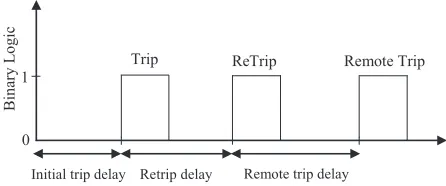
The retrip time of a failed CB can be practically performed after another time delay, which includes the initial trip time and CB operation time. The remote tripping needs one more time delay, which includes retrip time, relay operating time, CB operating time, and CB reset time. The timing sequence of overcurrent protection for initial trip, retrip, and remote trip commands is depicted in Figure 6.
0 1 Bi n ary L o g ic
Initial trip delay
Trip ReTrip Remote Trip
Retrip delay Remote trip delay
[image:7.612.194.417.604.697.2]However, as was mentioned in the introduction, the overcurrent protection logic is not capable of distinguishing between permissible and nonpermissible arcing times and thus it considers a faulty interruption of the CB like in the 3rd case shown in Figure 5a as a successful operation.
3.2. Power-based algorithm for failure detection of circuit breakers
The CB’s manufacturers define the maximum period for which a CB can tolerate an arcing event during each opening operation. It is called the maximum permissible arcing time, which usually ranges from 15 ms to 25 ms for different types of CBs. The measurement of CB arcing times is a complicated task [2]. For this reason, a new strategy is proposed in this section, which indirectly evaluates the CB arcing time using the integration of CB arcing power during each opening operation. In this manner, the integration of CB arcing power is used to calculate the CB arcing energy corresponding to each arcing duration. In this way, different values of arcing energies reflect different arcing durations.
The arcing power of the CB can be estimated by measuring the power difference between the input and output terminals of CB as follows:
∆p(t) =vcb(t)icb(t), (4)
where vcb(t)is the instantaneous voltage across the terminals of CB and icb(t) is the instantaneous current of CB.
When a CB is fully closed⇒vcb(t) = 0, icb(t)̸= 0
When a CB is fully open⇒vcb(t)̸= 0, icb(t) = 0 }
⇒∆p(t) = 0. (5)
Under arcing condition⇒vcb(t)̸= 0, icb(t)̸= 0⇒∆p(t)̸= 0. (6)
As stated before, Eqs. (5) and (6) prove that the arcing power of the CB only exists during arcing conditions. By using this innovative measurement idea, time synchronization to power system frequency is not needed. Time synchronization to power system frequency is not an easy task, especially during power system transient conditions.
The proposed algorithm can be executed with the following steps.
(a) Measurement of instantaneous arcing power The numerical implementation of the power measure-ment can be performed using the following formula, which estimates the arcing power of the CB using the sampled values of voltage and current signals:
∆p[sTs] =vcb[sTs]icb[sTs], (7)
wherevcb is the instantaneous voltage across the input and output terminals of the CB,icb is the instantaneous current passing through the CB, sis the sampling index, andTs is the sampling period.
A moving average (MA) filter is utilized to make an average of the measured arcing power as the input sequence and produce a smooth output sequence as follows [30]:
pM A[sTs] = 1 N
0
∑
j=N−1
where ∆pis the instantaneous arcing power as input data, PM A is the filtered instantaneous arcing power as output data, jis the sampling index of arcing power, andN is the window length of the MA filter.
The output sequence of the MA filter contains a smooth arcing power for the proposed algorithm. It is used to make more reliable decisions for protection of CBs.
(b) Normalization of arcing power The instantaneous arcing power can be normalized using the following equation:
pN[sTs] =
pM A[sTs] max(pM A)
. (9)
The normalization of power is needed to maintain the maximum amplitude of arcing power at 1 pu. In this case, one can correspond different values of arcing times to different arcing energies. Thus, the algorithm can distinguish between normal and abnormal arcing times by evaluating the corresponding values of arcing power and energy.
(c) Protection trip criteria The trip value of failure protection varies for different types of CBs and is initially determined for each type of CB using the following equation:
F DT = n−1
∑
s=0
|pNmax[sTs]|, (10)
wherepN max is the maximum normalized arcing power corresponding to the maximum permissible arcing time. The arcing energy for each opening operation can be evaluated by integrating the measured instantaneous arcing power over time as follows:
Pint= n−1
∑
s=0
|pN[sTs]|. (11)
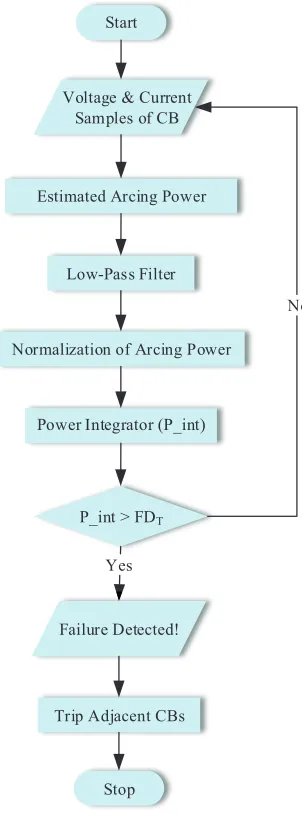
Whenever the integrator output reaches the trip level, it indicates a failure in the opening operation of the CB. In this situation, a trip command could be sent to the original CB immediately to make sure that it has completely failed. Furthermore, a remote trip signal will be forwarded to the upstream CB. Figure 7 shows the flowchart of the proposed failure protection algorithm.
4. Computer simulation studies
In this section, the responses of both the overcurrent relaying function and power-based algorithm for CB failure protection are analyzed using computer simulation studies. The circuit diagram applied for the SLF modeling in Figure 3 is used in the performance analysis. The length of the MA window is taken as 1 ms including 10,000 samples by considering 10 MHz as the sampling frequency. As mentioned earlier, the SLF current starts at 0 ms and the modeled CB operates at 40 ms to interrupt the SLF. The retrip function of overcurrent protection is not considered in the simulation studies and therefore the remote trip time is chosen as 100 ms, which is 60 ms after the initial trip signal.
Start
Voltage & Current Samples of CB
Estimated Arcing Power
Normalization of Arcing Power
Power Integrator (P_int)
P_int > FDT
Stop
No
Yes Low-Pass Filter
Failure Detected!
[image:10.612.219.370.92.499.2]Trip Adjacent CBs
Figure 7. Flowchart of the proposed power-based failure protection algorithm for CBs.
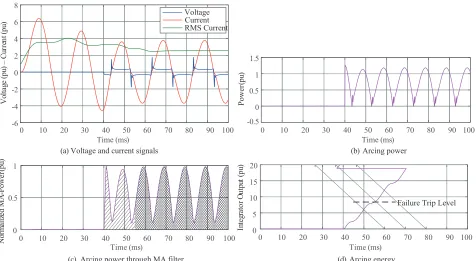
Figure 8a shows the instantaneous values of CB voltage, CB current, and moving RMS current for the case where the CB is able to isolate the SLF current within its normal operating time. Figure 8b shows the arcing power of the CB related to this case study with the arcing time of 3.3 ms, which is less than the maximum permissible arcing time. Figure 8c illustrates the related arcing power through the MA filter, in which the high-frequency oscillations are successfully removed. The normal operation time is defined as the period between the initiation of the trip command and the first half period of current signal (first zero-crossing of current). In this situation, the arcing energy is 2.175 (pu ms), which is less than the failure trip value as seen in Figure 8d. Therefore, the algorithm does not produce a remote trip command.
0 10 20 30 40 50 60 70 80 90 100 -1
0 1 2
0 10 20 30 40 50 60 70 80 90 100
0 0.5 1
0 10 20 30 40 50 60 70 80 90 100
Time (ms) Time (ms) Time (ms) Time (ms) 0 5 10 15 20
0 10 20 30 40 50 60 70 80 90 100
-6 -4 -2 0 2 4 6 8
(a) Voltage and current signals
Voltage Current e ga tl o V (pu ) – t ne rr u C (pu
) RMS Current
(b) Arcing power
P
ow
er
(pu
)
(c) Arcing power through MA filter
A M de zil a mr o N -P ow er (pu )
(d) Arcing energy
[image:11.612.68.547.95.365.2]t up t u O r ot ar ge tn I (pu )
Figure 8. Response of the proposed power-based algorithm to the 1st case study.
0 10 20 30 40 50 60 70 80 90 100
-0.5 0 0.5 1 1.5
0 10 20 30 40 50 60 70 80 90 100
0 0.5 1
0 10 20 30 40 50 60 70 80 90 100
Time (ms) Time (ms) Time (ms) Time (ms) 0 5 10 15 20
0 10 20 30 40 50 60 70 80 90 100
-6 -4 -2 0 2 4 6 8
(a) Voltage and current signals
Voltage Current e gat lo V (pu ) – t ne rr u C (pu
) RMS Current
(b) Arcing power
Power
(pu
)
(c) Arcing power through MA filter
A M de zil a mr o N -Power (pu )
(d) Arcing energy
t upt u O r ot ar get nI (pu )
[image:11.612.67.550.411.682.2]Figure 9a illustrates the instantaneous values of CB voltage, CB current, and moving RMS current for the case where the CB is interrupting the SLF current with a longer duration of arc. Figure 9b shows the arcing power of the CB related to this case study with the arcing time of 12.8 ms, which is still less than the maximum permissible arcing time. Figure 9c shows the related arcing power through the MA filter. This abnormal condition can occur due to the degradation and aging of the equipment. In this condition, the first attempt for current interruption has failed. Therefore, the current interruption is performed within the second half period of current waveform. In this case, the arcing energy is 7.855 (pu ms), still lower than the failure trip level as depicted in Figure 9d. Therefore, the algorithm does not initiate a trip signal.
On the other hand, the moving RMS value of interrupted current signal for the 2nd case study is illustrated in Figure 9a. In this situation, since the RMS value of fault current goes to zero at 72 ms, the overcurrent protection still does not issue a remote trip command as well.
Figure 10a depicts the instantaneous values of CB voltage, CB current, and moving RMS current for the case where the CB is interrupting the SLF current with a longer arc duration compared to the 2nd case study. Figure 10b shows the arcing power of CB related to this case study with arcing time of 22.5 ms, which is beyond the maximum permissible arcing time. Figure 10c shows the related arcing power through the MA filter. This abnormal arcing can occur due to the excessive degradation or aging of equipment. In this condition, the first and second attempts for current interruption in the half periods of current signal fail. Hence, the current interruption is executed in the third half period of current. The single hatched area in Figure 10c illustrates the maximum permissible arcing energy corresponding to the maximum permissible arcing time, whereas the cross hatched area illustrates the extra energy produced by longer duration of arc originating from a failure in the CB operation. In this condition, the arcing energy is calculated as 13.347 (pu ms), which is greater than the failure trip level as seen in Figure 10d. Therefore, the proposed protection algorithm issues a remote trip signal within about 20 ms after the initial trip command to isolate and protect the faulty CB against further damage. On the other hand, the moving RMS value of the interrupted current signal for the 3rd case study is shown in Figure 10a. Despite the proposed algorithm, since the RMS value of fault current goes to zero at 82 ms, the overcurrent protection logic still does not initiate a remote trip command in this situation.
Figure 11a displays the instantaneous values of CB voltage, CB current, and moving RMS current for the case where the CB has failed to interrupt the system short circuit current and therefore the arcing event continues. Figure 11b shows the arcing power of CB related to this case study with the arcing time continuously increasing above the maximum permissible arcing time. Figure 11c shows the related arcing power through the MA filter. This situation indicates a complete breakdown of the CB and needs to be detected as fast as possible. The estimated arcing energy has sharply increased and breached the failure trip level as shown in Figure 11d. As a result, the proposed algorithm initiates a remote trip signal within about 20 ms after the initial trip to clear the fault and isolate the failed CB.
On the other hand, the moving RMS value of interrupted current signal for the 4th case study is illustrated in Figure 11a. In this condition, the RMS value of fault current does not go to zero before 100 ms. Therefore, the overcurrent protection logic issues a remote trip signal within 60 ms after the initial trip to isolate the SLF and failed CB.
0 10 20 30 40 50 60 70 80 90 100 0
0.5 1
0 10 20 30 40 50 60 70 80 90 100 Time (ms) Time (ms) Time (ms) Time (ms) 0 5 10 15 20 0 10 20 30 40 50 60 70 80 90 100 -6 -4 -2 0 2 4 6 8
(a) Voltage and current signals
Voltage Current e gat lo V (pu ) – t ne rr u C (pu
) RMS Current
(b) Arcing power
Power
(pu
)
(c) Arcing power through MA filter
A M de zil a mr o N -Power (pu )
(d) Arcing energy
t upt u O r ot ar get nI (pu )
0 10 20 30 40 50 60 70 80 90 100 -0.5
0 0.5 1 1.5
[image:13.612.65.549.109.369.2]Failure Trip Level
Figure 10. Response of the proposed power-based algorithm to the 3rd case study.
0 10 20 30 40 50 60 70 80 90 100 -0.5
0 0.5 1 1.5
0 10 20 30 40 50 60 70 80 90 100 0
0.5 1
0 10 20 30 40 50 60 70 80 90 100 Time (ms) Time (ms) Time (ms) Time (ms) 0 5 10 15 20 0 10 20 30 40 50 60 70 80 90 100 -6 -4 -2 0 2 4 6 8
(a) Voltage and current signals
Voltage Current e ga tl o V (pu ) – t ne rr u C (pu ) RMS Current
(b) Arcing power
P
ow
er
(pu
)
(c) Arcing power through MA filter
A M de zil a mr o N -P ow er (pu )
(d) Arcing energy
t up t u O r ot ar ge tn I (pu )
Failure Trip Level
[image:13.612.68.544.410.671.2]of the 3rd and 4th case studies go beyond the maximum permissible arcing time of the CB, the corresponding arcing energies also exceed the failure protection trip level. Thus, the algorithm detects these cases as failures of the CB. These situations indicate that either the CB has failed to clear the arc within the specified arcing time or has permanently failed. For this reason, the algorithm immediately initiates a trip command for the original CB to double check if it has completely failed, and in the case that the failure is persistent, a trip signal will be forwarded to adjacent CBs for the isolation of the faulty CB and fault clearance, as expected.
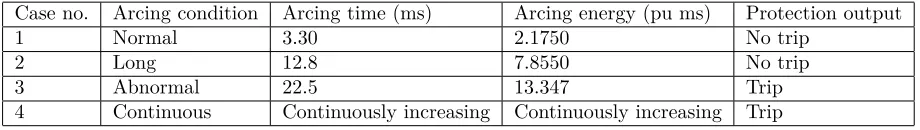
Table 4. Responses of the proposed algorithm to different case studies.
Case no. Arcing condition Arcing time (ms) Arcing energy (pu ms) Protection output
1 Normal 3.30 2.1750 No trip
2 Long 12.8 7.8550 No trip
3 Abnormal 22.5 13.347 Trip
4 Continuous Continuously increasing Continuously increasing Trip
Now a comparison between the performances of overcurrent protection logic and the new algorithm shows that the responses of the overcurrent protection to the 1st and 2nd case studies are the same as the responses of the power-based algorithm. In these situations, as the current signal is interrupted in the first and second half periods of current waveform, the overcurrent protection does not produce any trip command as expected. In other words, the original CB has operated successfully.
On the other hand, the responses of overcurrent protection and the power-based algorithm are completely different for the 3rd case study. In this condition, the overcurrent protection logic does not initiate any trip command because the RMS value of the current signal is interrupted before the remote trip time of overcurrent protection. Unlike the overcurrent protection logic, the power-based method does consider this condition as a failure in the operation of the CB. This is expected because the maximum permissible arcing time and therefore the related energy have breached the failure trip level. Therefore, the new algorithm detects this situation as a CB failure to protect the network from any upcoming consequence. Finally, the responses of both overcurrent protection function and power-based algorithms to the 4th case study are the same as expected because this case shows a permanent failure in the operation of CB.
5. Conclusion
In this work, a new power-based algorithm for the protection of CBs against failures is proposed, which uses the power loss of the CB due to arcing incident to identify any malfunction or failure in CB operation. The integration of power loss over time during each opening operation has been used as a health index for distinguishing between the healthy and faulty operations of CBs. In other words, any malfunction or failure that produces an abnormal arcing time during a CB operation can be detected indirectly by considering the corresponding arcing power and energy.
The real-time arcing voltage and current measurements will include higher frequency components com-pared with the simulation studies. However, the MA low-pass filter used in the proposed algorithm will certainly remove high-frequency components and distortions from the measured signals and will provide more reliable data for the protection decision-making. Finally, the algorithm has the capability of real-time implementation.
References
[1] IEEE. Guide for Investigation, Analysis, and Reporting of Power Circuit Breaker Failures. IEEE Std. C37.10-2011 (Revision of IEEE Std. C37.10-1995). New York, NY, USA: IEEE, 2010. doi: 10.1109/IEEESTD.2010.6107460 [2] Toshiba Corporation. Instruction Manual, Overcurrent Protection Relay GRE110. Ver. 5.3. Kanagawa, Japan:
Toshiba Corporation, 2013.
[3] Lai ML. Mechanical failure detection of circuit breakers. IEEE Transactions on Power Delivery 1988; 3 (4): 1724-1731. doi: 10.1109/61.193977
[4] Hoidalen HK, Runde M. Continuous monitoring of circuit breakers using vibration analysis. IEEE Transactions on Power Delivery 2005; 20 (4): 2458-2465. doi: 10.1109/TPWRD.2005.855486
[5] Runde M. Acoustic diagnosis of high voltage circuit-breakers. IEEE Transactions on Power Delivery 1992; 7 (3): 1306-1315. doi: 10.1109/61.141847
[6] Hussain A. An expert system for acoustic diagnosis of power circuit breakers and on-load tap changers. Expert Systems with Applications 2015; 42 (24): 9426-9433. doi: 10.1016/j.eswa.2015.07.079
[7] Kasztenny B, Muthukrishnan V, Sidhu TS. Enhanced numerical breaker failure protection. IEEE Transactions on Power Delivery 2008; 23 (4): 1838-1845. doi: 10.1109/TPWRD.2008.917931
[8] Muthukrishnan V, Sidhu TS. Fast and secure breaker failure detection algorithms. IET Generation, Transmission & Distribution 2009; 3 (2): 198-205. doi: 10.1049/iet-gtd:20080104
[9] Razi-Kazemi AA. Circuit-breaker automated failure tracking based on coil current signature. IEEE Transactions on Power Delivery 2014; 29 (1): 283-290. doi: 10.1109/TPWRD.2013.2276630
[10] Feizifar B, Usta O. Condition monitoring of circuit breakers using arc models and failure detection algorithm. In: 2017 5th International Istanbul Smart Grid and Cities Congress and Fair; İstanbul, Turkey; 2017. pp. 32-36. [11] Lee DSS, Lithgow BJ, Morrison RE. New fault diagnosis of circuit breakers. IEEE Transactions on Power Delivery
2003; 18 (2): 454-459. doi: 10.1109/TPWRD.2003.809615
[12] Mingzhe R. Mechanical condition recognition of medium-voltage vacuum circuit breaker based on mechanism dynamic features simulation and ANN. IEEE Transactions on Power Delivery 2005; 20 (3): 1904-1909. doi: 10.1109/TPWRD.2005.848462
[13] Huang J, Hu X, Geng X. An intelligent fault diagnosis method of high voltage circuit breaker based on improved EMD energy entropy and multi-class support vector machine. Electric Power Systems Research 2011; 81 (2): 400-407. doi: 10.1016/j.epsr.2010.10.029
[14] Huang J, Hu X, Yang F. Support vector machine with genetic algorithm for machinery fault diagnosis of high voltage circuit breaker. Measurement 2011; 44 (6): 1018-1027. doi: 10.1016/j.measurement.2011.02.017
[15] Jin W. Fault diagnosis of high-voltage circuit breakers using wavelet packet technique and support vector machine. CIRED - Open Access Proceedings Journal 2017; 2017 (1): 170-174. doi: 10.1049/oap-cired.2017.0541
[18] Shaohua M, Jimei W. An approach for intelligent detection and fault diagnosis of vacuum circuit breakers. IEEE Transactions on Dielectrics and Electrical Insulation 2002; 9 (2): 226-229. doi: 10.1109/94.993739
[19] Biswas SS, Srivastava AK, Whitehead D. A real-time data-driven algorithm for health diagnosis and prognosis of a circuit breaker trip assembly. IEEE Transactions on Industrial Electronics 2015; 62 (6): 3822-3831. doi: 10.1109/TIE.2014.2362498
[20] Kong X. High-voltage circuit-breaker insulation fault diagnosis in synthetic test based on noninvasive switching electric-field pulses measurement. IEEE Transactions on Power Delivery 2016; 31 (3): 1168-1175. doi: 10.1109/TP-WRD.2015.2430523
[21] Cassie AM. Arc Rupture and Circuit Severity: A New Theory. Report No. 102. Paris, France: CIGRE, 1939. [22] Mayr O. Beitraege zur Theorie des statischen und dynamischen Lichtbogens. Archiv fur Elektrotechnik 1943; 37
(12): 588–608 (in German). doi: 10.1007/BF02084317
[23] Habedank U. Application of a new arc model for the evaluation of short-circuit breaking tests. IEEE Transactions on Power Delivery 1993; 8 (4): 1921-1925. doi: 10.1109/61.248303
[24] Haginomori E, Koshiduka T, Arai J, Ikeda H. Power System Transient Analysis: Theory and Practice Using Simulation Programs (ATP-EMTP). West Sussex, UK: John Wiley & Sons, 2016.
[25] BBC Brown Boveri. Low-oil-volume Circuit Breaker SBK 36 mc 1000, Pub. No. AG 90242 E. Baden, Switzerland: BBC Brown Boveri, 1973.
[26] Thomas R, Lahaye D, Vuik C, van der Sluis L. Simulation of arc models with the block modelling method. In: Proceedings of the International Conference on Power System Transients; Cavtat, Croatia; 2015. pp. 1-8.
[27] Carnevali E, Villa V. Study of the high voltage circuit-breakers behaviour around current zero. In: Bostick WH, Nardi V, Zucker OSF (editors). Energy Storage, Compression, and Switching. Boston, MA, USA: Springer, 1976. pp. 507-510.
[28] Bagherpoor A, Rahimi-Pordanjani S, Razi-Kazemi AA. Niayesh, K. Online condition assessment of interruption chamber of gas circuit breakers using arc voltage measurement. IEEE Transactions on Power Delivery 2017; 32 (4): 1776-1783. doi: 10.1109/TPWRD.2016.2597302
[29] Feizifar B, Usta O. A novel arcing power-based algorithm for condition monitoring of electrical wear of circuit breaker contacts. IEEE Transactions on Power Delivery (in press). doi:10.1109/TPWRD.2018.2882013