Peer reviewed, accepted author manuscript of the following research article: Aktas, B., Atlar, M., Fitzsimmons, P., & Shi, W. (2018). An advanced joint time-frequency analysis procedure to study cavitation-induced noise by using standard series propeller data. Ocean
Engineering, 170, 329-350. https://doi.org/10.1016/j.oceaneng.2018.10.026
An advanced joint time-frequency analysis
procedure to study cavitation-induced noise by
using standard series propeller data
Batuhan Aktas *, Mehmet Atlar, Patrick Fitzsimmons, Weichao Shi
Naval Architecture, Ocean & Marine Engineering, University of Strathclyde
Glasgow, UK
Corresponding Author:
*Batuhan Aktas, [email protected]
Naval Architecture, Ocean & Marine Engineering,
Henry Dyer Building, 100 Montrose Street
University of Strathclyde, G4 0LZ
Glasgow, UK
Tel: 01415745342
Abstract:
Within this framework this study presents an advanced joint time-frequency analysis procedure to study cavitation-induced noise by using standard series propeller data. Systematic cavitation tunnel test are conducted with 6 members of the Meridian Standard propeller series that are carefully chosen to study the influence of major propeller design parameters such as Blade Area Ratio (BAR), Pitch to Diameter (P/D) ratio and blade number. Moreover, these propellers are tested behind systematically varied wake inflows reproduced by wake screens in addition to the open water conditions. Synchronized pressure pulse and noise measurements in combination with high-speed cavitation observations are then utilized to develop an advanced cavitation dynamics analysis tool to provide better insight into cavitation-induced noise. The analysis of the measurements has shown the significance of the cavitation on radiated noise levels and the impact of different cavitation dynamics in certain frequency regions.
Keywords: Underwater Radiated Noise; Propeller Cavitation Noise; Experimental Hydrodynamics; Joint Time-Frequency Analysis
Nomenclature:
AE Expanded blade area [m2] R Radius [m]
Ao Propeller disc area [m2] RA Distance between the acoustic center of the noise
source and hydrophone [m] BAR Blade Area Ratio rref Reference distance (1 m) [m]
D Diameter [m] r Local propeller radii [m] f Frequency [Hz] Fluid density [kg/m3]
g Gravitational acceleration [m/s2] SPL Sound pressure level [dB]
hs Shaft immersion [m] T Thrust [N]
J Advance coefficient URN Underwater Radiated Noise KP Pressure coefficient V Speed [m/s]
KQ Torque coefficient VA Advance speed [m/s]
KT Thrust coefficient WMax Maximum wake fraction
N Rotational speed [rpm] WΔ BSRA Wake Criteria (wake non-unormity parameter)
n Propeller revolution speed [rps] 𝑊̅ Mean wake P Pressure [N/m2] W
Min Minimum wake fraction
P/D Pitch ratio at 0.7R Z Propeller blade number Patm Atmospheric pressure [N/m2] ηo Propeller efficiency
Pv Vapour Pressure [N/m2] σvr Resultant cavitation number
1
Introduction
Commercial shipping has revolutionized today’s world by providing the most efficient means
of transportation (Stopford, 1997). The volume of commercial shipping has experienced an increasing trend due to increasing ship size, service speed and number of ships in operation. With the rising trend in commercial shipping, there has been a significant rise in various emissions from ocean-going vessels. One of the most adverse by-products of the commercial shipping has been underwater noise emission. The extraordinary expansion of the world fleet has resulted in increased levels of the ambient noise in the world’s seas, especially in the low frequency domain (Frisk, 2012). Unfortunately, this domain overlaps with that used by marine mammals for various fundamental living activities. Thus, exposing them to such an abrupt change in ambient noise levels may disorient them or disrupt their communication signals, leading to behavioural changes of these mammals or local extinction (Richardson et al., 2013; White and Pace, 2010).
Amongst numerous ship sources, propeller cavitation dominates the overall radiated noise spectrum above the inception threshold. Whilst it is not possible to avoid cavitation for commercial ships at current service speeds, without trading off efficiency, various full-scale underwater radiated noise (URN) measurements in the literature have shown that improvements can be achieved. Among the same types of vessel, full-scale measurements have shown up to 20 dB difference in the measured noise levels (McKenna et al., 2013; MCR, 2011; Wales and Heitmeyer, 2002).
developing an advanced cavitation dynamics analysis tool using pressure pulse and noise measurements that are synchronized with high-speed cavitation observations.
Experimental noise studies with the propellers are of great importance as they represent the state of the art and lead towards the knowledge gaps within the literature. Until the recent doctoral study conducted by the Principal Author of this paper (Aktas, 2017) there has been no study published that has used standard propeller series for noise investigations with systematical wake variation. Some studies have compared the effect of some major propeller designs and operational parameters on the radiated noise levels as well as the effect wake inflow. In his early study, Holden, (Holden, 1981) , carried out an experimental campaign with six propellers out of four that have been tested in the same wake field and two in different inflow conditions. The study set out to investigate the effect of BAR, radial camber and pitch distribution and skew with the four propellers and to look into the effect of wake inflow with an additional two propellers. This work reported that higher BAR, tip offloading and skew reduced the emitted noise levels originating from the propeller cavitation. While the tests have led to some significant conclusions regarding the major propeller design parameters, it failed to take into account wake inflow variations. Moreover, it is not known if the propellers tested were members of a standard propeller series. Whilst detailed pitch and camber distributions are provided for all propellers, there is no mention to their blade section shapes.
Sharma et al., (Sharma et al., 1990) conducted extensive experiments with three basic propellers models of different design to investigate the effect of advance coefficient, cavitation number and propeller geometry on radiated noise levels in uniform flow conditions. Furthermore, one of the propellers was tested behind a typical single-screw vessel wake which led to the conclusion that wake is one of the most important parameters for noise generation. Although the study provides valuable information and is one of the most important studies conducted on this subject, the work was limited to testing three independent propellers with no systematic variation of parameters. Thus, no relation can be drawn from this study with regards to the influence of major propeller parameters on the radiated noise levels of ships.
on the effects of various parameters on tip vortex cavitation dynamics (the so-called bursting phenomenon). One of the most important aspect of this study was the inclusion of four wake variations. The severity of each wake was determined by means of the wake fraction gradients (see Figure 1a). The developed wakes were tested with two propellers having different pitch distributions as shown by Figure 1b. The experiments were conducted at different cavitation numbers and thrust coefficients in order to assess the influences of such parameters.
Figure 1 Wake non-uniformities (a) and propeller pitch distributions (b) (Konno et al., 2002).
The study by Konno et al., (Konno et al., 2002) draws some remarkable conclusions on the effects of such variants on the radiated noise levels. First of all, the wake inflow has a high influential on the radiated noise levels and the results of this study confirm that the cavitation noise increases with the increasing wake severity. Moreover, the study also indicates that the measured levels increase over the whole frequency range, as expected, with the decreasing cavitation number. Whilst certain trends are observed for the thrust coefficient and propeller pitch distribution they are more complex in nature due to the highly irregular cavitation interaction and dynamics. Although this work provides some vital evidence of how propeller cavitation noise changes with respect to propeller pitch distribution and operational parameters in conjunction with the flow non-uniformity alteration, it is limited by the absence of tests regarding the major propeller design parameters and by the small number of test conditions conducted.
Advanced analysis techniques have been utilized for propeller cavitation and noise studies. Pereira et al., (2004) performed harmonic analysis using high-speed visualizations, pressure
a
and noise measurements around a cavitating propeller. This study was conducted in a non-uniform flow field to identify different pressure and noise sources and their respective contribution to the induced fluctuation. In the same vein, (Pennings et al., 2016), simultaneous high-speed video shadowgraphy and noise measurements are used to analyse the noise radiated by tip vortices. An example of time-frequency analysis, through the wavelet transform, used to analyze the pressure fluctuations produced by tip vortices is reported by Bosschers, (2009).
In the light of the reviewed literature, it is evident that a study demonstrating experimental quantitative pressure data analysis combined with qualitative cavitation observation is not publicly available for a standard series of propellers with a systematically varied non-uniform inflow. The studies reviewed here point to a knowledge gap in terms of analysis methodology of the hydro-acoustic propeller cavitation tests. The research to date has demonstrated a number of experimental studies on cavitation noise, however, there is no single study that demonstrates an advanced cavitation noise analysis methodology to enable systematic investigation of the propeller cavitation noise. To address this gap, Aktas (Aktas, 2016) has conducted a comprehensive experimental study by using standard series model propellers to develop a procedure in predicting URN from commercial ship propellers as well as an advanced joint time-frequency analysis (JTFA) procedure for cavitation dynamics by making use of the systematic data produced in this experimental campaign. The JTFA procedure is to understand the effect of cavitation dynamics on the cavitation-induced URN by using synchronised pressure pulses, high-speed cavitation images and underwater noise signals. The post processing tool clearly indicated that cavitation is the dominating noise source following its inception. The wake non-uniformity is the vital parameter to consider for the standard series propeller noise tests since the cavitation dynamics experienced due to the flow irregularity is one of the main sources of the emanated noise levels. Moreover, the cavitation type experienced by any propeller is highly influential over the emanated noise levels as well as the frequency region for which certain type of cavitation contributes into.
technique. Finally, major conclusions drawn from the study about the procedure are given in section 4.
2
Adopted experimental approach
The experimental approach adopted necessitated the use of several experimental artefacts and as the main testing facility, a cavitation tunnel. The Emerson Cavitation Tunnel (ECT) is a closed circuit depressurized tunnel with a measuring section of 3.1 m x 1.21 m x 0.8 m (LxBxH). More detailed information about the tunnel in detail after the recent upgrade is given by Atlar (Atlar, 2011). Details of the selected standard series are presented in section 2.1 while the description of the representative wake inflows and their constructions for the experiments are given in section 2.2. Finally in section 2.3, detailed information about the experimental setup for the URN tests is given.
2.1 Selection of standard propeller series
Newcastle University with its ECT facility has been the birthplace of a number of famous and widely used systematic propeller series (e.g. KCA or Gawn-Burrill, KCD, Meridian, etc.) for which comprehensive open water performance charts have been published (Emerson and Sinclair, 1978; Gawn and Burrill, 1957). Some of these data were used in the development of
Burrill’s cavitation criterion (Burrill and Emerson, 1962) which relates sheet cavity extent to thrust, blade area and cavitation number. Such historical data have formed the background to the main objective of the present study, namely, to generate a representative systematic body of underwater noise data for a subset of the standard “Meridian propeller series”.
Table 1 Fixed-pitch, non-ducted propeller series (Reproduced from(Carlton, 2012))
Amongst the various standard propeller series that are readily available in the inventory of the ECT, the one with the best coverage in terms of the major propeller design parameters for acoustic testing is considered to be the Meridian Standard Propeller series (Emerson and Sinclair, 1978). This family of propellers also has existing propeller performance data that enables cross checking of measurement reliability.
The Meridian propeller series is a unique standard series based solely on practical propeller designs for standardised variations in pitch to diameter ratio, BAR and number of blades (Z). The series is unique in that actual propeller designs were chosen as the parent propellers for each blade number group and blade area group. These were largely obtained from the extensive database of Stone Marine Propulsion (SMP).
2.2 Development of systematic variation of wake inflow
The significance of the hull wake and its distribution on propeller performance, especially for
cavitation and inboard noise, has been noted in many research studies since the 1970’s and is
routinely taken into account in the design and analysis process, e.g (Oossanen, 1971; Young and Kinnas, 2001). Although all three components of the hull wake flow are important on the performance analysis of a propeller, the axial wake is the most important component
dominating the propeller’s loading characteristics. Consequently, it was decided that the desirable wake configurations could be simulated by using two-dimensional wake screens in
combination with different grades of “chicken-wire” meshes, strategically patched onto a base
frame which is in line with the established practice within the ECT.
In order to select suitable wake configurations, a literature survey was conducted. These included seminal studies such as Konno (Konno et al., 2002) in which cavity collapse events were observed to increase amplitudes and complexities of the pressure pulse time-series for the propeller operating behind a peaked, non-uniform inflow. The study further highlighted the effect of altering the gradient of the wake distribution (Konno et al., 2002). The wakes with steeper velocity changes were shown to produce higher tonal amplitudes of pressure fluctuations as well as high-frequency contributions from increased dynamic cavity collapses, both on and away from the blade surface. A characteristic pressure pulse feature was a double
peak configuration in the time domain signals. Inspiration from Konno’s study led to the
utilization of BSRA wake criteria suggested by (Angelopoulos et al., 1988; Odabasi and Fitzsimmons, 1978) to quantify and develop a family of three representative wake grids, to complement the parametric variations in the standard propeller series geometries. According to Odabasi & Fitzsimmons (Odabasi and Fitzsimmons, 1978), the severity of the wake, which can be quantified by the wake non-uniformity parameter given by Equation 1, is an important characteristic in generating propeller-excited vibrations (of the hull) and underwater radiated noise.
W∆,0.7𝑟/𝑅 = {𝑊𝑀𝑎𝑥− 𝑊𝑀𝑖𝑛
where, WMax and Wmin are the maximum and minimum wake fraction and W̅ is the
circumferential average wake fraction calculated by Equation 2. The above is defined at r/R = 0.7 in this study. Whilst the BSRA wake criteria normally is defined at r/R = 1.0, the wake parameters at r/R = 0.7 is preferred in the study. This was due to two reasons. First of all, the developed wake grids presented higher gradients at this radius and hence better representation of the implemented wake variation. Also, as demonstrated through the sample cavitation observations presented within this study, large extent sheet cavitation occurrence is known to concentrate generally at r/R = 0.7.
𝑊̅ =∫ 𝑟
𝑅
𝑟ℎ𝑢𝑏 ∫ 𝑤𝑇𝑑∅𝑑𝑟
2𝜋 0
𝜋(𝑅2− 𝑟2) Equation 2
where, r is the representative radius of the propeller that is integrated over the propeller radius,
𝑤𝑇is the wake fraction that is integrated over the 360°, ∅ is the angle and R is the radius of the
propeller.
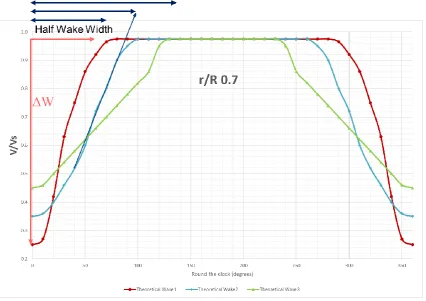
In order to have a better definition and control of the systematic wake variation, further wake parameters such as the mean wake, half-wake width and wake depth (ΔW) have been included in the wake analysis as shown in Figure 2 for r/R = 0.7. The highest value of the wake depth and lowest value of the half-wake width would present the most non-uniform wake distribution. This resulted in the most dramatic change of the inflow velocity in the wake shadow region and consequently would induce the formation of unsteady cavitation in this region by the collapse and rebound of cavity volumes at exit from the wake peak region.
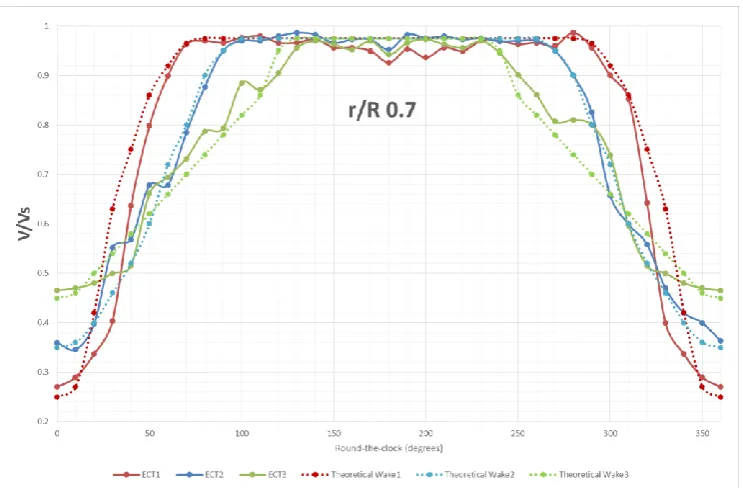
the 0.7 r/R (i.e. 0.9 r/R and 1.1 r/R) similar wake trends are also observed. 0.9 r/R and 1.1 r/R have strong influence on the stability of the tip vortex cavitation.
Figure 3 Comparison of target (theoretical) and simulated wakes (ECT) at r/R=0.7 Table 2 Significant wake parameters for wake distributions selected
Wake Parameters
Wake screen type ECT1 ECT2 ECT3
Wake depth 0.71 0.64 0.50
Half Wake Width (degrees) 60 95 132
Mean Wake (Propeller disc) 0.16 0.20 0.195
Wake non-uniformity parameter 0.86 0.81 0.63
Figure 4 Grid of measurement points used for the wake screen development (reproduced from
(Korkut, 1999)
The three wake screens manufactured and used for the experimental simulations are shown in Figure 5. During the experimental wake simulations these wake screens were placed ahead of the model propellers at a distance of 1.5 propeller diameters as shown in Figure 7 and wake
velocity components were measured by using the ECT’s two dimensional LDA system.
Figure 5 Constructed wake screens; ECT3 (a), ECT2 (b) and ECT1 (c).
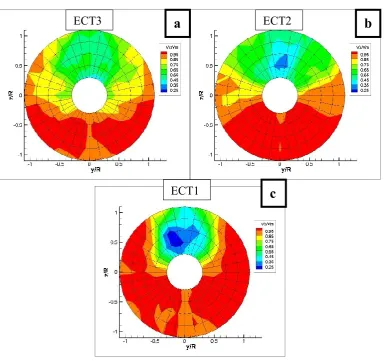
Figure 6 Contour plots of axial velocity distributions of the simulated representative wakes; ECT3 (a), ECT2 (b) and ECT1(c).
ECT3 ECT2
ECT1
a
b
2.3 Experimental setup and test matrix
In order to efficiently conduct the systematic propeller tests, an easy implementation and change of the experimental parameters was needed. In this context, in order to be able to acquire a large amount of data points, major variations to the experimental setup, such as the propeller and the wake screen, should require short periods of down time for the facility. The wake field can be generated for the experiments using the following configurations;
Wire screen mesh for the cavitation tunnels with small test sections. Cost effective and relatively simple method simulating only axial velocity component of the wake field. “Dummy” models are utilized at medium size facilities in conjunction with wire screens
as the removed parallel mid-section due to dummy model concept results in relatively lower Reynolds Number and hence a boundary layer which is not sufficiently developed
Full ship models, which are used for the towing tank tests, are also used for the cavitation tunnel testing in the facilities with large test sections. There may still be a need for wake screens if the differences due to the extrapolation of the wake to full scale are large.
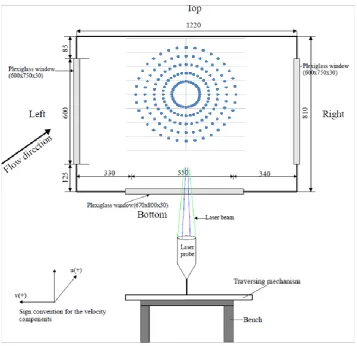
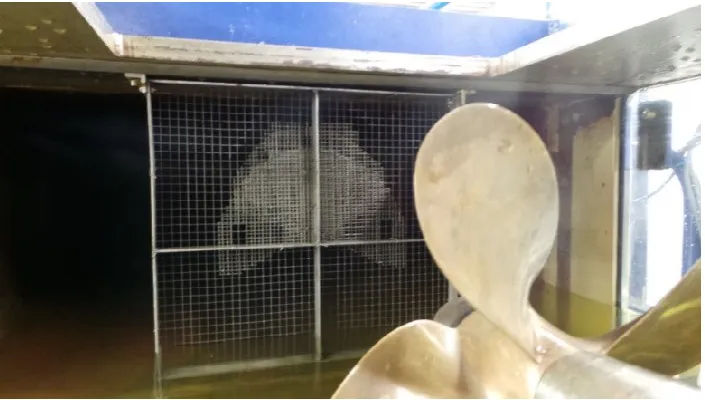
Figure 7 Testing set-up of model propeller behind wake ECT2 at a distance of 1.5 propeller diameter
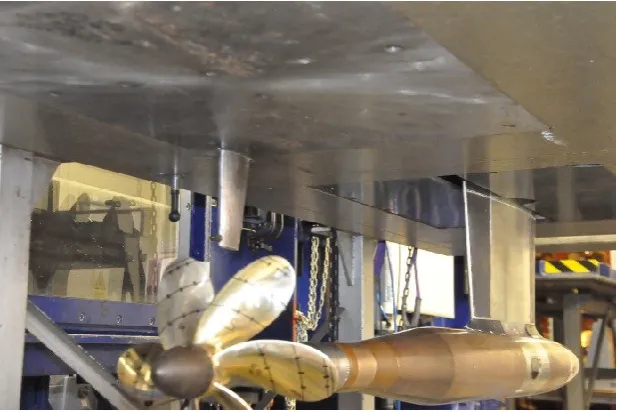
[image:17.595.149.447.412.637.2]Figure 8 shows the experimental set-up used in ECT including propeller model, Brüel & Kjær (B&K) 8103 miniature hydrophone and pressure sensor location on the top plate. Pressure sensor was located at approximately 35% of the propeller diameter above the propeller.
Figure 8 Experimental setup in ECT test section with hydrophone (1) and pressure sensor (2).
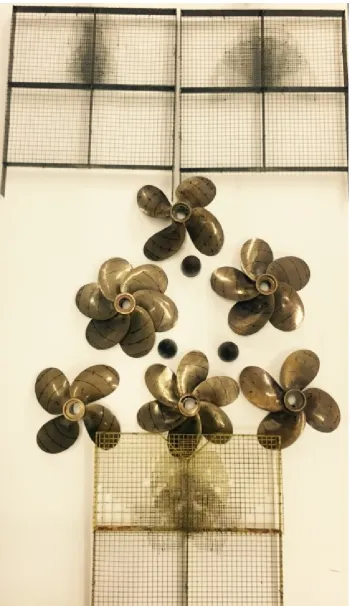
Six members of the Meridian series were hand-picked to assess key propeller design parameters; models KCD 191,192 and 193 were chosen to assess the effect of the pitch, while models KCD 129 and KCD 65 to assess the effect of blade number. Models KCD 65 and KCD 74 were selected to assess the effect of the BAR. Table 3 presents the variation of the propeller design
1
parameters, whilst Figure 9 shows the propellers ready for the tests after marking with radius lines and chord length divisions. The same figure also includes the three wake screens used.
Table 3 Propeller design parameters of the chosen standard series subset
Pitch/Diameter
Blade Area Ratio
0.6 0.8 1.0
0.65 KCD191
(4-Bladed)
KCD192 (4-Bladed)
KCD193 (4-Bladed)
0.85
KCD129 (5-Bladed) KCD65 (6-Bladed)
1.05 KCD74
The acquired data were analysed using the well-known propeller performance parameters of advance coefficient (J), thrust and torque coefficient (KT, 10KQ) and propeller efficiency (η0),
which are calculated using the formulations given by Equation 3.
10𝐾𝑄 = 10𝑄 𝜌𝑛2𝐷5, 𝐽 =
𝑉𝐴
𝑛𝐷, 𝐾𝑇 = 𝑇
𝜌𝑛2𝐷4, 𝜂0=
𝐽𝐾𝑇
2𝜋𝐾𝑄
Equation 3
Amongst various cavitation number formulations, the resultant cavitation number (σvr) takes
the operational conditions (i.e. inflow velocity and rotational speed) better into account than more simple formulations. The calculation includes terms for both rotational speed of the propeller as well as the axial velocity component as in Equation 4.
𝜎𝑣𝑟 = 𝑃𝑎+ 𝜌𝑔ℎ𝑠− 𝑃𝑣
0.5𝜌[(𝑉)2+ (0.7𝜋𝐷𝑛)2] Equation 4
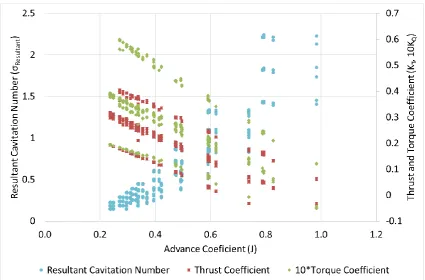
The systematic experimental data consisted of 576 individual tests, based on the selected six model propellers, conducted in uniform flow and behind the earlier described three systematically varied wake grids together with three different levels of tunnel vacuum conditions and eight different propeller speeds. A summary of the test matrix is shown in Table 4. The complete set of the conducted tests as a function of J against σvr, KT,10KQ coefficients
are presented by Figure 10. As can be seen from Figure 10, experimental test conditions are concentrated in the low cavitation number areas to ensure that the majority of the cases experience cavitation as it is the dominant noise source.
Table 4 Meridian series propeller cavitation noise test matrix
Model propelle
r No P/D BAR
Blade no Z Wake flow condition Vacuum condition
Shaft speed N (rpm)
Inflow speed V (m/s)
KCD 191 0.6 0.65 4
Open water, "ECT1", "ECT2", "ECT3" Atmospheri c, 150 mmHg, 300 mmHg 600, 800 1000,1200, 1400, 1500, 1750, 2000 3
KCD 192 0.8 0.65 4
KCD 193 1.0 0.65 4
KCD 129 0.8 0.85 5
KCD 65 0.8 0.85 6
Figure 10 Dataset illustration as a function of advance coefficient (J) in conjunction with resultant cavitation number (σResultant), thrust (KT) and torque (10KQ) coefficients
The water quality of the ECT is regulated throughout all cavitation tests as it has a significant impact on the measurements. It has been brought to the levels suggested by the ITTC (ITTC, 2011, 1987). ECT has a dedicated water quality monitoring system and degassing system to keep the oxygen saturation level of the tunnel at desired level. The tunnel water quality is recorded using two systems in conjunction. The first device enables continuous monitoring of the water quality using the MS5 mini sonde and the dedicated Hydrolab software. Oxygen saturation is calculated as the percentage of dissolved O2 concentration relative to that when
completely saturated at the temperature of the measurement depth. The probes attached to the tip of the mini sonde measure the water quality within a tubing arrangement through which tunnel water is pumped. The second device is a hand held meter for dissolved oxygen, from YSI instruments. This enables instantaneous on demand measurements of the water quality for cross checking with the continuous monitoring system.
the tunnel water. The tunnel dissolved oxygen content was kept between 30 to 40 % throughout the periods that experiments took place following the ITTC guidelines.
3
Presentation of results and advance analysis of
cavitation-induced noise data using JTFA technique
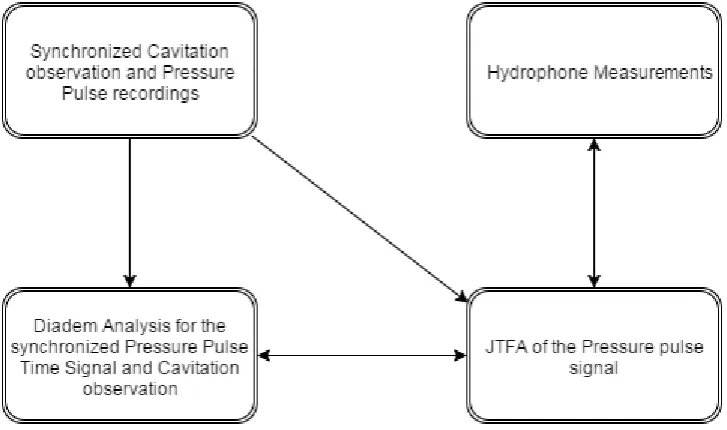
Traditionally URN measurements are presented in the frequency domain thus enabling the comparisons of the URN levels as an indicator of the relative noise performance of a propeller. However, this approach limits the interpretation of various causes for the generation of URN as well as understanding the detailed effects of these causes. In order to provide further insight into this matter an advanced analysis tool for the cavitation-induced URN is discussed in this section. The implementation of this tool has required the recordings of the pressure pulses at a strategic location above the tested propellers in synchronisation with the cavitation observations using High-Speed Video (HSV) cameras during the course of the systematic tests and complementing noise measurements with hydrophones. The synchronization was achieved via Transistor-Transistor Logic (TTL) signal from the electric motor driving the shaft to trigger both the pressure sensor’s (MEAS XPM10-S107-05BS pressure sensors) Data Acquisition (DAQ) system and the high-speed video. Both the pressure pulses and the cavitation observations were acquired at a rate of 5000 Hz to allow a fine assessment of the time signal with respect to the visual cavitation phenomena observed, as presented by Figure 11.
Figure 11 Elements of synchronized pressure pulse and cavitation observation system
Figure 12 Layout of advance analysis tool for cavitation induced URN.
National Instruments DIAdem and LabVIEW software tools are used to quickly locate, load, visualize, analyse, and report the measurement data collected during the data acquisition and/or generated during simulations (National Instruments, 2011, 2003). This tool kit is designed to
[image:23.595.114.478.405.620.2]reporting on large volumes of scattered data in multiple custom formats to make informed decisions.
3.1 URN data of propellers in frequency domain
[image:24.595.143.453.259.465.2]The noise measurements are conducted using a B&K 8103 hydrophone mounted within the tunnel in a streamlined strut. The hydrophone is positioned facing the incoming flow and at an offset of 380 mm as shown in Figure 13 (x=264mm, y=245mm. z=120mm). The inherent self-noise experienced by the propeller is offset by background self-noise correction.
Figure 13 Location of B&K hydrophone relative to model propeller inside ECT
The noise data acquisition for 1/3-octave band was conducted by using the waterfall format of the B&K noise analysis software in order to eliminate the effect of any instantaneous effects/noise (i.e. any external noise that may influence the measurement). This was achieved by using the multi-buffer option of the software which triggers the system every 0.25 seconds for the next measurement. A total of 200 triggers or 50 seconds was measured per condition, each at a 45 kHz sampling rate. The measured values are corrected to an equivalent 1 Hz bandwidth and 1 m source level. A common practice in the analysis and presentation of the noise levels is to reduce the measured values of Sound Pressure Level (SPL) in each 1/3-octave
band to an equivalent 1 Hz bandwidth by means of the correction formula recommended by
ITTC (1987) as in Equation 5.
Where; SPL1 is the sound pressure level in 1 Hz bandwidth in dB relative to 1 μPa. SPLm is the
sound pressure level in 1/3-octave bandwidth in dB relative to 1 μPa. Δf is the frequency
bandwidth for each respective 1/3-octave band.
The ITTC also requires that the sound pressure levels are corrected to a standard measuring distance of 1 m using the spherical acoustic wave propagation relationship using Equation 6.
𝑆𝑃𝐿 = 𝑆𝑃𝐿1+ 20log10(𝑅𝐴) Equation 6
where; SPLis the Sound Pressure Level in 1 Hz band in dB relative to 1 μPa at 1 m. racoustic is
the distance of the location of the hydrophone from the propeller centre as it is assumed to be the location of the acoustic source.
Transfer functions for the ECT have been determined for the systematic propeller cavitation tests. The resulting reverberation characteristics of the ECT has been observed to be significantly similar to other cavitation testing facilities (Tani et al., 2016). The conducted study is not applied as a correction to the experimental measurements carried out in the context of this section due to the limited frequency range for which the signal-to-noise ratio of the measurements is sufficient (only corresponding to three 1/3-octave centre frequencies). In order to overcome this missing information, further investigations are planned to take place using a hydrophone array to enable the spatial averaging of the cavitation tunnel measurements.
The corrections for the tunnel background noise measurements are applied to the measured total noise levels in order to determine the net cavitation noise. The background noise measurements are made without the propeller model, which was replaced by a dummy hub (Bretschneider et al., 2014). The background noise correction applied depending on the level of the difference following the procedure in ANSI/ASA S12.64-2009/Part1. When the difference is smaller than 3 dB, the result is discarded. In case of a difference between 3 and 10 dB, the results are corrected according to Equation 7 and no correction is applied in case of the difference being greater than 10 dB.
𝑆𝑃𝐿𝑁 = 10 log [10( 𝑆𝑃𝐿𝑇
10 ⁄ )
− 10(𝑆𝑃𝐿𝐵⁄10)] Equation 7
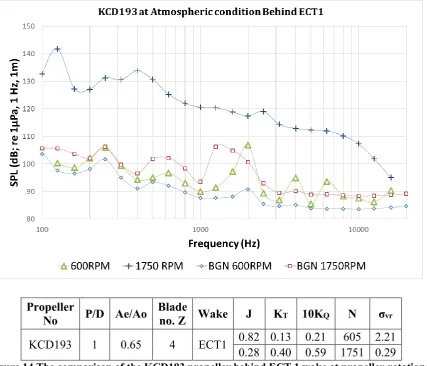
Figure 14 to Figure 18 illustrate the influence of various propeller parameters on URN, as well as the effect of wake inflow and operating conditions. Sequentially, Figure 14 shows the effect of thrust coefficient; Figure 15 demonstrates the effect of the wake inflow; Figure 16 shows the influence of the blade number; Figure 17 depicts the influence of the BAR and Figure 18 illustrates the effect of the P/D ratio.
Propeller
No P/D Ae/Ao Blade no. Z Wake J KT 10KQ N σvr
KCD193 1 0.65 4 ECT1 0.82 0.13 0.21 605 2.21
[image:26.595.86.514.187.553.2]0.28 0.40 0.59 1751 0.29
Figure 14 The comparison of the KCD193 propeller behind ECT 1 wake at propeller rotational speed of 600 RPM and 1750 RPM together with the corressponding Background Noise levels
denoted by BGN.
Propeller
No P/D Ae/Ao Z Wake J KT 10KQ N σvr
KCD193 1 0.65 4 ECT1 0.28 0.40 0.59 1751 0.29
[image:27.595.81.515.71.465.2]Uniform 0.34 0.38 0.56 1752
Figure 15 Noise comparison of the KCD193 propeller behind ECT 1 and in open water condition at propeller speed of 1750 RPM
Figure 15 provides further evidence on the claim that the cavitation developed behind a non-uniform wake may induce higher SPLs, which can be up to 20 dB higher at the 1st blade passage
Propeller
No P/D BAR
Blade
No Wake J KT 10KQ RPM σvr
KCD129
0.8 0.85 5 ECT2 0.24 0.32 0.39 1992 0.18
[image:28.595.75.504.71.474.2]KCD 65 6 0.31 1990
Figure 16 Noise comparison of KCD 129 and KCD 65 propellers behind ECT 2 wake at propeller speed of 2000 RPM
.
Propeller
No P/D BAR
Blade
No Wake J KT 10KQ RPM σResultant
KCD 65
0.8 0.85 6 ECT1 0.25 0.31 0.38 1988 0.19
[image:29.595.76.514.69.457.2]KCD 74 1.05 1976 0.18
Figure 17 The comparison of the KCD 74 and KCD 65 propellers behind ECT 1 wake at propeller speed of 2000 RPM
Propeller
No P/D BAR
Blade
No Wake J KT 10KQ RPM σResultant
KCD193 1
0.65 4 ECT1 0.28 0.40 0.59 1751 0.29
[image:30.595.74.511.74.469.2]KCD191 0.6 0.17 0.18
Figure 18 The comparison of the KCD 193 and KCD 191 propellers behind ECT 1 wake at propeller speed of 1750 RPM
3.2 Synchronized pressure-fluctuation measurements and cavitation behaviour observations in the time domain
These measurements were performed whilst capturing videos and pressure synchronously in an effort to relate cavitation images to characteristics of the measured pressure time-series. Synchronisation was achieved using a TTL signal from the motor speed encoder and a signal generator as a conditioner. The synchronized recordings and analysis of the results can enable one to make comparison of the time signals measured for each propeller to explore the effect of different propeller design and operational parameters on the URN with more detail. Within this framework, some of the earlier investigated parameters have been further explored based on the analysis of the synchronized pressure signals and cavitation observations and results thereof are discussed in the following paragraphs. The duplicated trigger signal was then fed into the high-speed video camera and pressure pulse DAQ system. Figure 19 shows the set-up at ECT used during the tests.
[image:31.595.119.478.501.662.2]Nanosense high speed cameras were also used at 5000 fps in a continuous recording mode for the non-uniform inflow conditions. A high intensity light source was obtained from Plasma-Lite continuous light as shown in Figure 19, to allow a high acquisition rate for the high speed cameras. The measurements were performed whilst capturing videos and pressure synchronously in an effort to relate cavitation images to characteristics of the measured pressure time-series.
Figure 19 Model-scale high-speed video cavitation observation set-up at ECT
current power supply being distributed to each sensor by means of a dedicated pressure transducer excitation voltage and junction box.
Figure 20 Synchronous time domain pressure signals and cavitation observations under atmospheric pressure for KCD 193 behind ECT1 for 1750 RPM (a) and 600 RPM (b)
Figure 20 is the reproduction of the test data used for Figure 14 using synchronized pressure transducer time signals and cavitation observations. The propeller is cavitating heavily for the condition with propeller speed of 1750 RPM whilst 600 RPM is a non-cavitating condition. The cavitating pressure signal shows significantly higher amplitudes with larger high-frequency irregularities (spikes). Such spikes are attributed to the cavitation collapse as shown in the corresponding cavitation observations by Figure 14 which consequently results in the increase of noise levels over a broad frequency range.
Figure 21 Synchronous time domain pressure signals and cavitation observations under atmospheric pressure for KCD 193 at 1750 RPM behind ECT1 (a) and open water condition (b)
Figure 21 shows differences only due to the wake flow; ECT1 and open water. The pressure time signals differ significantly both in terms of the amplitude and the spikes present in the time signal. The images also support this finding as both tip vortex and sheet cavitation for the propeller in open water condition are more stable, whilst behind ECT1, bursting of a tip vortex cavitation (TVC) due to non-uniform inflow is observed in the slipstream together with unstable sheet cavitation attached to the propeller blade.
Figure 22 Synchronous time domain pressure signals and cavitation observations under 150 mmHg vacuum behind ECT2 at 2000 RPM for KCD 65 (a) and KCD 129 (b)
The effect of different blade numbers is shown in Figure 22. The thrust load per blade is less for KCD 65, which has the higher number of blades (6 blades). KCD 65 is experiencing rather unsteady tip vortex cavitation collapses in the propeller slipstream as shown in the images, which are resulting in spikes in the associated time signals. On the other hand, KCD 129 (5 blades) shows comparatively more stable cavitation and a thicker diameter of tip vortex cavitation. The impact of the cavitation dynamics experienced by both propellers on the
measured noise levels are presented by Figure 16. KCD 129 emanates higher noise levels at the 1st BPF and a tip vortex cavitation hump that is shifted towards the lower frequencies with
Figure 23 Synchronous time domain pressure signals and cavitation observations under 150 mmHg vacuum behind ECT1 at 2000 RPM for KCD 74 (a) and KCD 65 (b)
Figure 23 presents the effect of the BAR for two 6-bladed propellers. KCD 74 has a higher BAR, hence a lower thrust density. This produces a smaller extent and volume of sheet cavitation and hence a smaller peak to peak pressure signal. The sheet cavitation produced on KCD 65, with its higher thrust loading, is relatively more unstable, showing foamy collapsing behaviour in the slipstream, whilst the tip vortex cavitation of KCD 74 is rather stable but thicker in diameter. The effect of the cavitation dynamics is also evident in the measured SPL as presented by Figure 17. The SPL measured for KCD 74 is relatively higher from 200 Hz to
800 Hz which can be attributed to the thicker tip vortex cavitation experienced by the propeller. For KCD65, instability of tip vortex cavitation and relatively smaller core diameter results in the spectral hump to shift towards the higher mid-frequencies and at a lower local maximum SPL. Furthermore, the foamy collapse of the tip vortex produced broadband noise and spectral elevation in high frequencies.
Figure 24 Synchronous time domain pressure signals and cavitation observations under atmospheric pressure behind ECT1 at 1750 RPM for KCD 193 (a) and KCD 191 (b).
Figure 24 shows the pressure time series and cavitation images for two different P/D ratios. At the same J-value, KCD 193 is operating at a higher loading than KCD191. Consequently, it generates a larger extent of sheet cavitation as well as unsteady tip vortices travelling into the
3.3 Joint time-frequency analysis of fluctuating pressures and URN of propellers
The acquired pressure time signal data, described in the previous section, has then been fed into the Joint Time-Frequency Analysis (JTFA) tool in order to understand the relationship between time events of the pressure pulse signals and cavitation presence and corresponding frequency domain response. The JTFA tool does this through a spectrogram, which can be used to gain enhanced understanding for the frequency region that certain types of cavitation contribute into.
Figure 25 Jointtime-frequency analysis of KCD 193 propeller behind ECT1 under atmospheric condition at 1750 RPM
Figure 26 Joint time-frequency analysis of KCD 193 propeller behind ECT1 under atmospheric codition at 600 RPM
Figure 27 Joint time-frequency analysis of KCD 193 propeller in open water condition under atmospheric codition at 1750 RPM
Figure 28 Joint time-frequency analysis of KCD 129 propeller behind ECT2 under 150 mmHg vacuum at 2000 RPM (5 blades)
Figure 29 Joint time-frequency analysis of KCD 65 propeller behind ECT1 under 150 mmHg vacuum at 2000 RPM
Figure 30 Joint time-frequency analysis of KCD 74 propeller behind ECT1 under 150 mmHg vacuum at 2000 RPM
Figure 31 Joint time-frequency analysis of KCD 65 propeller behind ECT1 under 150 mmHg vacuum at 2000 RPM
Figure 31 represents the JTFA results of KCD 65 having the lower BAR. While the background colour of the spectrogram is exactly the same up to the 1st BPF (200Hz) for both KCD 65 and
Figure 32 Joint time-frequency analysis of KCD 191 propeller behind ECT1 under atmospheric condition at 1750 RPM
4
Conclusion
Based on the systematic propeller cavitation noise data produced in this study, the capability of the implemented analysis methodology is demonstrated for advanced cavitation-induced noise analysis. The main objective of the proposed methodology is to enhance the understanding of the cavitation-induced noise phenomenon. This has been achieved by making use of the synchronised fluctuating pressure signals and cavitation observations in time-domain which is combined with the JTFA technique. The implemented procedure has demonstrated the impact of the important propeller design and operational parameters with regards to the URN phenomenon. Furthermore, the careful investigation of the recorded data revealed the importance of the observed instantaneous cavitation dynamics on the time pressure signals and their consequent impact in the frequency domain.
The frequency domain results of the hydrophone measurements clearly indicated that cavitation is the dominating noise source following its inception. The wake non-uniformity is a vital parameter to consider for the standard series propeller noise tests since the cavitation dynamics experienced due to the flow irregularity is one of the main sources of the emanated noise levels. Moreover, the cavitation type experienced by any propeller is highly influential on the emanated noise levels as well as the frequency region for which a certain type of cavitation contributes into.
The synchronization of the pressure pulse measurements and cavitation observations enabled interpretation of the influence of cavitation events on the pressure time signals. The repetitive major cavitation events and relatively instantaneous dynamic cavitation collapse occurrence has been observed to be the main driving mechanism causing fluctuations and spikes within the measured pressure signals.
Finally, in order to be able to understand the effect of those spikes and fluctuation in the time domain, a Joint Time-Frequency Analysis tool is utilized to establish a bridge between the time series results and their frequency responses. The JTFA provides the colour contoured spectrogram, which is then converted to the frequency response. The frequency response, in conjunction with the synchronized cavitation observations enables the interpretation of frequency region that certain cavitation phenomenon contributes into.
signature. The exact frequency region that tip vortex cavitation contributes into changes with its size and dynamics experienced by it. The tip vortex cavitation with larger core diameter results in the hump to shift to relatively lower frequencies with higher maximum SPL. Sheet
cavitation mainly elevates the SPL’ at the blade rates and in the high frequencies. The
contribution of the sheet cavitation at the blade rates is due to its volume and sheet cavitation volume variation over time. The high-frequency elevation is mainly due to sheet cavitation collapse and rebounding phenomenon. Moreover, the
Acknowledgments
The research constituting the basis for this study has been supported by the European Union 7th Framework Programme (FP7) under grant agreement No: 314394 through the SONIC
project.
Appendix A. Synchronized fluctuating pressures and cavitation observation videos
The video captures of the synchronized fluctuating pressure pulses and cavitation observation videos are provided within this appendix.
Click here to download Video: KCD193_W1_Atm_1750RPM_600RPM.mov
Video 1.: Synchronous time domain pressure signals and cavitation observation video under atmospheric pressure for KCD 193 behind ECT1 for 1750 RPM (left) and 600 RPM (right)
Click here to download Video: KCD193_W1_OW_Atm.mov
Video 2.: Synchronous time domain pressure signals and cavitation observations under atmospheric pressure for KCD 193 at 1750 RPM behind ECT1 (left) and open water condition (right)
Click here to download Video: KCD65_KCD129_W2_150mmhg.mov
Video 3.: Synchronous time domain pressure signals and cavitation observations under 150 mmHg vacuum behind ECT2 at 2000 RPM for KCD 65 (left) and KCD 129 (right)
Video 4.: Synchronous time domain pressure signals and cavitation observations under 150 mmHg vacuum behind ECT1 at 2000 RPM for KCD 74 (left) and KCD 65 (right)
Click here to download Video: KCD193_KCD191_W1_atm.mov
Video 5.: Synchronous time domain pressure signals and cavitation observations under atmospheric pressure behind ECT1 at 17500 RPM for KCD 193 (Left) and KCD 191 (Right)
Reference
Aktas, B., 2017. A Systematic Experimental Approach to Cavitation Noise Prediction of Marine Propellers. Newcastle University, PhD Thesis.
Angelopoulos, A., Fitzsimmons, P.A., Odabasi, A.Y., 1988. A Semi-Empirical Method for Propeller Broad-Band Noise. Report No: W1906, British Maritime Technology Limited, p. 14.
Atlar, M., 2011. Recent upgrading of marine testing facilities at Newcastle University, in: The 2nd International Conference on Advanced Model Measurement Technology for the EU Maritime Industry. Newcastle upon Tyne, UK, 4-6 April, pp. 1–32.
Bosschers, J., 2009. Investigation of Hull Pressure Fluctuations Generated by Cavitating Vortices. Proc. First Symp. Mar. Propulsors.
Breslin, J.P., Andersen, P., 1996. Hydrodynamics of Ship Propellers, Cambridge Ocean Technology Series. Cambridge University Press. doi:10.1017/CBO9780511624254
Bretschneider, H., Bosschers, J., Choi, G.H., Ciappi, E., Farabee, T., Kawakita, C., Tang, D., 2014. Specialist Committee on Hydrodynamic Noise, Final Report and Recommendations to the 27th ITTC. Copenhagen, Sweden.
Burrill, L.C., Emerson, A., 1962. Propeller Cavitation-Further Tests on 16in Propeller Models
in the King’s College Cavitation Tunnel. Trans. North East Coast Inst. Eng. 79:, 295–320.
Carlton, J., 2012. Marine Propellers and Propulsion. Butterworth-Heinemann.
Coast Inst. Eng. Shipbuild. 94:, 199–234.
Frisk, G. V., 2012. Noiseonomics: The relationship between ambient noise levels in the sea and global economic trends. Sci. Rep. 2, 2–5. doi:10.1038/srep00437
Gawn, R.W.L., Burrill, L.C., 1957. Effect of Cavitation on the Performance of a Series of 16 in. Model Propellers. Inst. Nav. Archit. -- Trans. 99:, 690–718.
Holden, K., 1981. Effect of propeller design parameters on noise induced by cavitation, in: Nilsson, A.C., Tyvand, N.P. (Eds.), Noise Sources in Ships I:Propellers. Nordforsk, Miljovardsserien, Sweden.
ITTC, 2011. Model – Scale Cavitation Test, in: Recommended Procedures and Guidelines, 7.5-02-03-03.1. 26th ITTC Specialist Committee on Scaling of Wake Fields, p. 9.
ITTC, 1987. Cavitation committee report, 18th International Towing Tank Conference. Kobe, Japan, 18th International Towing Tank Conference, October.
Konno, A., Wakabayashi, K., Yamaguchi, H., Maeda, M., Ishii, N., Soejima, S., Kimura, K., Yamguchi, H., Maeda, M., Ishii, N., Soejima, S., Kimura, K., 2002. On the Mechanism of the Bursting Phenomena of Propeller Tip Vortex Cavitation. J. Mar. Sci. Technol. 6,
181–192. doi:10.1007/s007730200006
Korkut, E., 1999. An Investigation Into The Scale Effects on Cavitation Inception and Noise in Marine Propellers. School of Marine Science and Technology Technology, Newcastle University, Philosophy of Doctorate Thesis.
Kuiper, G., 2010. New developments and propeller design. J. Hydrodyn. Ser. B 22, 7–16. doi:10.1016/S1001-6058(09)60161-X
McKenna, M.F., Wiggins, S.M., Hildebrand, J.A., 2013. Relationship between container ship underwater noise levels and ship design, operational and oceanographic conditions. Sci. Rep. 3, 10. doi:10.1038/srep01760
National Instruments, 2011. DIAdem, Data Mining, Analysis, and Report Generation. User Man. 373082J–01, 122.
National Instruments, 2003. National Instruments, LabView.
Odabasi, A., Fitzsimmons, P., 1978. Alternative methods for wake quality assessment. Int. Shipbuild. Prog. 25, February 1978.
Oossanen, P. van, 1971. A Method for Minimizing the Occurence of Cavitation on Proplellers in a Wake. Int. Sh. Build. Prog. 18, 321–333.
Pennings, P., Westerweel, J., Terwisga, T. van, 2016. Cavitation tunnel analysis of radiated sound from the resonance of a propeller tip vortex cavity. Int. J. Multiph. Flow 83, 1–11. doi:10.1016/J.IJMULTIPHASEFLOW.2016.03.004
Pereira, F., Felice, F. Di, Soave, M., Salvatore, F., 2004. Experimental Investigation of a Cavitating Propeller in Non-Uniform Inflow. 25th ONR Symp. Nav. Hydrodyn.
Richardson, W.J.W., Greene, C.R., Jr., Malme, C.I.C., Thomson, D.H.D., Jr, C.G., Malme, C.I.C., Thomson, D.H.D., 2013. Marine mammals and noise. Elsevier Science.
Ross, D., 1976. Mechanics of Underwater Noise. Peninsula Publishing, California, USA. doi:10.1016/B978-0-08-021182-4.50014-3
Sharma, S.D., Mani, K., Arakeri, V.H., 1990. Cavitation noise studies on marine propellers. J.
Sound Vib. 138, 255–283. doi:10.1016/0022-460X(90)90542-8
Stopford, M., 1997. Maritime Economics, Second Edi. ed. doi:10.1016/S0966-6923(98)00021-0
Tani, G., Viviani, M., Hallander, J., Johansson, T., Rizzuto, E., 2016. Propeller underwater radiated noise: A comparison between model scale measurements in two different
facilities and full scale measurements. Appl. Ocean Res. 56:, 48–66.
doi:10.1016/j.apor.2016.01.007
Wales, S.C., Heitmeyer, R.M., 2002. An ensemble source spectra model for merchant ship-radiated noise. J. Acoust. Soc. Am. 111, 1211–1231. doi:10.1121/1.1427355
IMarEST Sh. Noise Vib. Conf.