Development of a novel probe for remote visual inspection of
pipework
Gordon Dobiea, Rahul Summana, Graeme Westa, Callum Stewartb, Gary Boltonc and Douglas Offin*c
a Electronic and Electrical Engineering, University of Strathclyde, Glasgow, UK b Wideblue Ltd, Kelvin Campus, Glasgow, UK
c National Nuclear Laboratory, UK
* corresponding author: [email protected]
Abstract
The interior visual inspection of pipework is a critical inspection activity required to ensure the continued safe, reliable operation of plant and thus avoid costly outages. Typically, the video output from a manually deployed probe is viewed by an operator with the task of identifying and estimating the location of surface defects such as cracks, corrosion and pitting. However, it is very difficult to estimate the nature and spatial extent of defects from the often disorientating small field of view video of a relatively large structure. This paper describes the development of a new visual inspection system designed for inspecting 3 - 6 inch diameter pipes. The system uses a high resolution camera and structure from motion (SFM) algorithm to compute the trajectory of the probe through the pipe. In addition a laser profiler is used to measure the inner surface of the pipe and generate a meshed point cloud. The camera images are projected onto the mesh and the final output of the system is a photorealistic 3-D model of the internal surface of the pipework.
Introduction
Non-destructive testing refers to a range of technologies that are used to evaluate the properties of components and structures without causing damage to the component or structure. Perhaps the most basic form of non-destructive testing is visual inspection, in which cameras are used to collect optical images to detect and characterise features of a component.
Remote visual inspection of civil nuclear pipework is a critical activity that is carried out periodically to ensure the continued safe operation of plant. It is currently performed online by an operator who manipulates a pipe inspection camera or video boroscope to look inside pipes while using expert knowledge to capture images of defects and subsequently quantify them. However, this approach has a number of drawbacks. Firstly, the extremely limited field of view of the camera is often disorienating and makes it difficult to quantify large defective regions. Secondly, defect characterisation is performed online at the point of inspection by a highly qualified inspector, increasing operator dose, outage time and a reliance on small number of expert inspectors. Thirdly, probe localisation is poor, making it difficult to relocate defective regions of pipe sections. Finally, still images or videos are often only captured of deteriorated sections of the plant, thus restricting appreciation of the rest of the environment.
for direct comparison between datasets acquired at different times to easily track the evolution of defects.
To realise the benefits described above a new rugged optical sensor incorporating a camera, optics, laser profiler and positional sensors has been developed. Software algorithms have been developed that automatically scale, compensate for geometric warping and stitch together frames from the camera, laser profiler and additional positional sensors to provide an accurate 3D computerised model. The technology allows more accurate and reliable inspections to be performed, which will improve the overall quality of remote visual inspection of nuclear pipework.
Hardware and system operation overview
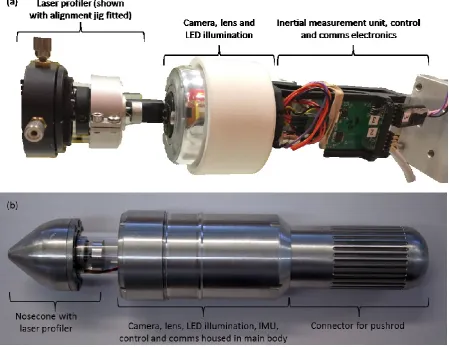
The probe consists of three key sub-systems: (1) camera and optics, (2) a laser profiler and (3) inertial measurement unit and control electronics. An image of a prototype probe is shown in Error! Reference source not found.(a) with the subsystems highlighted. This unit has been used for the work described here. Error! Reference source not found.(b) shows a photograph of the
development probe, which will be used in future trials. The outer diameter of the probe is 45 mm. This version is for a push-rod cable but the design allows for a flexible cable with a standard LEMO® connector to the probe.
The optical system is comprised of a high resolution (2 megapixel) machine vision camera coupled with a fisheye lens. Using this system a 360° crosssectional view of the inner surface of the pipe is captured in a single image. At the cost of increased signal processing complexity, this configuration leads to quicker inspections [1-3], in comparison to approaches which use mechanically swept narrow field of view cameras [4]. The laser profiler consists of a laser directed towards a conical mirror, which projects a ring of light onto the inner surface of the pipe within the field of view of the camera.
During operation the system is driven in two distinct modes in alternation: (1) colour image capture of the internal surface of the pipe and (2) cross-sectional shape measurement capture. In the first mode, the internal volume of the pipe is illuminated with high power light emitting diodes (LEDs) to acquire a colour image of the surface. These images are subsequently used for structure from motion (SFM) processing. For cross-sectional shape measurements, the LEDs are switched off and the laser profiler is activated. This projects a red laser ring onto the pipe’s internal surface and into the field of view of the camera. The image of the laser ring is analysed to determine the geometry of the illuminated cross-section. In addition, each image has an associated timestamp and orientation measurement from the on-board inertial measurement unit. This data can be used to assist the image processing in areas of low surface texture.
Software development
In order to generate the final output from the system, image processing is carried out on the data captured during each the two modes of operation.
Laser image processing
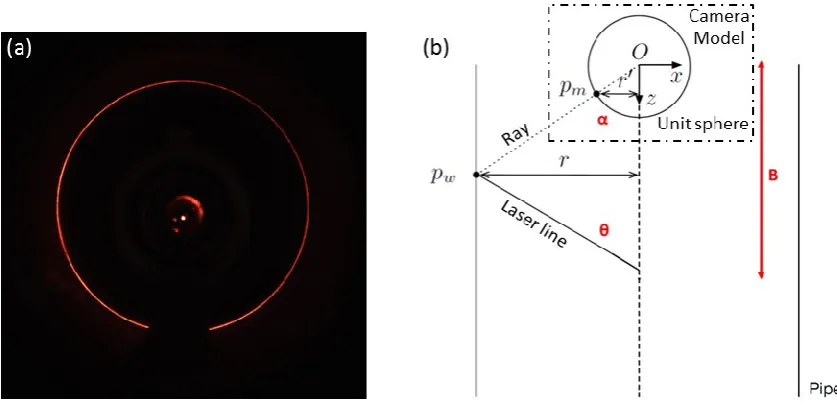
rather it will be a curved line which may contain discontinuities due to surface defects. In order to extract such a curve from the image, a radial line search in the red component is performed to determine the set of pixels corresponding to the laser. The geometry of the laser and camera configuration is shown in Error! Reference source not found.(b). In a pipe of radius, 𝑟, the laser line is emitted from the laser profiler at an angle of 𝜃 (nominally 180 ̊) which intersects the pipe wall at a 3D point, 𝑝𝑤. This point is imaged by the camera (represented by the unit sphere) which is located at
a distance, 𝐵, (baseline) from the laser. Given knowledge of 𝐵and 𝜃 (obtained through calibration of the probe) and the direction vector corresponding to each laser pixel, triangulation may be
employed to estimate the 3D position, 𝑝𝑤, of each of these pixels. This is the measurement output by the profiler. The direction vector corresponding to a pixel is estimated from the camera model described by Scaramuzza et al [5].
In order to assess the accuracy of the laser profiler, an experiment was carried out using a split-pipe with artificial linear defects. The baseline surface geometry was measured using a GOM ATOS Triple scan surface scanning system (see Error! Reference source not found.(a), defects labelled D1 to D3). The pipe section was then measured using the laser profiler on a prototype probe (see Error!
Reference source not found.(b)). It can be seen that the probe clearly detects the surface defects. The surface coordinates measured by both systems were compared and it was found that the root mean square error between the surfaces was 0.8 mm.
Surface image processing
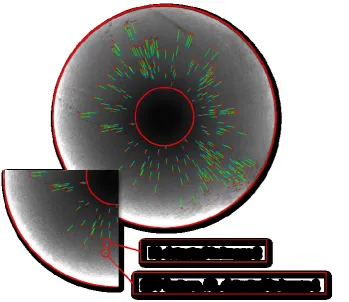
Images of the internal surface are captured as the probe moves through the pipework. These images are analysed to determine the position and orientation of the probe. However, due to the computational expense of operating upon the image directly, image feature extraction is used and forms a core component of the system’s operation. In this process the image is firstly transformed into a set of salient points which essentially represent gradient information in the intensity profile of the image. A feature consists of such a salient point and also a descriptor which encodes statistics computed from a window of pixels surrounding this point. The descriptor is used to identify the same feature in other images and through consideration of the 2D motion of features, the 3D motion of the probe may be inferred [6]. The feature extraction and matching process forms the fundamental input to the SFM processing pipeline. The widely used scale invariant feature transform [7] was selected for performing feature extraction in the visual front-end of the system. An example of feature extraction resulting from forward linear motion is shown in Error! Reference source not found., the red dots correspond to features extracted in the first image while the blue dots show where the features move to in the next image. Assuming that the camera model is known,
(normalised) features 𝑥̃𝑖−1 and 𝑥̃𝑖, matched between images 𝑖 − 1 and 𝑖 must satisfy the following
constraint [6]:
𝑥̃𝑖−1𝐸𝑥̃𝑖 = 0 (1)
where, 𝐸, is the essential matrix which encodes the rigid body transform [8]:
𝑖−1𝑇
between the two images where 𝒕 = [𝑥, 𝑦, 𝑧]𝑇 is 3D translation and 𝑅 ∈ 𝑆𝑂(3) is 3D rotation. A
minimum of 8 features matched are required to estimate, 𝐸, using the normalised 8 point algorithm [6]. These relative transforms are multiplied together to construct the absolute probe trajectory.
Accuracy in the reconstruction of the probe’s trajectory is key to the system operation. The impact of the number of features and their distribution on this has been investigated via simulation. It was found that the error in the computed trajectory is minimised if there are a large number of features matched between images, and if they are well distributed around the inner surface of the pipe. It is recognised that this may not always be the case in real pipes. However the inclusion of an inertial measurement unit allows this problem to be mitigated in areas of pipe where there are insufficient surface features. In addition, it was found though experiment that the number of features matched is dependent on the distance travelled by the probe between images, with better performance at shorter inter-frame distances. By controlling the speed of the probe and the data capture rate the performance can be optimised to balance accuracy and inspection speed.
System Output
The final output from the system combines data extracted from the laser and visual images, and the visual images themselves to generate a photorealistic 3D model. An example output of the system is shown in Error! Reference source not found. for a linear segment of 3 inch 304L stainless steel pipe. The system firstly generates a point cloud, Error! Reference source not found.(a), from the laser data where each laser ring is placed in 3D space according to the camera positions/orientations calculated from the SFM processing. A meshing algorithm is subsequently applied to transform this point cloud into a triangular mesh as shown Error! Reference source not found.(b). Image data is then mapped back onto the mesh through a texturing procedure to form the photorealistic model. This consists of projecting the vertices corresponding to each mesh triangle into the images to generate a set of candidate image patches. The patch which is most perpendicular with the view axis of the camera is chosen for mapping. The final output is displayed in Error! Reference source not found.(c). The texture from the inside of the pipe is displayed on the outer surface to provide a single global view of the data and thus ease of visualization. As the output is a 3D model, the data can viewed from any orientation.
Conclusions
A new probe for remote visual inspection has been described and results presented. The system is based on a probe that includes a wide field-of-view camera, a laser profiler and additional on-board sensors. The system is driven in two distinct modes in alternation: (i) colour image capture of the surface and (ii) cross-sectional shape measurement capture. In the first mode, the internal volume of the pipe is illuminated with LEDs to acquire a colour image of the surface. Secondly, the LEDs are switched off and the laser ring profiler is activated which projects a laser ring onto the pipe’s surface and into the field-of-view of the camera.
commercial surface scanning system showed that the probe’s laser profiling sub-system measured the surface geometry with sub-millimetre accuracy.
Acknowledgements
This Collaborative Research and Development project received funding from Innovate UK (project Reference 102067). The authors would like to thank the project partners Inspectahire Instrument Co. Ltd and Sellafield Ltd.
Acronyms
light emitting diodes (LED)
structure from motion (SFM)
References
1. Kannala J, Brandt S.S and Heikkila J. Measuring and Modelling Sewer Pipes from Video. Machine Vision and Applications. Vol. 19. No 2. 2008. pp. 73–83.
2. Hansen P, Alismail H, Rander P and Browning B. Pipe Mapping with Monocular Fisheye Imagery. IEEE/RSJ International Conference on Intelligent Robots and Systems (IROS). 2013. pp. 5180–5185.
3. Matsui K, Atsushi Y, and Toru K. 3-D Shape Measurement of Pipe by Range Finder Constructed with Omni-directional Laser and Omni-directional Camera. IEEE International Conference on Robotics and Automation (ICRA). 2010. pp. 2537-2542.
4. Murray P, West G, Marshall S and McArthur S. Automated image stitching for enhanced visual inspections of nuclear power stations. 10th International Conference on Condition Monitoring and Machine Failure Prevention Technologies. 2013. pp. 269-280.
5. Scaramuzza D, Martinelli A, and Siegwart R. A Flexible Technique for Accurate Omnidirectional Camera Calibration and Structure from Motion. Proceedings of the Fourth IEEE International Conference on Computer Vision Systems. 2006. pp. 45.
6. Hartley R and Zisserman A. Multiple View Geometry in Computer Vision. Cambridge University Press, Cambridge, 2003.
7. Brown M and Lowe D.G. Automatic Panoramic Image Stitching Using Invariant Features. International Journal of Computer Vision. 2007. pp. 59-73.
Figure Captions
[image:6.595.74.524.331.678.2]Figure 2 (a) Example of laser profiler image. (b) Laser profiler and camera geometry.
[image:7.595.84.389.400.639.2]Figure 4 Example of feature extraction on a stainless steel pipe (SIFT- scale invariant feature transform).