City, University of London Institutional Repository
Citation
:
Bharal, M., Morgan, S. ORCID: 0000-0002-7573-4290, Husain, T., Hilari, K. ORCID: 0000-0003-2091-4849, Proctor, C., Harrison, K. ORCID: 0000-0003-0271-5272, Bassett, P. and Culkin, A. (2019). Volume Based Feeding Versus Rate Based Feeding in the Critically Ill: A UK Study. Journal of the Intensive Care Society, doi:10.1177/1751143719847321
This is the accepted version of the paper.
This version of the publication may differ from the final published
version.
Permanent repository link:
http://openaccess.city.ac.uk/id/eprint/21987/Link to published version
:
http://dx.doi.org/10.1177/1751143719847321Copyright and reuse:
City Research Online aims to make research
outputs of City, University of London available to a wider audience.
Copyright and Moral Rights remain with the author(s) and/or copyright
holders. URLs from City Research Online may be freely distributed and
linked to.
City Research Online: http://openaccess.city.ac.uk/ [email protected]
1
Volume Based Feeding Versus Rate Based Feeding in the Critically Ill: A UK
Study
Bharal M., Morgan S., Husain T.,
Hilari K.
, Proctor C., Harrison K., Bassett P., Culkin A. (2019)
Volume Based Feeding Versus Rate Based Feeding in the Critically Ill: A UK Study.
Journal of
the Intensive Care Society
2
Introduction
Nutrition support is an essential part of treatment in patients requiring intensive care. Timely provision of greater energy and protein intake is associated with lower mortality and a faster time to discharge alive [1, 2].
However, underfeeding in intensive care patients is commonplace and multi-factorial [3]. In response to
stress, underfeeding can lead to malnutrition and poor clinical outcomes, including increased mechanical ventilation days, infectious complications, length of stay (LOS) in the Intensive Care Unit (ICU) and in hospital,
with an increase in associated healthcare costs [4-8].
Enteral nutrition (EN) remains the preferred route of feeding in ICUs, providing both nutritional and
non-nutritional benefits [9-12]. However, there is currently insufficient evidence for the optimal EN delivery
method in the literature for intensive care patients, with options including Rate Based Feeding (RBF) or bolus feeding [13, 14]. Frequent interruptions to EN including routine fasting for procedures and investigations
exacerbate underfeeding in ICU patients [15, 16] and recent studies have demonstrated that RBF is ineffective
in addressing this issue [17-20]. Despite this, RBF remains the most common method of EN delivery throughout ICUs in Europe. The recent International Nutrition Survey (INS, 2014/15), demonstrated that
adequacy of energy and protein in enterally fed ICU patients in Europe was 58% and 54% respectively
(unpublished data; Darren Heyland, personal communication, 2017).
A Volume Based Feeding (VBF) approach has been recommended to address the challenges of frequent
interruptions and optimise the delivery of EN [12,14]; designed to adjust the infusion rate to make up for daily interruptions in delivery, enabling a greater volume of EN to be delivered compared to a fixed hourly RBF [18].
This recommendation for VBF is based on studies in North America [18-21]. To date there are no studies
evaluating VBF alone and its effect on EN delivery or clinical outcomes outside of North American healthcare institutes. Although the practice of intensive care medicine is universal in most countries, there can be
significant differences in healthcare and populations in this already heterogeneous patient group; these previous VBF studies may not be generalisable to other intensive care populations where differing health
3
So far there has been no study in the United Kingdom (UK) that addresses whether VBF is a safe and more
effective method than RBF in improving energy and protein delivery in mechanically ventilated ICU patients. We hypothesised that VBF would improve energy and protein delivery without deleterious effects on
glycaemic control or gastrointestinal tolerance and subsequently, may improve clinical outcome.
Methodology
Study Design and Setting
We conducted a single centre study in an adult, mixed medical and surgical ICU in England, UK between
January 2015 and March 2017. This is a cohort study, comparing the usual RBF protocol (cohort 1) to a newly
implemented VBF Protocol (cohort 2). Retrospective data were used for RBF participants and prospective data were collected for VBF participants, before and after VBF was introduced. An application to both City,
University of London’s Senate Research Ethics Committee (Reference number MRes/15-16/40) and UK’s Health Research Authority advised that ethical approval was not required for this service evaluation, in that
these patients would not undergo any additional intrusive procedure to their normal attention, the data
collected was part of their routine care and further patient consent was not required.
Participants
Eligible patients were mechanically ventilated adults (>18 years), requiring EN for >48 hours at any point during their first 12 days of stay. Consecutive patients were assessed and selected by a registered dietitian for
both cohorts. Patients were excluded for the following reasons: contraindications to EN including bowel
obstruction, complex bowel surgery (not including post-operative, uncomplicated colonic resections), proximal enterocutaneous fistula, short bowel, bowel ischaemia or paralytic ileus; pre-existing or onset of GI
intolerance including profuse diarrhoea (5 stools or >750ml/ 24 hours), nausea, vomiting, abdominal
distension (based on nursing assessment), one episode or more of GRV >250ml; receiving parenteral nutrition; aspiration of feed within 48 hours; pregnancy.
4
or more GRV > 250ml, feeds were initially reduced to a previously tolerated rate or subsequently reduced to
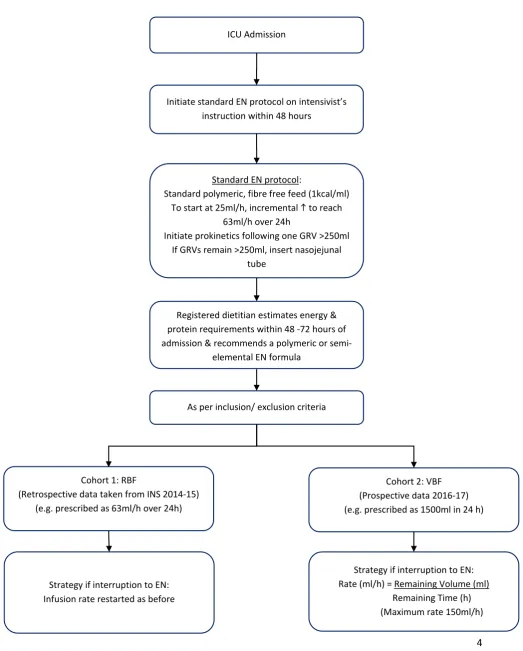
[image:5.595.40.564.143.795.2]10-25ml/hour and prokinetic agents were prescribed. EN was stopped if GRVs were excessive (>500ml).
Figure 1: Feeding Protocol
ICU Admission
Initiate standard EN protocol on intensivist’s instruction within 48 hours
Registered dietitian estimates energy & protein requirements within 48 -72 hours of admission & recommends a polymeric or
semi-elemental EN formula
Cohort 1: RBF
(Retrospective data taken from INS 2014-15) (e.g. prescribed as 63ml/h over 24h)
Cohort 2: VBF (Prospective data 2016-17) (e.g. prescribed as 1500ml in 24 h)
Strategy if interruption to EN: Infusion rate restarted as before
Strategy if interruption to EN: Rate (ml/h) = Remaining Volume (ml)
Remaining Time (h) (Maximum rate 150ml/h) Standard EN protocol:
Standard polymeric, fibre free feed (1kcal/ml) To start at 25ml/h, incremental to reach
63ml/h over 24h
Initiate prokinetics following one GRV >250ml If GRVs remain >250ml, insert nasojejunal
tube
5
Recruitment of Rate Based Feeding Patients (Cohort 1)
Data for RBF patients was collected retrospectively between January and April 2015 as part of an International
Nutrition Survey (Critical Care Nutrition, INS Study Protocol, 2014/15). Of the 48 participants recruited for the INS, 27 met the inclusion criteria for this study.
Recruitment of Volume Based Feeding Patients (Cohort 2)
Consecutive patient data was collected prospectively between March 2016 and March 2017. Patients
that were established on the standard EN protocol or RBF regimen were assessed by the dietitian for
VBF.
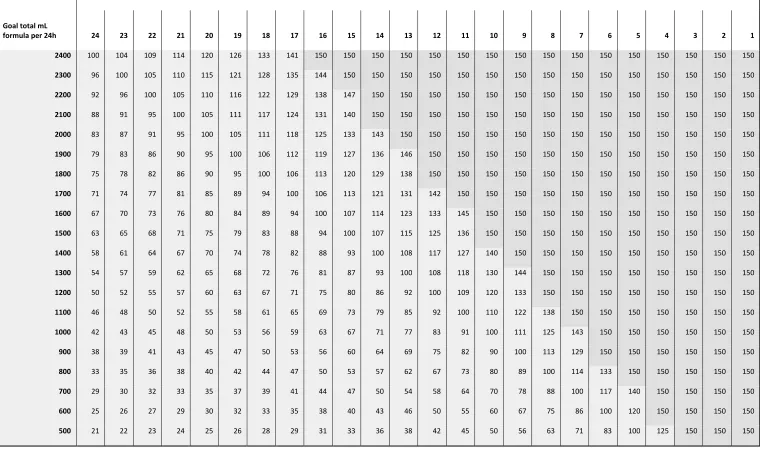
A previously reported VBF protocol [18] was modified and adopted for this study, including using a maximum
rate of 150ml/hour [17] and the pre-calculated algorithm in which the remaining volume has been rounded to
one hundred millilitres volumes (instead of 50 millilitres) to simplify calculations (figure 2). Education before, during and after the implementation of VBF protocol was provided for ICU staff by the unit dietitian.
If patients subsequently developed a poor tolerance to EN, presenting with a single GRV > 250ml, vomiting, blood glucose concentration (>18mmol/l) or profuse diarrhoea (defined as 5 stools or 750 mL per 24h period),
the nurses were permitted to reduce the rate back to a previously tolerated rate or to 25ml/hour, after the
accepted treatments such as prokinetics for high GRV, change of enteral formula for diarrhoea or insulin treatment were unsuccessful.
Data Collection
Patient characteristics, demographics, anthropometry, Acute Physiology and Chronic Health Evaluation II (APACHE II) [23] score and admission details (date and type of admission, i.e. medical/ surgical and aetiology)
were recorded on ICU admission. The goals for requirements were determined by the unit dietitian using predictive formulas such as 25kcal/kg and 1.2-1.5g/kg for protein [10] or Penn State equation [24].
The primary outcome measures were the percentage of energy and protein requirements delivered over the
6
Secondary outcome measures included the number of vomiting episodes, GRV >250ml, prokinetic use,
morning and highest daily blood glucose concentrations in addition to insulin usage. Mechanical ventilation days, ICU and hospital length of stay, ICU and hospital mortality were also collected for 60 days during and
post ICU admission or until discharge/ death.
Statistical Analysis
Statistical analysis was completed using IBM SPSS version 22.0 (U.K version). The power calculation was based
on a similar study [18] which demonstrated improvement in the delivery of EN calories on percentage means of energy delivered for RBF (n=20) at 80.9% (SD = 18.9%) and VBF (n=37) 92.9% (SD = 16.8%) of goal energy
requirements (P < 0.01), with a medium to high effect size of 0.67. A priori analysis with G*Power for a 2-tailed t test of the difference between these independent means (RBF vs VBF), using this effect size, and α
error level of 0.05 with 80% power resulted in a sample size of 36 patients per group (total 72). The tests used
to compare cohort 1 (RBF) and cohort 2 (VBF) were Mann-Whitney U for continuous variables with skewed distributions and independent t tests for normally distributed variables. Chi Square test or Fischer’s Exact test
were used for the categorical data as appropriate. Some differences in patient characteristics between groups
were adjusted for using regression methods. Continuous outcomes were analysed using linear regression, with a log transformation performed before analysis for those outcomes with positively skewed distributions.
7 Figure 2: Volume Based Feeding Schedule
Hours remaining in the day to feed 24h volume
Goal total mL
formula per 24h 24 23 22 21 20 19 18 17 16 15 14 13 12 11 10 9 8 7 6 5 4 3 2 1
2400 100 104 109 114 120 126 133 141 150 150 150 150 150 150 150 150 150 150 150 150 150 150 150 150
2300 96 100 105 110 115 121 128 135 144 150 150 150 150 150 150 150 150 150 150 150 150 150 150 150
2200 92 96 100 105 110 116 122 129 138 147 150 150 150 150 150 150 150 150 150 150 150 150 150 150
2100 88 91 95 100 105 111 117 124 131 140 150 150 150 150 150 150 150 150 150 150 150 150 150 150
2000 83 87 91 95 100 105 111 118 125 133 143 150 150 150 150 150 150 150 150 150 150 150 150 150
1900 79 83 86 90 95 100 106 112 119 127 136 146 150 150 150 150 150 150 150 150 150 150 150 150
1800 75 78 82 86 90 95 100 106 113 120 129 138 150 150 150 150 150 150 150 150 150 150 150 150
1700 71 74 77 81 85 89 94 100 106 113 121 131 142 150 150 150 150 150 150 150 150 150 150 150
1600 67 70 73 76 80 84 89 94 100 107 114 123 133 145 150 150 150 150 150 150 150 150 150 150
1500 63 65 68 71 75 79 83 88 94 100 107 115 125 136 150 150 150 150 150 150 150 150 150 150
1400 58 61 64 67 70 74 78 82 88 93 100 108 117 127 140 150 150 150 150 150 150 150 150 150
1300 54 57 59 62 65 68 72 76 81 87 93 100 108 118 130 144 150 150 150 150 150 150 150 150
1200 50 52 55 57 60 63 67 71 75 80 86 92 100 109 120 133 150 150 150 150 150 150 150 150
1100 46 48 50 52 55 58 61 65 69 73 79 85 92 100 110 122 138 150 150 150 150 150 150 150
1000 42 43 45 48 50 53 56 59 63 67 71 77 83 91 100 111 125 143 150 150 150 150 150 150
900 38 39 41 43 45 47 50 53 56 60 64 69 75 82 90 100 113 129 150 150 150 150 150 150
800 33 35 36 38 40 42 44 47 50 53 57 62 67 73 80 89 100 114 133 150 150 150 150 150
700 29 30 32 33 35 37 39 41 44 47 50 54 58 64 70 78 88 100 117 140 150 150 150 150
600 25 26 27 29 30 32 33 35 38 40 43 46 50 55 60 67 75 86 100 120 150 150 150 150
8
Results
Recruitment and Demographics
A total of 82 patients met the eligibility criteria and were enrolled into the study. Twenty-seven from 48 patients were enrolled pre-VBF implementation from the INS study for the RBF group and 55 out of 56 patients
were enrolled for the VBF group. One patient was excluded from the VBF group after enrolment due to the
development of a gastrointestinal disorder which required parenteral nutrition.
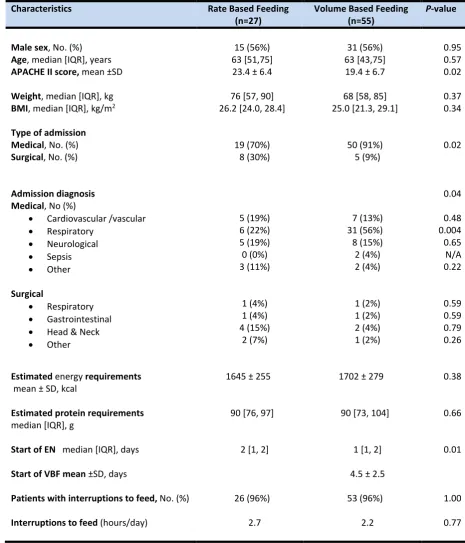
There was a significant difference in APACHE II score (RBF 23.4 vs VBF 19.4; p=0.02), type of admission (p=0.02)
and reason for admission diagnoses (p=0.04) between the groups (see Table 1). Surgical admissions were less
common in the VBF group (9% vs 30%; p=0.02). The majority of patients were admitted for respiratory conditions in both RBF (22.2%) and VBF (59.3%) groups. The VBF group (n=31, 56%) had a higher number of
patients with a medical respiratory diagnosis than the RBF group (p=0.004).
Gastric feeding occurred in most patients; only two patients had post pyloric feeding, both in the VBF group.
Enteral feeding was interrupted at least once in 96% of patients for both cohorts. The primary reason for
these interruptions was fasting for endotracheal intubation or extubation. The mean hours of all daily interruptions between the RBF and VBF was 2.7 vs 2.2 hours per day respectively (p=0.233). The average time
9
Table 1. Demographics and Other Baseline Characteristics
Characteristics Rate Based Feeding
(n=27) Volume Based Feeding (n=55) P-value
Male sex, No. (%) 15 (56%) 31 (56%) 0.95
Age, median [IQR], years 63 [51,75] 63 [43,75] 0.57
APACHE II score, mean ±SD 23.4 ± 6.4 19.4 ± 6.7 0.02
Weight, median [IQR], kg 76 [57, 90] 68 [58, 85] 0.37
BMI, median [IQR], kg/m2 26.2 [24.0, 28.4] 25.0 [21.3, 29.1] 0.34 Type of admission
Medical, No. (%)
Surgical, No. (%) 19 (70%) 8 (30%) 50 (91%) 5 (9%) 0.02
Admission diagnosis Medical, No (%)
• Cardiovascular /vascular
• Respiratory • Neurological • Sepsis • Other Surgical • Respiratory • Gastrointestinal
• Head & Neck
• Other 5 (19%) 6 (22%) 5 (19%) 0 (0%) 3 (11%) 1 (4%) 1 (4%) 4 (15%) 2 (7%) 7 (13%) 31 (56%) 8 (15%) 2 (4%) 2 (4%) 1 (2%) 1 (2%) 2 (4%) 1 (2%) 0.04 0.48 0.004 0.65 N/A 0.22 0.59 0.59 0.79 0.26
Estimated energy requirements
mean ± SD, kcal
Estimated protein requirements
median [IQR], g
1645 ± 255
90 [76, 97]
1702 ± 279
90 [73, 104]
0.38
0.66
Start of EN median [IQR], days
Start of VBF mean ±SD, days
Patients with interruptions to feed, No. (%)
Interruptions to feed (hours/day)
2 [1, 2]
26 (96%)
2.7
1 [1, 2] 4.5 ± 2.5
53 (96%) 2.2 0.01 1.00 0.77
APACHE II, Acute Physiology and Chronic Health Evaluation II, BMI, Body Mass Index; ICU, Intensive Care Unit; EN, enteral nutrition; VBF, volume based feeding.; GRV, Gastric Residual Volume.
kg, kilograms; m, metres; kcal, kilocalories; g, grams;
10
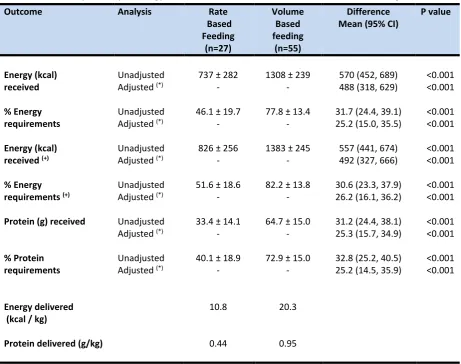
Table 2. Mean Daily Delivery of Energy and Protein from Rate Based and Volume Based Feeding
Outcome Analysis Rate
Based Feeding
(n=27)
Volume Based feeding
(n=55)
Difference
Mean (95% CI) P value
Energy (kcal) Unadjusted 737 ± 282 1308 ± 239 570 (452, 689) <0.001
received Adjusted (*) - - 488 (318, 629) <0.001
% Energy Unadjusted 46.1 ± 19.7 77.8 ± 13.4 31.7 (24.4, 39.1) <0.001
requirements Adjusted (*) - - 25.2 (15.0, 35.5) <0.001
Energy (kcal) Unadjusted 826 ± 256 1383 ± 245 557 (441, 674) <0.001
received (+) Adjusted (*) - - 492 (327, 666) <0.001
% Energy Unadjusted 51.6 ± 18.6 82.2 ± 13.8 30.6 (23.3, 37.9) <0.001
requirements (+) Adjusted (*) - - 26.2 (16.1, 36.2) <0.001
Protein (g) received Unadjusted 33.4 ± 14.1 64.7 ± 15.0 31.2 (24.4, 38.1) <0.001 Adjusted (*) - - 25.3 (15.7, 34.9) <0.001
% Protein Unadjusted 40.1 ± 18.9 72.9 ± 15.0 32.8 (25.2, 40.5) <0.001
requirements Adjusted (*) - - 25.2 (14.5, 35.9) <0.001
Energy delivered
(kcal / kg) 10.8 20.3
Protein delivered (g/kg) 0.44 0.95
Kcal, kilocalories; kg, kilograms; g, grams
Summary statistics are mean ± standard deviation or number (percentage) in each category
11
Primary Outcome
Delivery of Energy and Protein
Table 2 reports the difference in energy and protein delivered between the groups. The VBF patients received
a significantly greater percentage of prescribed energy, including non-nutritious energy from Propofol (82% versus 52%, p<0.001) and protein (73% versus 40%, p<0.001) compared to RBF patients. There was also a
significant difference in percentage energy delivery from EN alone (78% versus 46%, p<0.001). The daily mean
energy and protein calculated over ≤12days indicated that the RBF group received 11kcal/kg and 0.4g protein/kg in contrast to 20kcal/kg and 1.0g protein/kg for the VBF group.
Secondary Outcomes
Safety Outcomes
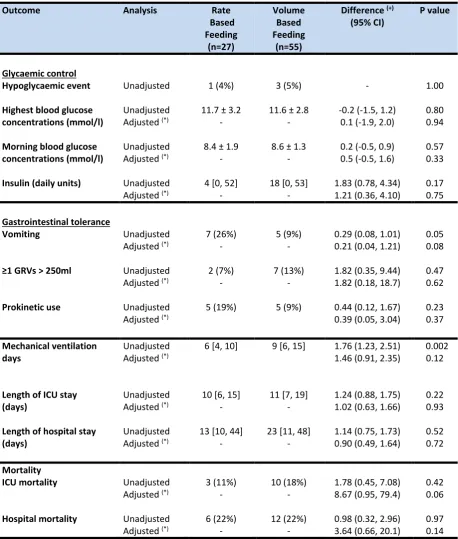
After adjusting for the differences in patient characteristics, there was no significant difference in glycaemic
control, units of insulin administered, episodes of GRV >250mls and prokinetic use between the two groups (Table 3). Vomiting was higher in the RBF group, but this difference was non-significant after adjusting for
confounding factors, such as APACHE II score, admission type, time to start EN and method of estimated
energy requirements (p=0.08).
Patient Outcomes
The results demonstrated a significant difference between groups in the number of days of mechanical
ventilation in the unadjusted analysis (p=0.002), which was no longer statistically significant (p= 0.12) after controlling for APACHE II score, type of admission and time to start EN. There was no significant difference in
12
Rates of Enteral Nutrition Infusion During VBF
The mean ‘average’ rate of infusion for VBF was 54ml/h ± 9.0 and the mean ‘maximum’ rate was 85ml/h ±
32.6. However, in six cases, rates were increased up to a maximum 150ml/hour with no complications
[image:13.595.70.529.220.760.2]observed.
Table 3: Safety and Patient Outcomes
Outcome Analysis Rate
Based Feeding (n=27) Volume Based Feeding (n=55)
Difference (+)
(95% CI) P value
Glycaemic control
Hypoglycaemic event Unadjusted 1 (4%) 3 (5%) - 1.00
Highest blood glucose Unadjusted 11.7 ± 3.2 11.6 ± 2.8 -0.2 (-1.5, 1.2) 0.80
concentrations (mmol/l) Adjusted (*) - - 0.1 (-1.9, 2.0) 0.94 Morning blood glucose Unadjusted 8.4 ± 1.9 8.6 ± 1.3 0.2 (-0.5, 0.9) 0.57
concentrations (mmol/l) Adjusted (*) - - 0.5 (-0.5, 1.6) 0.33 Insulin (daily units) Unadjusted 4 [0, 52] 18 [0, 53] 1.83 (0.78, 4.34) 0.17 Adjusted (*) - - 1.21 (0.36, 4.10) 0.75
Gastrointestinal tolerance
Vomiting Unadjusted 7 (26%) 5 (9%) 0.29 (0.08, 1.01) 0.05 Adjusted (*) - - 0.21 (0.04, 1.21) 0.08
≥1 GRVs > 250ml Unadjusted 2 (7%) 7 (13%) 1.82 (0.35, 9.44) 0.47 Adjusted (*) - - 1.82 (0.18, 18.7) 0.62
Prokinetic use Unadjusted 5 (19%) 5 (9%) 0.44 (0.12, 1.67) 0.23 Adjusted (*) 0.39 (0.05, 3.04) 0.37
Mechanical ventilation Unadjusted 6 [4, 10] 9 [6, 15] 1.76 (1.23, 2.51) 0.002
days Adjusted (*) 1.46 (0.91, 2.35) 0.12
Length of ICU stay Unadjusted 10 [6, 15] 11 [7, 19] 1.24 (0.88, 1.75) 0.22
(days) Adjusted (*) - - 1.02 (0.63, 1.66) 0.93
Length of hospital stay Unadjusted 13 [10, 44] 23 [11, 48] 1.14 (0.75, 1.73) 0.52
(days) Adjusted (*) - - 0.90 (0.49, 1.64) 0.72
Mortality
ICU mortality Unadjusted 3 (11%) 10 (18%) 1.78 (0.45, 7.08) 0.42 Adjusted (*) - - 8.67 (0.95, 79.4) 0.06
13
GRV Gastric Residual Volumes ICU Intensive Care Unit
Summary statistics are mean ± standard deviation, median [inter-quartile range] or number (%) in each category
(*) Adjusted for: APACHE II score, admission type, method of estimated energy requirement, time to start enteral nutrition (EN)
(+) Difference between groups reported as mean difference (normally distributed continuous variables), ratios (skewed continuous variables) or odds ratios (binary variables)
Discussion
This study established that VBF can significantly increase energy and protein delivery in the first 12 days of
intensive care admission. These findings offer further evidence that VBF is a safe, alternative strategy in achieving target energy and protein goals in both clinical and research settings in spite of frequent
interruptions to EN; intending to minimise nutritional deficits which have been associated with improving
clinical outcomes [1, 4, 6, 7]. Volume based feeding has previously been used as part of a multi strategy protocol [17, 20, 21] and has shown to increase energy and protein delivery but it is difficult to determine if
this increase was attributed entirely to VBF. Other contributing components from these studies include the
routine use of protein supplementation (≥24g protein) at initiation of EN; use of a semi-elemental or peptide feed (1.0-1.5kcal/ml); initiation of EN at target rate; use of prophylactic prokinetics on initiation of EN and
higher GRV threshold [17, 20, 21]. Whilst other VBF studies have also successfully improved the delivery of percentage goal energy [18, 19], this is the first study to demonstrate an increase in protein delivery from VBF
alone.
Previous work has demonstrated that during interrupted EN days, there was a statistically significant difference in goal energy delivered between VBF (78%) and RBF (62%) [18]. Our study epitomises the
perpetual interruptions to EN, where 96% (n=79) of patients experienced routine interruptions of 2.7 hours
per day (RBF) and 2.2 hours per day (VBF), with no significant difference between the two groups. We identified various reasons for interruptions to EN during our study, primarily fasting for endotracheal
intubation or extubation; in addition to medical investigations or procedures, drug administration, an inaccessible gastrointestinal tract or enteral tube displacement. The delays in extubation or possible
re-intubation, resulted in EN being held for long periods and on consecutive days, leading to difficulties making
14
Observational studies on mechanically ventilated patients have demonstrated that providing at least 80% of
energy [27] and protein [28] target was associated with improved clinical outcomes, in particular patients with a higher nutritional risk [2]. However, there is currently debate on the most efficacious dose of energy and
protein to optimise patient outcomes, especially in the early phase of critical illness. Current guidelines recommend 20-25kcal/kg and 1.2-2.0g protein per day [10, 12]. Although our VBF group succeeded in meeting
80% of goal energy, this did not translate into improved clinical outcomes, with the study insufficiently
powered for such aspects. In addition, despite a significant increase in protein delivery, it fell short at 73%. The barriers in providing adequate protein can be related to the additional provision of energy from
non-nutritious sources such as Propofol, glucose containing infusions and citrate anticoagulation used in continuous venovenous haemofiltration [29]; which often requires a reduction in energy from EN,
subsequently reducing protein provision. Patients will benefit from EN formulas modified to avoid overfeeding
exogenous energy and using higher protein formulas or protein supplementation together with VBF [17].
This is a study exploring the delivery of energy and protein, safety and clinical outcomes of VBF, which is a
relatively novel approach to EN delivery in the UK. It measures the impact of VBF on both gastrointestinal
tolerance and glycaemic control. Our results suggest that VBF was delivered safely, with no significant difference in gastrointestinal tolerance, including GRV, vomiting, prokinetic use, glycaemic control and insulin
use compared to RBF. The intensive monitoring of GRVs for EN tolerance is currently under question but was included as another measure of safety for this study. Holding or reducing EN is common after a GRV >250ml,
contributing to further interruptions and resulting in a reduction in the volume of EN received and an energy
deficit [5]. Recent research findings [25,26] of patients predominantly with medical diagnoses indicate that monitoring GRVs may be unnecessary and that this, in turn, may assist in further reducing EN interruptions.
This study found that GRVs were unaffected by VBF despite being perceived as more aggressive and less likely to be tolerated with potentially faster rates than RBF. Similar studies comparing VBF with RBF, demonstrated
no difference in gastrointestinal tolerance and pulmonary aspiration [18], ventilator acquired pneumonia
(VAP) and urinary tract infections [19]. The anticipated concerns relating to the implementation of VBF in ICUs are the higher rates of hourly EN delivery, leading to vomiting and aspiration of EN resulting in an increase in
mechanical ventilation days. Our study demonstrated that irrespective of higher respiratory diagnoses in our
15
mechanically ventilated days, VBF strategy had no significant effect (p= 0.12). Our findings together with
several studies [17-21] suggest vomiting was also not increased (p= 0.08). This is presumably related to VBF patients in this study being selected based on having good gastrointestinal function and previously tolerating
EN.
Data relating to nutritional intake and tolerance was collected from day 1 of admission up to day 12 or until
discharge from ICU. We recognise that EN delivery in the early acute phase is often difficult and it remains
uncertain whether VBF is a suitable strategy at admission [13]. However, it is conceivable that VBF may be beneficial when patients are established on EN post-acute phase and in their recovery phase, over a longer ICU
stay. The average number of days from admission to start of VBF in this study was 4.5 ± 2.5.
Our study was conducted in a mixed medical and surgical adult ICU in England, UK. The characteristics of
patients were broadly representative and, as a pragmatic effectiveness study, probably represent the reality of
current nutritional practice in critical care in the UK. It is notable that the mean APACHE II score for VBF and RBF patients recruited to this study was 23.4 ± 6.4 and 19.4 ± 6.7 respectively, similar to the mean APACHE II
(20.5 ± 8.5) of intensive care patients in the UK [22]. A similar study by Haskins et al investigated VBF on
intensive care patients in United States America (USA) with median APACHE II scores of 10 (8, 16) and 17 (12, 19) for RBF and VBF groups respectively [19]. The original single centre (USA) VBF study by McClave et al [18]
confirmed safe and improved energy delivery in patients with a mean Simplified Acute Physiology Score (SAPS) score of 21.7 ± 9.0 19.5 ± 9.3. Our UK study demonstrated that VBF can be tolerated in patients with a higher
disease severity. Although the practice of critical care medicine is universal in most countries, there can be
differences in disease severity and populations in this already heterogeneous patient group [22] and these previous VBF studies [18,19] might not be generalisable to critical care populations outside North America.
Strengths of this study include a heterogeneous, adult population in a UK single centre ICU that had
pre-existing, established protocols and guidelines for managing nutritional support, raised GRVs and glycaemic control, reflecting good mainstream practice [9, 10, 12]. Despite using a convenience sample from the INS
data for cohort 1, the same inclusion and exclusion criteria was used for selection for both cohorts.
The non-randomised controlled design, single centre population that had a greater representation of medical
16
including VBF have demonstrated an improvement of nutrition delivery in medical patients [3, 17, 21] but did
not have the same effect in surgical patients [30]. The low frequency of gastrointestinal complications for our VBF group could be due to the selection of patients that were already established on EN. Comorbidities and
Nutrition Risk in Critically ill (NUTRIC) or other nutrition screening scores were not collected but might have influenced secondary outcomes such as lower mortality and faster time to discharge alive, in that patients with
higher nutritional risk may benefit more from optimal provision of energy and protein compared with those
with lower risk [2, 31, 32,].
Other limitations include, the small sample size and therefore, underpowered to determine statistical
significance for secondary outcomes. The regular education sessions held on VBF for ICU nurses and doctors possibly heightened awareness of nutrition on the unit, contributing to better EN delivery in the VBF cohort.
The patients for the two cohorts were recruited over a year apart. During that time the ICU updated its’ GRV
threshold to 350ml (from 250ml) before VBF was implemented, therefore, to avoid bias, GRVs recorded by nurses at 250ml or above were considered as ‘high’ for both groups. Protein supplementation was also
introduced during this period however, it was not routine practice. When protein supplementation was
prescribed in 19% of the intervention group, nurses did not routinely administer it, having little effect on total protein intake. Finally, indirect calorimetry was not available and predictive equations were used which are
less reliable [33, 34].
In future, a more robust, adequately powered randomised controlled trial, including more surgical patients is
recommended to investigate the impact of the VBF protocol on nutrition delivery. The use of body
composition analysis, functional or health related quality of life (HRQOL) measures as primary outcomes to evaluate nutrition intervention may be more suitable than mortality and infectious complications [35].
In conclusion, this study described an alternative strategy to the RBF protocol. It confirmed that compared to
RBF, VBF protocol can be successfully implemented to significantly enhance the delivery of EN safely, with no adverse effect on glycaemic control and gastrointestinal tolerance. However, despite this improvement, there
was no beneficial effect observed on clinical outcomes, as it was underpowered to do so. This study’s findings should encourage the development of a robust, adequately powered randomised controlled trial to investigate
17
List of Abbreviations
APACHE II: Acute Physiology and Chronic Health Evaluation
ASPEN: American Society of Parenteral and Enteral Nutrition
BAPEN: British Association of Parenteral and Enteral Nutrition
BMI: Body Mass Index
CCPG: Canadian Clinical Practice Guidelines for nutrition
EN: Enteral Nutrition
ESPEN: European Society of Parenteral and Enteral Nutrition
GRV: Gastric Residual Volumes
ICU: Intensive Care Unit
INS: International Nutrition Survey
IQR: Inter Quartile Range
LOS: Length of Stay
RBF: Rate Based Feeding
SD: Standard Deviation
18
Acknowledgements
We would like to thank Health Education England/ National Institute of Health Research (NIHR) for funding this project and extend my thanks to all the staff on the intensive care unit for their support.
Conflicts of Interest
19
References
1. Alberda C, Gramlich L, Jones N, Jeejeebhoy K, Day AG, Dhaliwal R, Heyland, DK (2009) The relationship
between nutritional intake and clinical outcomes in critically ill patients: results of an international multicenter observational study. Intensive Care Medicine 35(10):1728-37 doi: 10.1007/s00134-009-1567-4
2. Compher C, Chittams J, Sammarco T, et al (2017) Greater protein and energy intake may be associated with improved mortality in higher risk critically ill patients: A multicenter, multinational observational study. Crit Care Med 45:156–163. doi: 10.1097/CCM.0000000000002083
3. Heyland DK, Dhaliwal R, Wang M, Day AG (2015) The prevalence of iatrogenic underfeeding in the nutritionally ‘at-risk’ critically ill patient: Results of an international, multicentre, prospective study. Clin Nutr 34:659–66. doi: 10.1016/j.clnu.2014.07.008
4. Villet S, Chiolero RL, Bollmann MD, et al (2005) Negative impact of hypocaloric feeding and energy balance on clinical outcome in ICU patients. Clin Nutr 24:502–9. doi: 10.1016/j.clnu.2005.03.006
5. Dvir D, Cohen J, Singer P (2006) Computerized energy balance and complications in critically ill patients: an observational study. Clin Nutr 25:37–44. doi: 10.1016/j.clnu.2005.10.010
6. Tsai J-R, Chang W-T, Sheu C-C, et al (2011) Inadequate energy delivery during early critical illness correlates with increased risk of mortality in patients who survive at least seven days: A retrospective study. Clin Nutr 30:209–214 . doi: 10.1016/j.clnu.2010.09.003
7. Mault J (2000) Energy balance and outcome in critically ill patients: results of a multi-centre, prospective, randomised trial by the ICU Nutrition Study Group. J Parenter Enter Nutr 24: S4
8. Barker LA, Gout BS, Crowe TC (2011) Hospital malnutrition: prevalence, identification and impact on patients and the healthcare system. Int J Environ Res Public Health 8:514–27. doi: 10.3390/ijerph8020514
9. Reintam Blaser A, Starkopf J, Alhazzani W, et al (2017). Early enteral nutrition in critically ill patients: ESICM clinical practice guidelines. Intensive Care Med. 43(3):380-398.
10. Kreymann KG, Berger MM, Deutz NEP, et al (2006) ESPEN Guidelines on Enteral Nutrition: Intensive care. Clin Nutr 25:210–23. doi: 10.1016/j.clnu.2006.01.021
11. Dhaliwal R, Cahill N, Lemieux M, Heyland DK (2014) The Canadian Critical Care Nutrition Guidelines in 2013. Nutr Clin Pract 29:29–43. doi: 10.1177/0884533613510948
12. McClave SA, Taylor BE, Martindale RG, et al (2016) Guidelines for the Provision and Assessment of Nutrition Support Therapy in the Adult Critically Ill Patient. J Parenter Enter Nutr 40:159–21. doi:
20
13. Arabi YM, Casaer MP, Chapman M, et al (2017) The intensive care medicine research agenda in nutrition and metabolism. Intensive Care Med. 43:1239–1256
14. Critical Care Nutrition. Canadian Clinical Practice Guidelines 2015. Summary of Revisions to the Recommendations.
https://www.criticalcarenutrition.com/docs/CPGs%202015/Summary%20CPGs%202015%20vs%202013.pdf Accessed on 28 March 2017.
15. McClave SA, Sexton LK, Spain DA, et al (1999) Enteral tube feeding in the intensive care unit: factors impeding adequate delivery. Crit Care Med 27:1252–6
16. Peev MP, Yeh DD, Quraishi SA, et al (2015) Causes and Consequences of Interrupted Enteral Nutrition. J Parenter Enter Nutr 39:21–27. doi: 10.1177/0148607114526887
17. Heyland DK, Cahill NE, Dhaliwal R, et al (2010) Enhanced protein-energy provision via the enteral route in critically ill patients: a single center feasibility trial of the PEP uP protocol. Crit Care 14: R78. doi: 10.1186/cc8991
18. McClave SA, Saad MA, Esterle M, et al (2015) Volume-Based Feeding in the Critically Ill Patient. J Parenter Enter Nutr 39:707–712. doi: 10.1177/0148607114540004
19. Haskins IN, Baginsky M, Gamsky N, et al (2017) Volume-Based Enteral Nutrition Support Regimen Improves Caloric Delivery but May Not Affect Clinical Outcomes in Critically Ill Patients. J Parenter Enter Nutr 41:607–611. doi: 10.1177/0148607115617441
20. Taylor B, Brody R, Denmark R, et al (2014) Improving Enteral Delivery Through the Adoption of the ‘Feed Early Enteral Diet Adequately for Maximum Effect (FEED ME)’ Protocol in a Surgical Trauma ICU. Nutr Clin Pract 29:639–648. doi: 10.1177/0884533614539705
21. Heyland DK, Murch L, Cahill N, et al (2013) Enhanced protein-energy provision via the enteral route feeding protocol in critically ill patients: results of a cluster randomized trial. Crit Care Med 41:2743–53. doi: 10.1097/CCM.0b013e31829efef5
22. Wunsch H, Angus DC, Harrison DA, et al (2011) Comparison of Medical Admissions to Intensive Care Units in the United States and United Kingdom. Am J Respir Crit Care Med 183:1666–1673. doi:
10.1164/rccm.201012-1961OC
23. Knaus WA, Draper EA, Wagner DP, Zimmerman JE (1985) "APACHE II: A severity of disease classification system", Critical Care Medicine 13 (10):818-829.
21
25. Reignier J, Mercier E, Le Gouge A, et al (2013) Effect of not monitoring residual gastric volume on risk of ventilator-associated pneumonia in adults receiving mechanical ventilation and early enteral feeding: A randomized controlled trial. JAMA - J Am Med Assoc 309:249–256. doi: 10.1001/jama.2012.196377
26. Montejo JC, Miñambres E, Bordejé L, et al (2010) Gastric residual volume during enteral nutrition in ICU patients: The REGANE study. Intensive Care Med 36:1386–1393. doi: 10.1007/s00134-010-1856-y
27. Heyland DK, Cahill N, Day AG (2011) Optimal amount of calories for critically ill patients: Depends on how you slice the cake! Crit Care Med 39:2619–2626. doi: 10.1097/CCM.0b013e318226641d
28. Nicolo M, Heyland DK, Chittams J, et al (2016) Clinical Outcomes Related to Protein Delivery in a Critically Ill Population. J Parenter Enter Nutr 40:45–51. doi: 10.1177/0148607115583675
29. Andrea M New, Erin M Nystrom, Erin Frazee, John J Dillon, Kianoush B Kashani, John M Miles (2017) Continuous Renal Replacement Therapy: A potential source of calories in the critically ill. The American Journal of Clinical Nutrition 105: 1559–1563. doi.org/10.3945/ajcn.116.139014
30. Declercq B, Deane AM, Wang M, et al (2016) Enhanced Protein-Energy Provision via the Enteral Route Feeding (PEPuP) protocol in critically ill surgical patients: a multicentre prospective evaluation. Anaesth Intensive Care 44:93–98. doi: 10.1097/CCM.0b013e31829efef5
31. Heyland DK, Dhaliwal R, Jiang X, Day AG (2011) Identifying critically ill patients who benefit the most from nutrition therapy: the development and initial validation of a novel risk assessment tool. Crit Care 15:R268
32. Rahman A, Hasan RM, Agarwala R, Martin C, Day AG, Heyland DK (2015) Identifying critically-ill patients who will benefit most from nutritional therapy: further validation of the “modified NUTRIC” nutritional risk assessment tool. Clin Nutr 35:158–162
33. Walker RN, Heuberger RA (2009) Predictive equations for energy needs for the critically ill. Respir Care 54:509–521
34. Tatucu-Babet OA, Ridley EJ, Tierney AC (2016) Prevalence of Underprescription or Overprescription of Energy Needs in Critically Ill Mechanically Ventilated Adults as Determined by Indirect Calorimetry. J. Parenter. Enter. Nutr. 40:212–225