ARTICLE DETAILS
Article History:
Received12 November 2017 Accepted12 December 2017 Availableonline1January2018
ABSTRACT
Thepurposeofthis studyistoevaluatethe performanceand changeinthe technical as wellastechnological efficiencyinthetotal factorproductivityofthe34food processing industries inMalaysia,and toinvestigatethe changesintheirefficiencyfrom2009 to2010 byapplying tworecentmethodsofdataanalysis,namelyorder-mand Malmquist productivity index. The results show that almost all industries have experienced an efficient technological contribution intheir respective productionfunctions, but there arewide dissimilarities in the technical efficiencyoftheorganiccompositionofeachindustry.Also,therearevariationsinthechangeinefficiency scores from2009to2010.
KEYWORDS
MalmquistProductivityIndex,Order-m,Technical Efficiency,Technological Efficiency,Total FactorProductivity, Organiccomposition.
1. INTRODUCTION
Malaysia is a highly open, upper-middle income economy. The food processingindustry,alongwithotherindustries,playsavitalroleinthe economyofMalaysiabycreating employment,marketoutlets and adding valuetoprimaryagriculturalproducts[1].Withouttheproperprocessing offood, higher productivityof both the industry and the economyin general is,perhaps,unachievable.Moreover,ifacountrycannotstockits producedfoodforalong time,thepossibilitiesforexportingarelimitedto freshfood withtheassociatedhighercosts.Themoreacountryis ableto efficientlyand productively produceagood, themorelikely thecountry willhaveanabsoluteand acomparativeadvantageintheinternational market.And acountryneeds comparativeadvantagetoacquirehigher gains fromtrade[2].Thisstudy willfocus onefficiencyand productivityof the Malaysian food processing industry by applying recent non-parametricapproaches todatainterpretation.
Though Malaysia has been exporting processed food since 1964, it typicallyrunsatradedeficitinfood, althoughthishasdeclined recently [3].In2012,Malaysiaexported morethanRM11billionoffood to200 countries with imports ofprocessed food valued atmorethan RM30 billion[4].In2015,Malaysiaachieved atrade surplus inprocessedfood withexportsofapproximatelyRM18.02billion,andimports ofRM17.8 billion[5].Gains fromtradehaveincreased fromtheexportofedible products and preparations,cocoaand cocoa preparations,cerealsand flour. Its major export destinations were Singapore, Indonesia, USA, Thailand, and RepublicofChina[4, 5]. Topromotegrowth,theMalaysian Government haslaunchedthe National Agricultural Policy (NAP), the BalanceofTrade(BOT)Policy,theIndustrialMasterPlan(for1986-1995, 1996-2005and 2006-2020)andthe NationalAgro-Food Policy (2011-2020)[6].
Inorderto understandand sustainthe efficiencyand productivityof Malaysianfoodprocessing industries forfuturegains oftrade,thereis a need forin-depth analysiswithsectoral datausing recentlydeveloped statisticalmethods.This studyis anattemptto illustratethe ranking, efficiency, total factor productivity and overall competitiveness of Malaysianfoodprocessing industries.Thedataiscollected bythesurvey
conducted inthestudyyearas the partofpost-doctoral studyof the corresponding author.Sinceitisdifficulttocollectseveralyears’data,the keyfocusofthisstudyis notonly toanalyzethedatabutalsodemonstrate howrecentstatistical methods canbeused forthistypeofanalysis.The outcomeofthis research canbeapplicable tootherindustries especially atthesectoral level. Thearticleisorganizedasfollows:Section1contains theintroduction,literaturereview,researchgaporproblemand objective ofthestudy;Section 2 discusses themethodology;Section 3 illustrates the dataand variables;Section 4 presents results and interpretationofthose results and finallySection5discusstheconclusionand policyimplications ofthisresearch.
2. LITERATURE REVIEW
Therehavebeenanumberofstudies onthesameorsimilartopicsusing conventionalapproachestodata interpretation.Forexample,agroup scientistinvestigatedthecompetitivenessand comparativeadvantageof theMalaysianfood processingindustrybyintroducing netsocialprofit (NSP),domesticresourcecost(DRC)and thesocial cost-benefit(SCB)ratio attheproductionlevel and Porter’s diamond approach atthefirmlevel
[7]. Theyproposed thatthe industryhas comparative advantages at differentmagnitudes.Theyfound theNSP indices tobequitewide and suggested thatthereis aneed toimprovetheresourceallocationfromlow tohigh comparativeadvantagesectors.Theirresult alsosuggested thatthe food processing industryinMalaysiawas gainingcompetitiveness. Agroupresearcherhas investigated a verysimilar topicbut applied slightly differentmethods. Themain objective of their studywas to investigateand measurecompetitiveness among variousproducers of foodproductsinMalaysia[2].Theirstudyinvolvedanalysisofquantitative dataof20foodprocessingindustriesinMalaysiafromtheyear2000to 2008byimplementingfinancialanalysis usingnetpresentvalue(NPV), internal rateofreturn(IRR),profitabilityindex(PI)andpay-backperiod (PP),as wellas thePolicyAnalysis Matrix(PAM)model.Theyfound that Malaysiaenjoys anaboveaveragelevel ofcomparativeadvantageinthe productionoftwentyfood products,especiallyinfishand palm oil, the latter of which has greater comparative advantage than other food productionprocesses becauseithad thelowestDRCamong allproducts.
M
alaysian Jo
urna
l
of
Su
stainable
A
gricultur
e
(MJSA)
DOI : http://doi.org/10.26480/mjsa.01.2018.19.28
A COMPARATIVE ANALYSIS OF THE EFFICIENCY AND PRODUCTIVITY OF SELECTED FOOD
PROCESSING INDUSTRIES IN MALAYSIA
Munshi Naser Ibne Afzal1*, Roger Lawrey2, Mir Shatil Anaholy3, Jhalak Gope4
1 Faculty of Business, Economics and Accountancy, University Malaysia Sabah, Kota KInabalu, Sabah, Malaysia.
2 School of Commerce, University of Southern Queensland (USQ), Toowoomba, Australia.
3 Research Assistant, Shahjalal University of Science and Technology, Sylhet.
4 Shahjalal University of Science & Technology (SUST), Bangladesh.
*Corresponding Author email: [email protected]; [email protected] ISSN: 2521-2931 (Print)
MalaysianJournal ofSustainable Agriculture(MJSA)2(1)(2018) 19-28
Themainobjectiveofthis studyis tocomprehend thecompetitivenessand efficiencyofthefood processing industryduring theinitial period ofthe introductionofvariouspolicies which wereintended topromotegrowth ofthis sector.Thekeydifferencebetweenthepreviousstudiesandthis studyis thatthisstudy analysesdatafortheyears2009and 2010by applyingtwocontemporarynon-parametricmethodsofanalysis(seeNote 2 inAppendix),namelytheMalmquistproductivityindex(MPI)and order-mpartial frontieranalysis.Itis believed thattheapplicationofthesetwo modernapproaches todatainterpretationwillenablefutureanalystsof similartopics tocompareresults ofthemostrecentyears with thoseofthe initialperiodmorecomprehensively,broadlyand systematically. Manypreviousstudies haveused MPIanalysis and order-manalysis.Some researcher performed an empirical investigation into the regional innovationsystems (RIS)which studied theinfluenceofinterrelationships among education, knowledge transfer, linkage and communications, regulatory quality, cost of doing business, trade openness, R&D expenditureand high-tech exportsinoveralleconomicgrowth[8].This paper applied the non-parametric robust partial frontier order-m approach in cross-section data analysis. This enabled the study of behaviors ofindividual sectors inthecourseoftheoverallperformanceof theeconomy.
Inotherhand,studyofproductivityanalysisofASEANeconomiesinthe transitiontowardsaknowledge-basedeconomy,applied theMalmquist ProductivityIndex(MPI)analysis [9].Themainpurposeofthisstudy was toanalyzethenatureand extentofproductivitychanges inCobb-Douglas production function components and the growth of the knowledge economy of selected ASEAN countries, namely Malaysia, Indonesia, Philippines,Thailand,SingaporeplusSouth Korea.Thisstudyused data envelopmentanalysis(DEA)and MPIanalysis toestimatetheindividual country’sefficiencyand productivitychanges.This aided theanalysisof thecontributionof technologicalas wellas technicalefficiencyinthe efficiency change of total factor productivity, which issimilar to the approach ofthis study.
Aresearcher alsohas usethe random coefficient frontierproduction functiontoshow thatinputgrowthis akeyfactorcontributing tooutput growth inBangladeshfortheperiod 1981to1991[10].This empirical study showed thatlow capital realizationlowered theperformanceofthe overallfood processing sectordespiteeconomicreforms.
Thefirstempirical work separating technical efficiencyfromtechnological progress as contributors tototal factorproductivitywas introduced bya groupresearcher[11].Technicalefficiencyis theextenttowhich firms are abletoproduceonthe“best-practice”productionfunctionthatspecifies
thefrontierofoutputs forallpossibleinput-outputcombinations.This technical efficiencymaybetheresult ofthings such as learning bydoing, diffusionofnew technological knowledge,improvedmanagerial practice, short run adjustment to external shocks and changes in theorganic compositionofthefirm(seeNote 1 inAppendix).Theextenttowhich firms areunabletoproduceonthis frontierisreferred toastechnical inefficiency.Ontheotherhand, technological progress(change,efficiency) is definedasariseinthebest-practiceproductionfrontier.
2.1 Research Gaps
Previousstudies thathavemeasured productivityand efficiencyinthe contextofthe Malaysianfood processing industryappeartohaveleft significantresearchgaps as follows:
1. Veryfewempirical workshavemeasuredtotal factorproductivity and technological change efficiency of the Malaysian food processing industry.Separateinvestigations oftheperformanceof technologicalandtechnicalefficiencyhavealsonotbeenfound.In addition,acomprehensiveanalysis ofthesectoralcontributions of organiccompositionand technologytototal factorproductivityis inadequate. These gaps support the application of a precise comparativeanalysis method formeasuring thecompetitivenessof theindustry.
2. Theclarificationoftechnical and technological intensivenessfor determining thecomparativeadvantageamong theindustries is alsoabsentinthepriorstudies.
3. Themethodology used inthis study can be extended to other industries while measuring total factor productivity, competitiveness and efficiencyusing uptodatemethodologies such as MPIand Orderm.
2.2 Research Objective
The main purpose of this study is to investigate, in depth, the competitiveness and theperformanceofthefood processing industries in Malaysiabyusing twonew non-parametricmethods,namely Malmquist Productivity Index and Order-m analysis. The main reason behind applying thesemethodsis toobservenotonly theefficiencyscores butalso thesensitivity of the organic compositionand productiontechnology which playsignificantroles inincreasing thetotal factorproductivityof theindustries.
3. METHODOLOGY
As stated before,accordingtothepurposeofthestudy,this studywill involvetwomethods ofdataanalysis forthedecisionmaking, namely MalmquistProductivityIndex(MPI)analysisandOrder-mPartial Frontier approach.
3.1 Malmquist Productivity Index (MPI)
TheMalmquistProductivityIndexis abilateral indexthatcanbeusedto comparetheproductiontechnologyoftwoormoreeconomies orsectors. Itwasdeveloped byStenMalmquist.This method willbeused becauseit has anumberofdesirable features suitableforthis study.First,Malmquist indexesareunitindependentandtheydonotrequireinputoroutput prices in their construction. Second, the computation is relatively straightforward, as demonstrated bysomeresearcher[12].Third, theMPI can accommodate multiple inputs and outputs without having to aggregatethem.Fourth,MPIhas twocomponents –technical efficiency changeand technologicalchange[12].Technical efficiencyrefers tothe abilitytouseaminimal amountofinputtoproduceagivenlevel ofoutput. Ontheotherhand,technological efficiencymeanstheabilitytocombine theinputs mostefficientlyinordertoproducethe maximumlevelof output.Overtime,thelevel oftheoutputofanindustrywillincreasedue totechnological changesthataffecttheabilitytooptimallycombineinputs and outputs. Thus, for any organization in an industry, productivity improvementsovertimemaybeeithertechnical efficiencyimprovements (catching up with their own frontier) or technological improvements (becausethefrontieris shifting up overtime),orboth[13].
Astudyhas shownthatproductivityand efficiencyarethe indexes of competitiveness [14].Anotherstudiesalsostated thatproductivityand efficiencyarethemostreliable measurestofcompetitiveness[15].The importanceofanalyzing thesetwocomponents is thatitprovides insight intothesources ofchangeintotal factorproductivity.Thefifth desirable featureis thattheoriginalMPIassumes constantreturnstoscaleforthe production process. As a result, if the production process displays decreasing returns to scale the original MPI typically overestimates productivitychangeorunderestimates itforincreasing returns toscale.A groupresearcherrecommended theuseofageneralized MPI,tocopewith the issue of variable returns to scale, that includes an additional component,called scale index,torepresenttheeffectofeconomies ofscale onproductivity[12].Scaleefficiencyreferstotheextentanorganization cantake advantageofreturns toscale byaltering its sizetowards optimal scale. Aresearcher also echoed that MPI does have the accuracy in measuring theproductivitychangeunderanappropriatecharacterization of the technology [16].Sixth, the MalmquistDEA approach measures efficiency forone year,relative to the prior year, while allowing the efficiencyfrontiertoshift.Sopositivetotal factorproductivitygrowth is indicatedbyavaluegreaterthanunity,whereasavaluelessthanunity indicates productivitydecline.
There are two approaches to measuring productivity by using the Malmquist productivity index. One is the output-oriented Malmquist productivityindexwhich isthewaytomeasureachangeinproductivity toseehow much moreoutputhasbeenproduced, usingagiveninputlevel and thepresentstateoftechnology,relativetowhatcouldbeproduced underagivenreferencetechnologyusingthesameinputlevel. Anotheris input-orientedMalmquistproductivityindexwhichisthewaytomeasure thechangeinproductivitybyexamining thereductionininputusethatis feasiblegiventheneedtoproduceagivenlevelofoutputunderareference technology [17]. This study concentrates on the output-oriented Malmquistproductivityindexforanalysis.
Thefunctional definitionofDEAMPIis as follows:
𝑀𝑡+1(𝑋𝑡+1, 𝑦𝑡+1, 𝑋𝑡, 𝑦𝑡) = [𝐷𝑡(𝑥𝑡+1,𝑦𝑡+1) 𝐷𝑡(𝑥𝑡,𝑦𝑡)
𝐷𝑡+1(𝑥𝑡+1,𝑦𝑡+1) 𝐷𝑡+1(𝑥𝑡,𝑦𝑡) ]
1
2 (1)
Where 𝐷𝑡is adistancefunctionmeasuringtheefficiencyofconversionof
inputs 𝑥𝑡tooutputs 𝑦𝑡intheperiod t.DEAefficiencyis considered a
distance measure in the literature as it reflects the efficiency of input/outputconversionofDMUs.Infact,ifthereis achangeintechnology thefollowing yearwhich is(t+1),then 𝐷𝑡+1(𝑥𝑡, 𝑦𝑡) willbetheefficiencyof
alteringinputinperiod ttooutputinperiod t ≠ 𝐷𝑡(𝑥𝑡, 𝑦𝑡).Hence,itcan
besaidthattechnicallyMalmquistProductivityIndex(MPI)isageometric averageoftheefficiencyand technological changesinthetworeferenced periodsand itisthus canbewrittenas:
𝑀𝑡+1(𝑋𝑡+1, 𝑦𝑡+1, 𝑋𝑡, 𝑦𝑡) = [𝐷𝑡+1(𝑥𝑡+1,𝑦𝑡+1) 𝐷𝑡(𝑥𝑡,𝑦𝑡) ][
𝐷𝑡(𝑥𝑡+1,𝑦𝑡+1) 𝐷𝑡+1(𝑥𝑡+1,𝑦𝑡+1)
𝐷𝑡(𝑥𝑡,𝑦𝑡) 𝐷𝑡+1(𝑥𝑡,𝑦𝑡)]
1 2 (2)
or,M = ET
whereMstands forproductivityindex,Eis thetechnical efficiencychange and Tis thetechnologychange.EmeasuresthechangeintheCRStechnical efficiencyofperiod t+1overthatinperiod t.IfEis greaterthan1,Itis assumedthatthereis anincreaseinthetechnicalefficiency.However,T represents the average technological change over the two referred periods.
3.2 Order-m Frontier Approach
Thestudydiscussesorder-mfrontierinanon-technicalwayforeasier access toabroaderaudience.IncontrasttotheFDHorDEAapproach,the ideabehind theorder-mapproach is tocompareonesector’s performance witharandomlydrawnsub-sampleofsectors’performanceinsteadof evaluating onesectorwithrespecttotheperformanceofallothersectors [18].Theresearcherhas tospecifythesub-sample size,whichis denoted as m,giving thenametotheprocedure.Forinstance,this studyworked over34observations;therefore,themcanbe5,10,15,20,25,30etc.For simplicity,thestudytook m = 20and m = 25forpartial frontierand m = 34forfullfrontieranalysis.Afzal applied thenonparametricrobustpartial frontierorder-mapproachtodeterminethefrontierregioninhisstudy [8]. Theevaluation ofsectors’ individual performances is done in an identical style tothat ofthe DEA or FDH approach based on partial frontiers. The order-m performance measure contains most of the characteristics oftheFDH orDEAmodel. Inaddition,itisless sensitiveto
outliers and noiseinthedataas thepartial frontieris notenveloping all observations [18].
Theprimaryideaofthe unconditional order-m is straightforward. For instance,inamultivariatecase,consider(𝑥0, 𝑦0)astheinputsand outputs oftheunitofinterest.(𝑋1, 𝑌1),...,(𝑋𝑚, 𝑌𝑚)aretheinputsandoutputs of
m randomly drawnunits thatsatisfy 𝑋𝑖≤ 𝑥0. 𝜆𝑚(𝑥0, 𝑦𝑜) measuresthe
differencebetweenpoint 𝑦0and theorder-m frontierof 𝑌1,..., 𝑌𝑚.This can
bewrittenas:
𝜆𝑚(𝑋0, 𝑦0) = 𝑚𝑎𝑥(𝑖=1…𝑚){𝑚𝑖𝑛𝑗=1…𝑞( 𝑌𝑖𝑗
𝑦𝑗)} (3)
With 𝑌𝑖𝑗(𝑦𝑗) with the 𝑗𝑡ℎcomponentof 𝑌
𝑖(of 𝑦0 respectively)theorder-m
efficiencymeasureofunit(𝑥0, 𝑦0)is defined as:
𝜆𝑚(𝑋0, 𝑦0) = 𝐸[𝜆𝑚(𝑋0, 𝑦0) ↕ 𝑋 ≤ 𝑥0] (4)
Theobtained performancemeasures theradial distanceoftheunittothe order-mfrontier.Notethatinanycase,aunitis atleastcomparedtoitself which results inaperformancescoreofone.Foranextensivetreatmentof theconditional andunconditional order-mapproach see[19,20]. 4. DATA AND VARIABLES
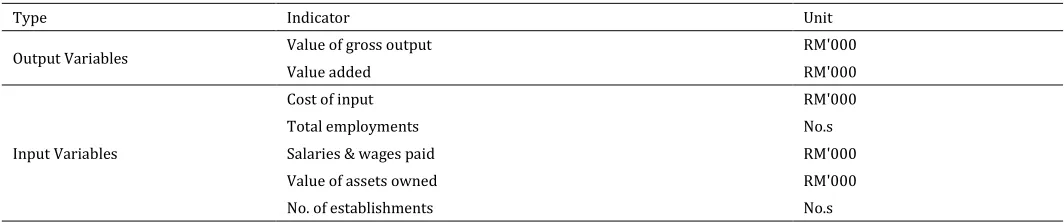
[image:3.596.32.564.404.515.2]Table 1 showsthesummaryofdifferentnumerical indicators used as input and outputvariables.Thisstudyused CostofInput,TotalEmployment, Salaries & Wages Paid, Value of Assets Owned, and Number of Establishments as inputvariables.This study alsoapplied ValueofGross OutputandValue-Addedastheoutputvariables.Forallthevariables,the 2009 and 2010 data has been collected and analyzed for 34 food processing industries operating inMalaysia.Duetoalack ofpanel datafor recentyears,thisstudyhas usedthis datasettoinvestigatetheinitialstage ofpoliciesimplemented bytheMalaysiangovernmentduring 2009-2010. Thedatawerecollected fromtheDepartmentofStatistics,Malaysiaand annual reportoffoodindustryinMalaysia.
Table 1: Summaryoftheindicatorsusedasvariables:
Type Indicator Unit
OutputVariables Value ofgross output RM'000
Value added RM'000
InputVariables
Costofinput RM'000
Total employments No.s
Salaries & wages paid RM'000
Value ofassetsowned RM'000
No.ofestablishments No.s
5. RESULTS DISCUSSION
5.1 Malmquist Summary Index Analysis
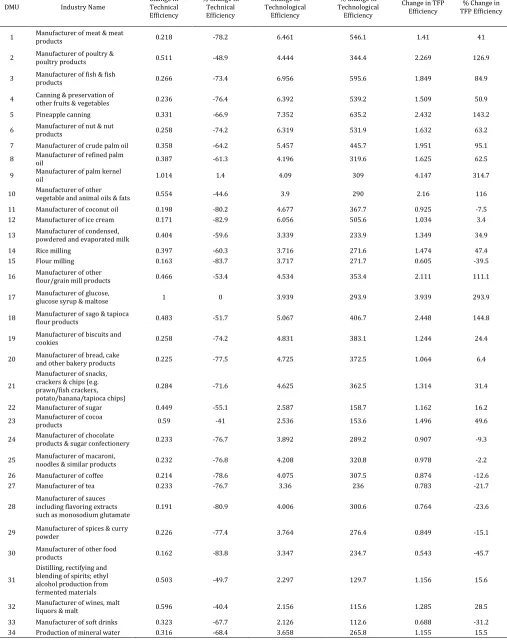
Table 2 showsthedescriptivesummaryoftheresults obtained fromthe MPIindexanalysis.IntheMPIanalysis,anyefficiencyscoresgreaterthan unitymeananincreaseinefficiency,and anyefficiencyscores lessthan unitymeans declines inefficiency. Theresultshows some significant outcomes whichneed tobeevaluated.Almostalltheindustriesshowa negativechangeinthe technical efficiencyexceptforManufacturerof Palm Kernel Oil and ManufacturerofGlucose & GlucoseSyrup,Maltose.On the other hand, all the industries show a positive change in the technological efficiency which outweighs the changes in technical efficiency.As aresult,almostalltheindustries show positivechangesin theefficiencyoftotal factorproductivity.Fiveindustries show anegative changeintheefficiencyoftotal factorproductivity,namelyManufacturer of Coconut Oil, Manufacturer of Flour Milling, Manufacturer of Tea, ManufacturerofSauces including Flavoring Extracts such as Monosodium Glutamate,ManufacturerofOtherFoodProducts.Thecauseofthisdecline is a negativechangeinthetechnicalefficiencyoftheseindustriesthat outweighsthepositivechangeintechnologicalefficiency.Thedatashow thatfrom2009to2010thevalue-added bytheseindustries has increased, butemploymentandaveragesalaryhavealsoincreased.Hence,thereisa declineinefficiency.
Itisevidentfromtheresultsobtained thatthehighestperforming industry is ManufacturerofKernel PalmOilwithascoreof4.147 intheefficiency changeofTFP,whichindicates anapproximate314.7%increaseinthe
industry’s overallefficiency,indicating increasing returns-to-scale inthe industry’s productionfunction.About1.4%ofthischangeis duetogrowth
in technical efficiency and 309%of this change is due to growth in technological efficiency.Hence,theresultsuggeststhatalthough the contributionofcapital and labortoproductionhas increased somewhat; on the other hand, the contribution of technology has increased significantly over the last few years. The second highest performing industry is Manufacturer of Glucose & Glucose Syrup, Maltose. This industryshowsnochangeinthetechnical efficiencybutascoreof3.939 inthechangeinthetechnologicalefficiency,whichmeansabout293.9% increaseintheefficiencyoftotal factorproductivitycaused solely bythe increase in technological efficiency. Since technological efficiency increases arelikely theresultofdevelopments external totheindustry itself,thissuggeststhatthereisstillscopeforimprovementintheorganic compositionofboththesehigh performing industries.
MalaysianJournal ofSustainable Agriculture(MJSA)2(1)(2018) 19-28
efficiencyoftotalfactorproductivity:theincreaseinthetechnological efficiencycouldnotoffsetthedecreaseintechnicalefficiency.Therefore, itmightbesaid thattheseindustries aremoresensitivetotheirorganic compositionratherthantotheirproductiontechnology.This suggests that there is still much scope to further investigate the industry-wide sensitivenesstotheorganiccompositionas wellas technologyusing more
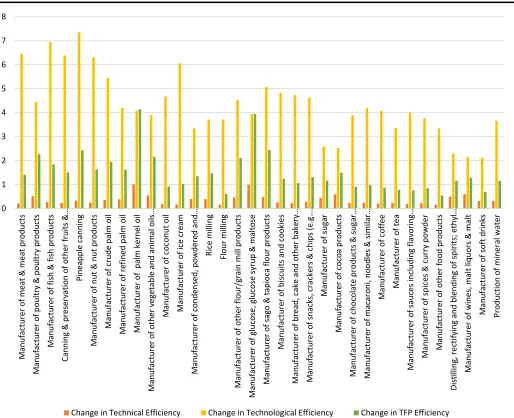
rigorousdata,which willhelp policymakerstotakeappropriate and necessarysteps toboostthefood processing industries inMalaysia.Figure
[image:4.596.46.553.136.776.2]1 showsacomparativevisualizationofallthefactors’efficiencychanges byindicating industries inthehorizontal axis and changeinefficienciesof technical,technological andTFPinvertical axis.
Table 2:Summaryoftheresults obtained fromtheMPIAnalysis
DMU IndustryName ChangeTechnicalin Efficiency
%Changein Technical Efficiency
Changein Technological
Efficiency
%Changein Technological
Efficiency
ChangeinTFP
Efficiency T%FP EChangefficiencyin
1 Manufactureproducts r ofmeat & meat 0.218 -78.2 6.461 546.1 1.41 41
2 Manufacturepoultryproductsr ofpoultry & 0.511 -48.9 4.444 344.4 2.269 126.9
3 Manufactureproducts r offish & fish 0.266 -73.4 6.956 595.6 1.849 84.9
4 Canningother fruit & s & preservationvegetablesof 0.236 -76.4 6.392 539.2 1.509 50.9
5 Pineapplecanning 0.331 -66.9 7.352 635.2 2.432 143.2
6 Manufactureproducts r ofnut & nut 0.258 -74.2 6.319 531.9 1.632 63.2
7 Manufacturer ofcrudepalmoil 0.358 -64.2 5.457 445.7 1.951 95.1
8 Manufactureoil r ofrefinedpalm 0.387 -61.3 4.196 319.6 1.625 62.5
9 Manufactureoil r ofpalmkernel 1.014 1.4 4.09 309 4.147 314.7
10 Manufacturevegetableandr ofanimalother oils & fats 0.554 -44.6 3.9 290 2.16 116
11 Manufacturer ofcoconutoil 0.198 -80.2 4.677 367.7 0.925 -7.5
12 Manufacturer oficecream 0.171 -82.9 6.056 505.6 1.034 3.4
13 Manufacturepowderedandr ofevaporatedcondensedmilk, 0.404 -59.6 3.339 233.9 1.349 34.9
14 Ricemilling 0.397 -60.3 3.716 271.6 1.474 47.4
15 Flour milling 0.163 -83.7 3.717 271.7 0.605 -39.5
16 Manufactureflour/grainmillr ofproductsother 0.466 -53.4 4.534 353.4 2.111 111.1
17 Manufactureglucosesyrupr & ofmaltoseglucose, 1 0 3.939 293.9 3.939 293.9
18 Manufactureflour productsr ofsago & tapioca 0.483 -51.7 5.067 406.7 2.448 144.8
19 Manufacturecookies r ofbiscuits and 0.258 -74.2 4.831 383.1 1.244 24.4
20 andManufactureother bakeryr ofbreadproducts, cake 0.225 -77.5 4.725 372.5 1.064 6.4
21
Manufacturer ofsnacks, crackers & chips (e.g. prawn/fish crackers, potato/banana/tapiocachips)
0.284 -71.6 4.625 362.5 1.314 31.4
22 Manufacturer ofsugar 0.449 -55.1 2.587 158.7 1.162 16.2
23 Manufactureproducts r ofcocoa 0.59 -41 2.536 153.6 1.496 49.6
24 Manufactureproducts & sugar ofr chocolateconfectionery 0.233 -76.7 3.892 289.2 0.907 -9.3
25 noodleManufactures & simr ofilar macaronproductsi, 0.232 -76.8 4.208 320.8 0.978 -2.2
26 Manufacturer ofcoffee 0.214 -78.6 4.075 307.5 0.874 -12.6
27 Manufacturer oftea 0.233 -76.7 3.36 236 0.783 -21.7
28 Manufactureincludingflavoringr ofsauceextracts s
such as monosodiumglutamate 0.191 -80.9 4.006 300.6 0.764 -23.6
29 Manufacturepowder r ofspices & curry 0.226 -77.4 3.764 276.4 0.849 -15.1
30 Manufactureproducts r ofother food 0.162 -83.8 3.347 234.7 0.543 -45.7
31
Distilling, rectifyingand blendingofspirits;ethyl alcoholproductionfrom fermentedmaterials
0.503 -49.7 2.297 129.7 1.156 15.6
32 Manufactureliquors & maltr ofwines, malt 0.596 -40.4 2.156 115.6 1.285 28.5
33 Manufacturer ofsoftdrinks 0.323 -67.7 2.126 112.6 0.688 -31.2
34 Productionofmineralwater 0.316 -68.4 3.658 265.8 1.155 15.5
Figure 1: ComparativevisualizationoftheMPIanalysis(Source:Authorcalculation) 5.2 Order-m Analysis
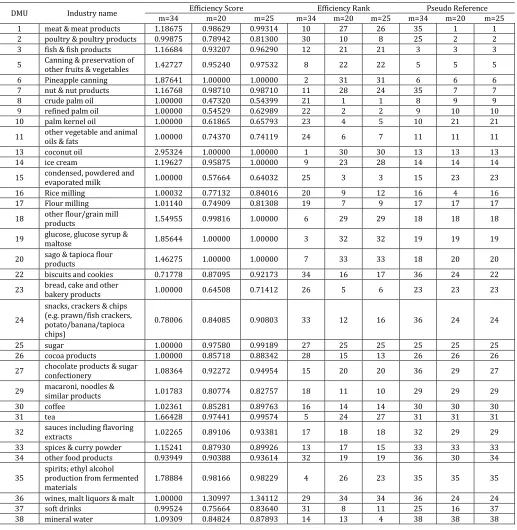
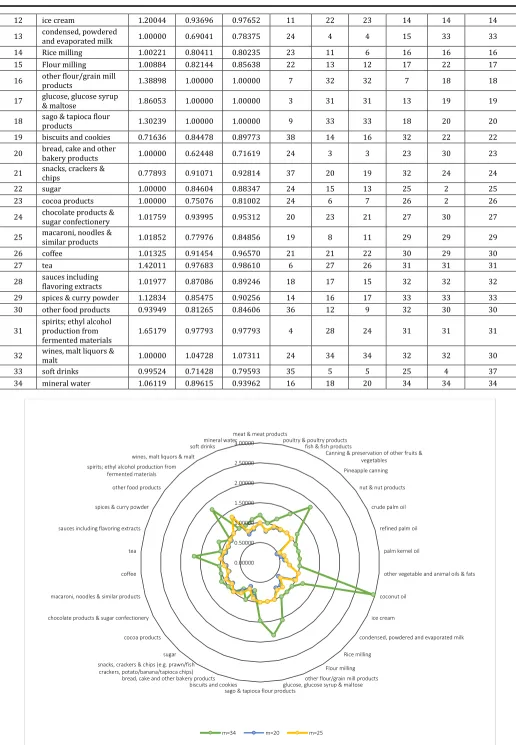
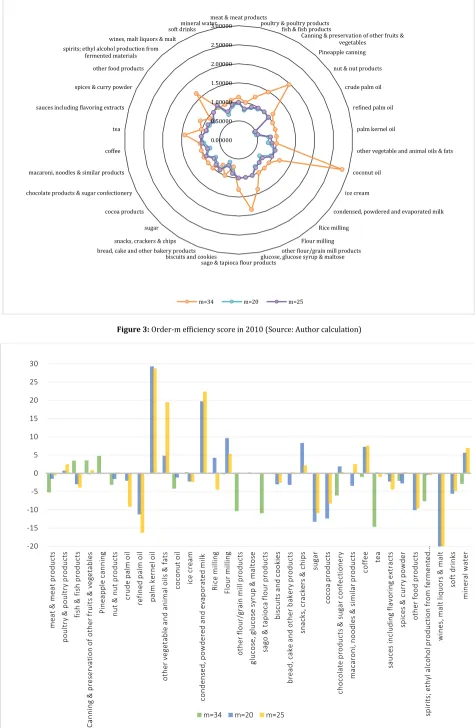
Tables 3 & 4 reporttheresultsobtained fromtheorder-manalysis forthe years 2009 and2010respectively.As statedbefore,thestudyhas takenm = 20andm = 25forpartial frontierand m=34forfullfrontieranalysis. Thecomparativeefficiencyperformanceofeach industryintheyears 2009and 2010 areshowninFigures 2 and 3 respectively.Figure 4 shows thepercentageincreaseordecreaseintheefficiencyscoreforthepartial frontiers and thefullfrontierseparately foreach industry.Bytakinga closerlook atthosefigures,itcanbeseenthatforboth theyears thepartial frontieranalysis form = 20and m = 25show almostsimilarresults,but theyvarytoasignificantextentwith thatoffullfrontierresults.Inthe partialfrontieranalysis,thebestperformingindustryis theManufacturer ofCrudePalmOilforbothm = 20 andm=25inboththeyears.The ManufacturerofPalmKernel Oil showsasignificantriseintheefficiency scoreovertheone-yearperiod,ranking 4thin2010from10thin2009,with analmost29%increaseintheefficiencyscore.Thepoorestperforming industryis theManufacturerofWineLiquorand Malt forboth partial frontiers inboth years,alsohaving thehighestdeclineintheefficiency scorefrom2009to2010.
Thefullfrontierorder-manalysisfortheyears2009and2010showsthat thebestperforming industries forboth theyears aretheManufacturerof CrudePalmOil, ManufacturerofRefined PalmOil, ManufacturerofPalm Kernel Oil, ManufacturerofOtherVegetables and Animal Oils and Fats, Manufacturer of Condensed Powdered and Evaporated Milk, ManufacturerofBread Cakeand OtherBakeryProducts,Manufacturerof Sugar,ManufacturerofCocoaProducts,and ManufacturerofWines Malt Liquors and Malt,allhavinganefficiencyscoreof 1 inboth theyears.The highestscorerintheorder-manalysisisManufacturerofCoconutOil,with anefficiencyscoreof2.953242 intheyear2009and 2.829483 intheyear 2010,whichisanapproximate4.19%decreaseovertheone-yearperiod.
The outcomeindicates thatthis industryis performing welland the mechanismofits productionprocessis working efficiently,although itis exhibiting significantlyhighdiminishing returns-to-scaleinitsproduction. The lowest performing industryis the Manufacturer of Biscuits and Cookies with anefficiency scoreof 0.7177833 in the year2009 and 0.716358 intheyear2010,which isabouta0.20%decreaseoverthe one-yearperiod. TheMPIanalysis alsoshowsthatthis industryhasadecline of74.2%initstechnical efficiency.This meansthereis scopetoimprove itsproductionprocessand itsorganiccomposition,and sinceitexhibits increasing returns-to-scale inits productionprocess,theimprovement canfurthersecureits futuresustainability.Theanalysis suggests thatthis industryshouldfollow the mechanismofManufacturer ofWines Malt Liquors and Maltas pseudoreference(seeNote3inAppendix);inan attempttoeventuallyreachanefficientpointofproduction.
Byanalyzingtheseresults,itcanbeseenthatthehighestincreaseinthe efficiencyscorefrom2009to2010 is heldbyPineappleCanning industry. Itshowsabouta4.78%increaseinits efficiencyscore.This isbecause although theamountofvalue-addedbytheindustryfell,so did theamount ofinputcostincluding salariesand wages paid toemployees.As aresult, overallefficiencyhas increased.Ontheotherhand, thehighestdeclinein theefficiencyscoreis exhibited bythe Manufacturer ofTeawhichis approximatelya14.67%decrease.Datasuggests thatthis is becausethe increaseintheindustry’svalue-added couldnotoffsettheincreaseinthe costofsalaries and wages paid totheemployees.Twelveindustries among the38-showconstantefficiencyscoreovertheone-yearperiod.Figures 2 and 3 show therelativeperformanceofalltheindustries fortheyears 2009and 2010 respectively.Figure 4 shows thecomparativepercentage increaseordecreaseintheefficiencyscorefrom2009to2010foreach industry 0 1 2 3 4 5 6 7 8 Man u fac tu re r o f m
eat & me
at p ro d u cts Man u fac tu re r o f po u ltr
y & p
o u lt ry p ro d u cts Man u fac tu re r o f f is h & fis h p ro d u cts Can n in
g & p
re se rv ati o n o f o th er fr u its &… Pin e ap p le c an n in g Man u fac tu re r o f nu t & n u t p ro d u cts Man u fac tu re r o f c ru d e p alm o il Man u fac tu re r o f re fi n ed p alm o il Man u fac tu re r o
f pal
m ke rn e l o il Man u fac tu re r o f o th er ve ge tab le an d an im al o ils … Man u fac tu re r o f c o co n u t o il Man u fac tu re r o
f ice cre
am Man u fac tu re r o f c o n d en se d , p o w d ere d an d … R ic e mil lin g Fl o u r mi lli n g Man u fac tu re r o f o th er fl o u r/g rai n mil l p ro d u cts Man u fac tu re r o f gl u co se , g lu co se s yru p & ma lto se Man u fac tu re r o f sag o & tap io ca f lo u r p ro d u cts Man u fac tu re r o f bi sc u its an d c o o ki e s Man u fac tu re r o f br ead , c ak e an d o th er b ak ery… M an u fac tu re r o f s n ac ks , cracke rs & ch ip s (e .g .… Man u fac tu re r o f su gar Man u fac tu re r o f c o co a p ro d u cts Man u fac tu re r o f c h o co late p ro d u cts & s u gar… Man u fac tu re r o f m ac ar o n i, n o o d le
s & s
imil ar… M an u fac tu re r o f c o ffe e Man u fac tu re r o f te a Man u fac tu re r o f sau ce s in cl u d in g flavo ri n g… Man u fac tu re r o f sp ic es & c u rry p o w d er Man u fac tu re r o f o th er fo o d p ro d u ct s D is ti lli n g, re cti fyi n g an d b le n d in g o f s p ir its ; e th yl … Man u fac tu re r o f w in e s, m al t l iq u o rs & malt Man u fac tu re r o f so ft d ri n ks Pro d u cti o n o f m in e ral w ate r
MalaysianJournal ofSustainable Agriculture(MJSA)2(1)(2018) 19-28
Table 3: Summaryoftheresults fromOrder-mAnalysis for2009
DMU Industryname m=34 Efficiencym=20Score m=25 m=34Efficiencym=20Rankm=25 m=34Pseudom=20Referencem=25
1 meat&meatproducts 1.18675 0.98629 0.99314 10 27 26 35 1 1
2 poultry&poultryproducts 0.99875 0.78942 0.81300 30 10 8 25 2 2
3 fish&fish products 1.16684 0.93207 0.96290 12 21 21 3 3 3
5 Canninotherfruitg & s & vpreservationegetablesof 1.42727 0.95240 0.97532 8 22 22 5 5 5
6 Pineapplecanning 1.87641 1.00000 1.00000 2 31 31 6 6 6
7 nut & nutproducts 1.16768 0.98710 0.98710 11 28 24 35 7 7
8 crudepalmoil 1.00000 0.47320 0.54399 21 1 1 8 9 9
9 refinedpalmoil 1.00000 0.54529 0.62989 22 2 2 9 10 10
10 palm kerneloil 1.00000 0.61865 0.65793 23 4 5 10 21 21
11 otheroils & favegetablets andanimal 1.00000 0.74370 0.74119 24 6 7 11 11 11
13 coconutoil 2.95324 1.00000 1.00000 1 30 30 13 13 13
14 icecream 1.19627 0.95875 1.00000 9 23 28 14 14 14
15 evaporatecondensed,d powderemilk d and 1.00000 0.57664 0.64032 25 3 3 15 23 23
16 Ricemilling 1.00032 0.77132 0.84016 20 9 12 16 4 16
17 Flourmilling 1.01140 0.74909 0.81308 19 7 9 17 17 17
18 otherproductsflour/grainmill 1.54955 0.99816 1.00000 6 29 29 18 18 18
19 glucose,maltoseglucosesyrup & 1.85644 1.00000 1.00000 3 32 32 19 19 19
20 sagoproducts & tapiocaflour 1.46275 1.00000 1.00000 7 33 33 18 20 20
22 biscuitsand cookies 0.71778 0.87095 0.92173 34 16 17 36 24 22
23 bread,bakerycaproductske and other 1.00000 0.64508 0.71412 26 5 6 23 23 23
24
snacks,crackers & chips (e.g.prawn/fishcrackers, potato/banana/tapioca chips)
0.78006 0.84085 0.90803 33 12 16 36 24 24
25 sugar 1.00000 0.97580 0.99189 27 25 25 25 25 25
26 cocoaproducts 1.00000 0.85718 0.88342 28 15 13 26 26 26
27 chocolateconfectioneryproducts &sugar 1.08364 0.92272 0.94954 15 20 20 36 29 27
29 macaroni,similarproductsnoodles & 1.01783 0.80774 0.82757 18 11 10 29 29 29
30 coffee 1.02361 0.85281 0.89763 16 14 14 30 30 30
31 tea 1.66428 0.97441 0.99574 5 24 27 31 31 31
32 saucesextractsincluding flavoring 1.02265 0.89106 0.93381 17 18 18 32 29 29
33 spices & currypowder 1.15241 0.87930 0.89926 13 17 15 33 33 33
34 otherfood products 0.93949 0.90388 0.93614 32 19 19 36 30 34
35 spirits;productionethyfroml alcoholfermented
materials 1.78884 0.98166 0.98229 4 26 23 35 35 35
36 wines,maltliquors & malt 1.00000 1.30997 1.34112 29 34 34 36 24 24
37 softdrinks 0.99524 0.75664 0.83640 31 8 11 25 16 37
38 mineral water 1.09309 0.84824 0.87893 14 13 4 38 38 38
Table 4: Summaryoftheresults fromOrder-mAnalysis for2010
DMU Industryname EfficiencyScore EfficiencyRank PseudoReference
m=34 m=20 m=25 m=34 m=20 m=25 m=34 m=20 m=25
1 meat&meatproducts 1.12451 0.97153 0.98686 15 26 27 31 1 1
2 poultryproducts&poultry 0.99873 0.79522 0.83284 34 9 8 25 2 2
3 fish&fish products 1.20719 0.90412 0.92492 10 19 18 3 3 3
4 Canninofotherg & fruitpreservations &
vegetables 1.47776 0.95020 0.98343 5 24 25 5 5 5
5 Pineapplecanning 1.96614 1.00000 1.00000 2 30 30 6 6 6
6 nut & nutproducts 1.13087 0.97149 0.98931 13 25 28 31 7 7
7 crudepalmoil 1.00000 0.46353 0.49417 24 1 1 8 33 33
8 refinedpalmoil 1.00000 0.48387 0.52704 24 2 2 9 10 10
9 palm kerneloil 1.00000 0.79991 0.84694 24 10 10 10 15 15
10 otheranimavegetablel oils & fatsand 1.00000 0.77956 0.88556 24 7 14 11 11 11
11 coconutoil 2.82948 0.98814 1.00000 1 29 29 13 13 13
[image:6.596.36.576.606.803.2]12 icecream 1.20044 0.93696 0.97652 11 22 23 14 14 14 13 condensed,and evaporatedpowderemilkd 1.00000 0.69041 0.78375 24 4 4 15 33 33
14 Ricemilling 1.00221 0.80411 0.80235 23 11 6 16 16 16
15 Flourmilling 1.00884 0.82144 0.85638 22 13 12 17 22 17
16 otherproductsflour/grainmill 1.38898 1.00000 1.00000 7 32 32 7 18 18
17 glucose,& maltoseglucosesyrup 1.86053 1.00000 1.00000 3 31 31 13 19 19
18 sagoproducts & tapiocaflour 1.30239 1.00000 1.00000 9 33 33 18 20 20
19 biscuitsand cookies 0.71636 0.84478 0.89773 38 14 16 32 22 22
20 bread,bakerycaproductske and other 1.00000 0.62448 0.71619 24 3 3 23 30 23
21 snacks,chips crackers & 0.77893 0.91071 0.92814 37 20 19 32 24 24
22 sugar 1.00000 0.84604 0.88347 24 15 13 25 2 25
23 cocoaproducts 1.00000 0.75076 0.81002 24 6 7 26 2 26
24 chocolatesugarconfectioneryproducts & 1.01759 0.93995 0.95312 20 23 21 27 30 27
25 macaroni,similarproductsnoodles & 1.01852 0.77976 0.84856 19 8 11 29 29 29
26 coffee 1.01325 0.91454 0.96570 21 21 22 30 29 30
27 tea 1.42011 0.97683 0.98610 6 27 26 31 31 31
28 saucesflavorinincluding extractsg 1.01977 0.87086 0.89246 18 17 15 32 32 32
29 spices & currypowder 1.12834 0.85475 0.90256 14 16 17 33 33 33
30 otherfood products 0.93949 0.81265 0.84606 36 12 9 32 30 30
31 spirits;productionethyfroml alcohol
fermentedmaterials 1.65179 0.97793 0.97793 4 28 24 31 31 31
32 wines,malt maltliquors & 1.00000 1.04728 1.07311 24 34 34 32 32 30
33 softdrinks 0.99524 0.71428 0.79593 35 5 5 25 4 37
[image:7.596.38.554.25.770.2]34 mineral water 1.06119 0.89615 0.93962 16 18 20 34 34 34
Figure 2: Order-mefficiencyscorein2009(Source:Authorcalculation)
0.00000 0.50000 1.00000 1.50000 2.00000 2.50000 3.00000 meat & meat products
poultry & poultry products fish & fish products
Canning & preservation of other fruits & vegetables
Pineapple canning
nut & nut products
crude palm oil
refined palm oil
palm kernel oil
other vegetable and animal oils & fats
coconut oil
ice cream
condensed, powdered and evaporated milk
Rice milling
Flour milling
other flour/grain mill products glucose, glucose syrup & maltose sago & tapioca flour products
biscuits and cookies bread, cake and other bakery products snacks, crackers & chips (e.g. prawn/fish
crackers, potato/banana/tapioca chips) sugar cocoa products chocolate products & sugar confectionery
macaroni, noodles & similar products coffee
tea sauces including flavoring extracts
spices & curry powder other food products spirits; ethyl alcohol production from
fermented materials
wines, malt liquors & malt
soft drinksmineral water
MalaysianJournal ofSustainable Agriculture(MJSA)2(1)(2018) 19-28
[image:8.596.64.536.56.413.2]Figure 3:Order-mefficiencyscorein2010(Source:Authorcalculation)
Figure 4:Percentageincreaseordecreaseinefficiencyscorefrom2009 to2010(Source:Authorcalculation)
0.00000 0.50000 1.00000 1.50000 2.00000 2.50000 3.00000
meat & meat products
poultry & poultry products fish & fish products
Canning & preservation of other fruits & vegetables
Pineapple canning
nut & nut products
crude palm oil
refined palm oil
palm kernel oil
other vegetable and animal oils & fats
coconut oil
ice cream
condensed, powdered and evaporated milk
Rice milling Flour milling other flour/grain mill products glucose, glucose syrup & maltose sago & tapioca flour products
biscuits and cookies bread, cake and other bakery products
snacks, crackers & chips sugar cocoa products chocolate products & sugar confectionery
macaroni, noodles & similar products coffee
tea sauces including flavoring extracts
spices & curry powder other food products spirits; ethyl alcohol production from
fermented materials
wines, malt liquors & malt
soft dmineralrinks water
m=34 m=20 m=25
-20 -15 -10 -5 0 5 10 15 20 25 30 m e a t & m e a t p ro d u ct s p o u lt ry & p o u lt ry p ro d u ct s fi sh & f is h p ro d u ct s C a n n in g & p re se rv a ti o n o f o th e r fr u it s & v e ge ta b le s P in e a p p le c a n n in g n u t & n u t p ro d u ct s cr u d e p a lm o il re fi n e d p a lm o il p a lm k e rn e l o il o th e r ve ge ta b le a n d a n im al o il s & f a ts co co n u t o il ic e c re a m co n d e n se d , p o w d e re d a n d e va p o ra te d m il k R ic e m il li n g Fl o u r m il li n g o th e r fl o u r/ gr ai n m il l p ro d u ct s gl u co se , g lu co se s yr u p & m a lt o se sa go & t a p io ca f lo u r p ro d u ct s b is cu it s a n d c o o ki e s b re a d , c a ke a n d o th e r b a ke ry p ro d u ct s sn a ck s, c ra ck e rs & c h ip s su ga r co co a p ro d u ct s ch o co la te p ro d u ct s & s u ga r co n fe ct io n e ry m a ca ro n i, n o o d le s & s im il ar p ro d u ct s co ff e e tea sa u ce s in cl u d in g fl a vo ri n g e xt ra ct s sp ic e s & c u rr y p o w d e r o th e r fo o d p ro d u ct s sp ir it s; e th yl a lc o h o l p ro d u ct io n f ro m f e rm e n te d … w in e s, m a lt li q u o rs & m a lt so ft d ri n ks m in e ra l w a te r
m=34 m=20 m=25
6. CONCLUSION AND POLICY SUGGESTIONS
Thekeycontributions ofthis studytotheexisting literatureareasfollows: 1. There is an introduction to MPI analysis to the existing literature for analyzing total factor productivity and technological changeefficiencyofthefood processing industry. Findings: MPIanalysis enabled us toexaminetheperformance of technological and technicalefficiency separately and the contributionoforganiccompositionaswellasthecontribution oftechnology tothetotal factorproductivityofthesectors more comprehensively;
2. Asearch oftheliteratureindicatesthisisthefirsttimeinthe analysisofthefood processing industrythatastudyhas used both partial frontier(m=20andm = 25) aswellas fullfrontier (m = 34) order-m analysis. The m stands for number of industries inthisresearch.
Findings:This has enabled ustoexaminewhich food processing industryhas performed mostefficiently,providing insights for otherfood processors.This approachhas alsohelped usto review thevariationintheefficiencyscoreoftheindustries overtheone-yearperiod underconsideration.Moreover,the study also found the order m method to be efficient and consistenceunlikeothernon-parametricmethods such as DEA, FDH etc.
3. The study also presented technical intensiveness and technological intensiveness as factors determining comparative andabsoluteadvantageforeachindustryinadditiontothe factors,such aslowercostofinputsand highervalueofoutput, which wereusedinpreviousstudies.
Findings: Theresults stronglyindicatethatforthemajorityof industries,betterperformanceis theresultofanimprovement in technological efficiency rather than organic composition. Almostallindustries show negativityintheimprovementof organiccompositionintheirproductionprocesses,with the exceptionofManufacturerofPalmKernel Oilforwhich organic composition was a significant contributor in the overall increaseintotal factorproductivityefficiency.
This is an important finding, because since technological efficiency increasesarelikelytheresultofdevelopmentsexternaltotheindustryand the firms that comprise it, it suggests that there is still scope for improvement in the internal management practices and resource allocationdecisionofthesehighperforming industries.Inotherwords,the best-practiceproductionfrontieris moving upwardtherebyincreasing totalfactorproductivity,buttheextenttowhichfirmsaremovingtowards thefrontierbyimproving internalpractices is less positive.Indeed,it couldbespeculated thatthetrend ofcontinuallyincreasing technological efficiencyinthefood processing industryreduces theincentives forfirms tostrivefortechnicalefficiencywithintheirorganizations.
While this islargely amatter forthe firms themselves, it haspolicy implications simplyintherecognitionthatfirms arenotmoving towards theirproductionfrontiers.Morework wouldneed tobedonetoascertain whybutif,forexample,this is becauseofbarriers totheimprovementin organiccomposition,policies could beconsidered toaddressthis.This methodologywouldbeequallyvaluable inotherindustries, giventhe availabilityofappropriatedata.Themainlimitationofthis studyis thelack ofavailabilityofthedata.Thedataused hereis only fortwoyears,2009 and 2010,thereforetheresultsshow someinconsistencyintheoutcome. Thedataset used inthis study has been collected inassociationwith UniversityMalaysiaSabah(UMS),UniversityPutraMalaysia(UPM)and Malaysiangovernment.Datafortheyear2012 was available,butunusable forthis study becauseitlackedthebalanced panel featureforanalysis. Also,adeeperunderstandingofhow intensiveanindustryis toorganic compositionortechnologywasn’tpossibleduetolack ofappropriatedata. Additionally,thisstudyhas usedonly anon-parametricapproach tothe analysis.Hence,thesuggestiontofutureresearchers wouldbetousemore years of data in their analysis,as wellas to useadditionaldata for analyzingtheintensivenesstoorganiccompositionortechnologyofeach industry.Itwouldalsobepossible touseparametricapproaches such as simple OLS or GLS regression analysis besides the non-parametric approachesused inthis study.
APPENDIX
Note 1: Organic Composition
Theorganic compositionofafirmorindustryistheratioofconstant capitaltovariable capital which is required toproduceoneunitofoutput ofthatfirmorindustry.Thiscanbereferred toasanindicatoroftechnical efficiencyofafirmexplaining howthefactorsofproductionwork together to produce a desired amount of output. A higher value of organic compositionmeansthattheproductionprocessis capital-intensive,and thelowervaluemeansthattheproductionprocess islabor-intensive.Any increaseinorganiccompositionwillindicateimprovementinthetechnical efficiencyofthefirm/industry.
Note 2: Non-Parametric Statistics
Nonparametricstatistics refer to astatistical methodused to analyze ordinal ornominal datawithsmallsamplesizes,whereinthedatadoes not requireanyassumptionsregarding thedistributionof thepopulation. Non-parametricmethods arealsoreferred asdistributionfreemethod. Thecontemporarynonparametricmethods aredataenvelopmentanalysis (DEA),freedisposal hull(FDH),order-αandorder-mfrontieranalysis,etc.
Note 3: Pseudo Reference
Theorder-manalysissuggests somereferenceDMUswhichshouldbe followed bytherespondentDMUinordertoachievehigher degreeof efficiency.This referenceDMUiscalled pseudoreference.
Note 4: Malmquist Productivity Index (MPI)
MPImeasures thechangeinefficiencyofaDMUbetweendifferenttime periods.TheMalmquistproductivityindexdoes notsatisfythetransitivity propertyand alsodoesnotadequately accountforscalechange.Theinput and outputorientedindices coincide ifthetechnologyexhibitsconstant return toscale. MPI can be decomposed into efficiency change and technical change.
Note 5: Data Envelopment Analysis (DEA)
Itisanonparametricmathematical programmingapproach tofrontier estimation.DEAmethodispopularlyused tocalculateMPIofTFP change. REFERENCES
[1] Alam,S.,Jani,M.,Senik,Z.,Domil, A.2011.Assessing barriers ofgrowth of food processing SMIs in Malaysia: Afactor analysis. International BusinessResearch, 4 (1),251-259.
[2] Ramzani, S.R., Ismail, M.M., Abdurofi, I. 2015. Measuring Competitiveness of Food Processing Industry in Malaysia. Australian Journal ofBusinessand EconomicStudies.
[3] Yodfiatfinda,Mad,N.,Zainalabidin, M.,MdAriff,H.,Zulkornain,Y., Alias, R. 2012. The empirical evaluation of productivity growth and efficiencyofLSEs intheMalaysianfoodprocessing industry.International FoodResearchJournal, 19,287-295.
[4] Malaysia’s FoodIndustry.2011.MalaysianIndustrialDevelopment Authority(MIDA),2012MinistryofAgricultureand Agro-based Industry. National Agro-foodPolicy(2011-2020).MinistryofAgricultureand A gro-food Industry.Kuala Lumpur.
[5] Rahman,A.2016.Exports ofprocessed foodtogrowfurtherin2016: Matrade. Ministry of International Trade and Industry (MITI), Kuala
Lampur, Malaysia. Retrieved from
MalaysianJournal ofSustainable Agriculture(MJSA)2(1)(2018) 19-28
[6] Fatimah,M.,Ahmad,S.,Alias,R.,Amin,M.,Azali,M.2008.Assessment onactionplanoffoodsectortradebalance.MinistryofAgricultureand Agro-basedIndustry,Malaysia.
[7] Ismail, M.M.,Yusop,Z.2014.CompetitivenessoftheMalaysianFood ProcessingIndustry.Journal ofFood ProductsMarketing,20(1),164-178. [8] Afzal, M.N.I.2013.Are ScienceValleysandClustersPanaceafora KnowledgeEconomy?AnInvestigationonRegionalInnovationSystem (RIS)-Concepts,TheoryandEmpirical analysis.AsianResearchPolicy 4, 114-125.
[9] Afzal, M.N.,Manni,U.H.2013.AnEmpirical ProductivityAnalysisof ASEAN EconomiesinTransitionTowards Knowledge-Based Economy. AsianResearchPolicy, 4 (1),1-9.
[10] Salim,R.A.,Kalirajan,K.1996.Measures ofcapacityrealizationand productivitygrowth forBangladeshfood processing industries.Australian National University.
[11] Nishimizu,M.,Page,J.M.Jr.1982.TotalFactorProductivityGrowth, TechnologicalProgressand Technical EfficiencyChange:Dimensions of ProductivityChangeinYugoslavia.TheEconomicJournal 92(368), 920-936.
[12] Fare, R., Grosskopf, S., Lovell, C. 1994. Production Frontier. Cambridge:CambridgeUniversityPress.
[13] Afzal, M.N.I.,Lawrey,R.2012.Knowledge-BasedEconomy(KBE) FrameworksandEmpiricalInvestigationofKBEInput-OutputIndicators forASEAN.InternationalJournal ofEconomicsand Finance, 4 (9),13-22. [14] Latruffe,L.2010.Competitiveness,Productivityand Efficiencyin the Agricultural and Agri-Food Sectors. OECD Food, Agriculture and FisheriesPapers,30.doi:http://dx.doi.org/10.1787/5km91nkdt6d6-en [15] European Commission.2009. European Competitiveness Report 2008.Brussels:EuropeanCommission.
[16] Lambert,D.K.1999.Scale and theMalmquistproductivityindex. Applied Economics Letters, 6 (9),593-596.
[17] Coelli,T.1996.AGuide toDEAP 2.1:Adataenvelopment.Armidale. UniversityofNew England.
[18] Cazals, C., Florens, J., Simar, L. 2002. Nonparametric Frontier Estimation:ARobustApproach.Journal ofEconometrics,106 (1),1-25.
[19] Simar,L.,Wilson,P.2006. Statistical inferenceinnonparametric frontiermodels:Recentdevelopments and perspectives.InC.L.H.Fried, TheMeasurementofProductiveEfficiency,Chapter4.Oxford University Press.
[20] Čechura,L., Hockmann,H., Kroupová,Z.2014. Productivity and Efficiency of European Food Processing Industry. International comparisonofproductsupplychains intheagri-food sector:determinants of their competitiveness and performance on EU and international markets,7,1-9.