University of Southern Queensland
Faculty of Health Engineering and Science
A Dissertation submitted by
Daniel de Freitas Pessoa
0050097308
STATCOM DC Bus Voltage Control
and Switching Strategy Analysis
Towards the degree of
Bachelor of Engineering
(Electrical and Electronics)
ABSTRACT
Static Synchronous Compensators (STATCOMs) are employed within
electrical networks to dynamically provide Reactive Power support to the
when necessary. In 2012, Ergon Energy (the regional electricity supply
utility in Queensland, Australia) commissioned its first STATCOM into the
sub-transmission, at St. George Substation, and within its first year of
operation experienced a number of trip operations on this device.
Due to the limited knowledge of the operational characteristics of this
device Ergon Energy’s Engineering team decided to investigate further and
attempt to model the D-VAR® STATCOM.
This dissertation is the result of this work. While the initial intent was to
fully develop a three phase model of the STATCOM, time and complexity
constraints limited the outcome of the initial aim, but the following text
presents a comprehensive depiction of the findings of the simulation results
and establishes a solid base to any further work towards this initial aim.
By deriving a number of equations from first principles and applying these
to develop a mathematical model which was implemented in MATLAB®,
this project uncovers a number of interesting arguments which explain some
of the operational characteristics of the D-VAR® STATCOM.
Considering the limitation of information from the manufacturer, this
project deals with an open-loop controlled STATCOM in an attempt to
investigate the DC bus levels of the STATCOM. A number of analysis was
carried out, including:
- The Pulse Width Modulation (PWM) switching strategy to verify
and explain its role in the DC bus operation,
- The effects of changes in the 𝛿 angle and voltage magnitude between
- A network transient scenario was also investigated explaining one
possible outcome of the DC bus reaction to under a network fault
condition.
The theoretical approach considered throughout this work enabled a
thorough validation of the model used for this project allowing interesting
findings to be reached and conclusions to be drawn, including:
- The PWM switching strategy employed within this single phase
STATCOM model does not intervene with the DC bus charging /
discharging, as this is achieved by the changes in 𝛿 angle between
the Grid and the STATCOM, when a number of initial conditions are
met (e.g. the DC bus capacitors contain an initial charge which has
been calculated to function as the starting charge for the simulation)
- Given an assumed severity of the network transient applied to the
simulation, it was observed that upon return to steady-state the
STATCOM’s DC bus was able to recover from sudden voltage shift
caused by the fault, although only a limited number of conditions
were analysed and these kept a symmetrical change in the DC bus
capacitors.
Leading from this project the development of a three phase model would be
valuable in assisting to answer further questions on the overall operational
LIMITATIONS OF USE
The Council of the University of Southern Queensland, its Faculty of
Health, Engineering & Sciences, and the staff of the University of Southern
Queensland, do not accept any responsibility for the truth, accuracy or
completeness of material contained within or associated with this
dissertation.
Persons using all or any part of this material do so at their own risk, and not
at the risk of the Council of the University of Southern Queensland, its
Faculty of Health, Engineering & Sciences or the staff of the University of
Southern Queensland.
This dissertation reports an educational exercise and has no purpose or
validity beyond this exercise. The sole purpose of the course pair entitled
“Research Project” is to contribute to the overall education within the student’s chosen degree program. This document, the associated hardware,
software, drawings, and other material set out in the associated appendices
should not be used for any other purpose: if they are so used, it is entirely at
CERTIFICATION OF DISSERTATION
I certify that the ideas, designs and experimental work, results, analyses and
conclusions set out in this dissertation are entirely my own effort, except where otherwise indicated and acknowledged.
I further certify that the work is original and has not been previously
submitted for assessment in any other course or institution, except where
specifically stated.
Daniel de Freitas Pessoa
0050097308
__________________________
Signature
__________________________
ACKNOWLEDGEMENTS
I would like to first and foremost thank my wife Catherine for all the
support, understanding and patience throughout all these years in my pursuit
of higher education.
Thank you to my daughter Holly and my son Ryan for the patience and
understanding the reasons why I could not play and spend more time with
you in the last 7 years of our lives. I can only hope that through my pursuit
of a higher education, I have at least inspired you both to never give up your
dreams and ALWAYS seek happiness, no matter what.
I am also extremely thankful for all the support, help and love from my
mother and sister who taught me the best values and have always been role
models of perseverance, insistence and drive in my life, this dissertation
would not have been possible without you. Te amo (I love you).
I would like to thank Dr Andrew Hewitt for being a great friend and mentor,
for the patience during this mentoring period and for providing me with the
opportunity to learn so much in these last few years.
A huge thank you Dr Tony Ahfock, who has taught me so much in the area
of Power Systems through a number of university subjects but also
extra-curricular courses in Power System Protection.
This project would not have been possible without any of you.
Also thank you to American Super Conductor, especially to Matt Pugh for
the provision of some insight on some operational features of the D-VAR®
STATCOM (via correspondence with Dr Andrew Hewitt) without
over-stepping your company’s Intellectual Property’s boundaries, I am very
grateful for your assistance during this project.
Last but not least, thank you to Professor Siqueira from ATEG Brasil, who
always believed in me and mentored me from a young age, showing me the
TABLE OF CONTENTS
ABSTRACT ... iii
LIMITATIONS OF USE ... v
CERTIFICATION OF DISSERTATION ... vi
ACKNOWLEDGEMENTS ... vii
TABLE OF CONTENTS ... viii
TABLE OF FIGURES ... xi
1 INTRODUCTION ... 1
1.1 PROJECT MOTIVATION ... 1
1.2 AIMS AND OBJECTIVES ... 2
1.3 BACKGROUND ... 3
1.4 AMERICAN SUPER CONDUCTOR AND ERGON ENERGY ... 3
1.5 ST. GEORGE SYSTEM CONFIGURATION ... 5
1.6 PROJECT LIMITATIONS ... 10
1.7 OVERVIEW OF DISSERTATION ... 11
2 LITERATURE REVIEW ... 13
2.1 REACTIVE POWER ... 14
2.2 DISCRETE REACTIVE POWER DEVICES ... 15
2.2.1 CAPACITIVE DEVICES ... 15
2.2.2 INDUCTIVE DEVICES ... 15
2.3 DYNAMIC REACTIVE POWER DEVICES ... 16
2.3.1 STATIC VAr COMPENSATOR (SVC) ... 16
2.3.2 STATIC SYNCHRONOUS COMPENSATOR (STATCOM)
2.3.4 PWM SWITCHING ... 19
2.3.5 D-VAR® SWITCHING METHOD ... 19
2.4 STATCOM OPERATION ... 20
3 METHODOLOGY ... 23
3.1 STATCOM MODEL – MATLAB® ... 23
4 THEORETICAL ANALYSIS ... 25
4.1 POWER FLOW ... 25
4.2 STATCOM THEORETICAL POWER FLOW ANALYSIS ... 29
4.3 SINGLE PHASE STATCOM SWITCHING ... 55
4.4 STATCOM CURRENT ... 60
5 MATHEMATICAL MODEL ... 68
5.1 STATCOM MODEL ... 68
5.1.1 HIGH VOLTAGE NETWORK SECTION ... 68
5.1.2 STATCOM SECTION ... 69
5.2 STATCOM INDUCTOR CURRENT AND POWER FLOW SIMULATION ... 74
6 SIMULATION RESULTS / DISCUSSION ... 83
6.1 MODEL VALIDATION ... 83
6.2 ACTIVE POWER FLOW vs. PHASE SHIFT ... 90
6.2.1 STEADY-STATE OPERATION ... 92
6.3 CURRENT STEERING REACTOR ... 95
6.4 NETWORK TRANSIENTS AND EFFECTS ... 106
6.5 INSTANTANEOUS POWER ... 118
6.6 DC BUS BEHAVIOUR ... 123
6.7 NETWORK TRANSIENTS ... 135
7.1 DC BUS ANALYSIS ... 144
7.2 EFFECTS OF NETWORK TRANSIENTS ON DC BUS ... 145
8 SAFETY ... 146
8.1 RISK RATING ... 147
9 RESOURCES ... 148
10 TIMELINE ... 149
11 REFERENCES ... 151
12 APPENDIX ... 153
12.1 APPENDIX A – PROJECT SPECIFICATION ... 153
TABLE OF FIGURES
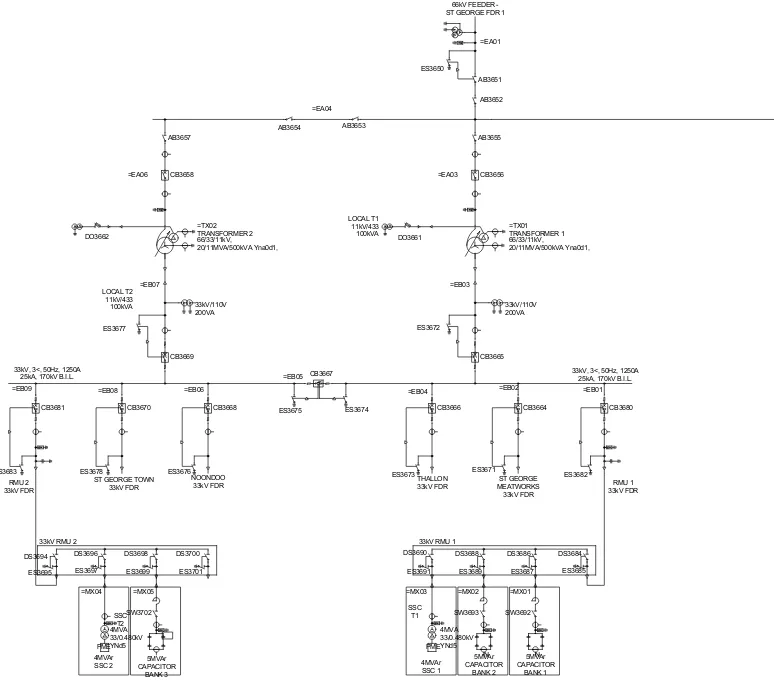
Figure 1-1 – St. George Substation final System configuration (Ergon
Energy) ... 8
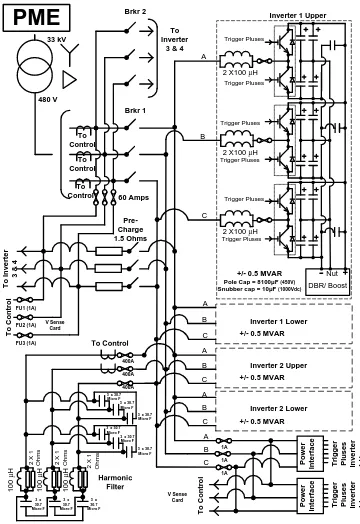
Figure 1-2 – D-VAR® - PME and general arrangement (Ergon Energy Pty)9 Figure 3-1 - SimPowerSystems ®MATLAB – Single Phase STATCOM Model ... 24
Figure 4-1 - STATCOM connected to the power network (equivalent circuit) ... 25
Figure 4-2 - STATCOM connected to the power network (equivalent circuit) ... 29
Figure 4-3 - Active and Reactive Power over 𝛿 angle ... 39
Figure 4-4 - Active Power and modulation ratio over 𝛿 angle ... 39
Figure 4-5 - Equivalent STATCOM / Grid connection ... 40
Figure 4-6 - 60° ≤ 𝛿 ≤ −60° - Analysis ... 45
Figure 4-7 - Changes in 𝜙 and its effects in P ... 47
Figure 4-8 - STATCOM capability curve ... 48
Figure 4-9 - The classical Power Triangle ... 51
Figure 4-10 - Simplified single phase STATCOM ... 56
Figure 4-11 - STATCOM current firing over one cycle (over 1 cycle / 20 ms) ... 58
Figure 4-12 - Simplified STATCOM device connected to grid... 60
Figure 4-13 - PWM waveform ... 61
Figure 5-1 - Single phase STATCOM model ... 68
Figure 5-2 - MATLAB model Blocking unit and its internal configuration 71 Figure 5-3 - Blocking unit output waveform for the initial 60 ms of simulation ... 71
Figure 5-4 - STATCOM model firing unit ... 72
Figure 5-5 - STATCOM model firing block internal functionality ... 72
Figure 5-6 - Firing unit output waveform over one fundamental frequency cycle (20 ms) ... 73
Figure 5-8 - Vtriangle block output waveform (over 20 ms) ... 74
Figure 5-9 - Vtriangle block output waveform (over 2 ms) ... 74
Figure 5-10 - Overshoot error ... 76
Figure 5-11 - STATCOM switched output ... 77
Figure 5-12 - Average grid voltages over a switching period ... 78
Figure 5-13 - Calculated inductor current ... 81
Figure 5-14 - Instantaneous Power Flow ... 82
Figure 6-1 - Single phase STATCOM model ... 87
Figure 6-2 - Active and Reactive Power and Power Factor angle (grid perspective) ... 88
Figure 6-3 - Active and Reactive Power and Power Factor angle (STATCOM perspective) ... 89
Figure 6-4 - Normalised inductor current and voltage (0° to -47.468°) ... 94
Figure 6-5 - Normalised inductor current and voltage (0° to -48°) ... 95
Figure 6-6 - Inductor voltage with grid voltage overlay ... 97
Figure 6-7 - Inductor voltage with grid voltage overlay (zoomed view) ... 98
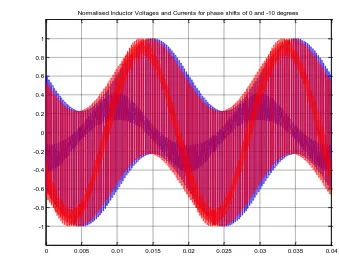
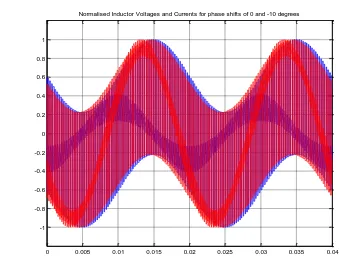
Figure 6-8 - Normalised inductor voltage and current for phase shift (0° to -10°) ... 98
Figure 6-9 - Normalised inductor voltage and current for phase shifts of 0° and -10° – (zoomed view) ... 100
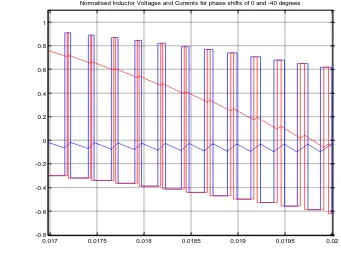
Figure 6-10 - Normalised inductor voltage and current for phase shifts of 0° and -40° – (zoomed view) ... 100
Figure 6-11 - Normalised inductor voltage and current for phase shifts of 0° and -40° – (zoomed view) ... 101
Figure 6-12 - Normalised inductor voltage and current for phase shifts of 0° and -40° – (zoomed view) ... 102
Figure 6-13 - Normalised inductor voltages, currents and modulating signals for phase shift of 0° and -40° ... 104
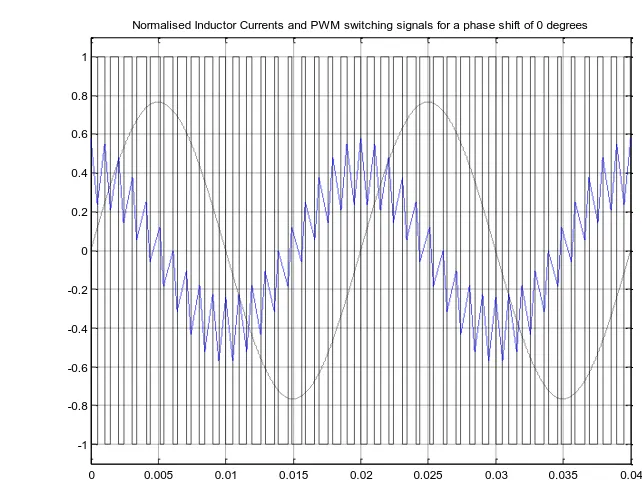
Figure 6-14 - Normalised inductor current and PWM switching signals (no phase shift) ... 105
(-Figure 6-16 - Normalised inductor voltages and currents for phase shift of 0°
and -10° ... 107
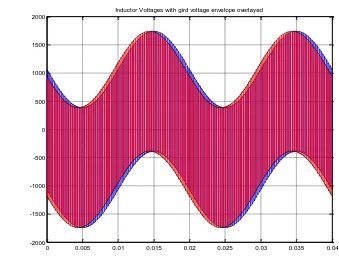
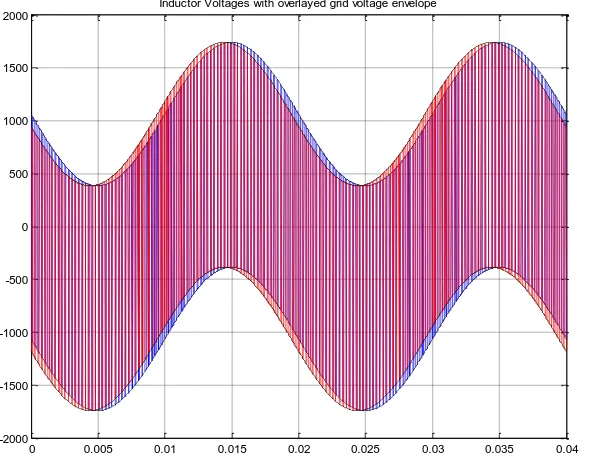
Figure 6-17 - Inductor voltage with grid voltage envelope ... 108
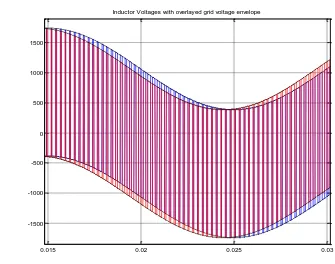
Figure 6-18 - Inductor voltage with grid voltage envelope (zoomed view) ... 109
Figure 6-19 - Inductor voltage with grid voltage envelope ... 109
Figure 6-20 - Inductor voltage with grid voltage envelope (zoomed view) ... 110
Figure 6-21 - Normalised inductor voltage and current for phase shift of 0° to -10° ... 111
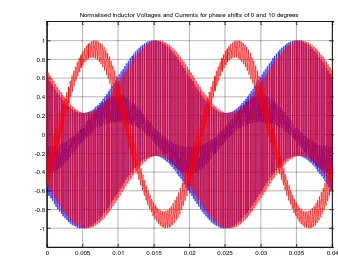
Figure 6-22 - Normalised inductor voltages and currents for phase shifts of 0° and 10° ... 112
Figure 6-23 - Inductor current for phase shifts of 0° and -10° ... 113
Figure 6-24 - Inductor voltages for phase shifts of 0° and -10° ... 113
Figure 6-25 - Normalised inductor voltages and current for phase shifts of 0° and -10° ... 114
Figure 6-26 - Normalised inductor voltages and current for phase shifts of 0° and -10° ... 116
Figure 6-27 - Normalised inductor voltages and current for phase shifts of 0° and -10° ... 117
Figure 6-28 - Normalised inductor voltages and current for phase shifts of 0° and 10° ... 117
Figure 6-29 - Instantaneous power flow (no phase shift)... 120
Figure 6-30 - Instantaneous power flow (no phase shift)... 121
Figure 6-31 - Instantaneous power flow (no phase shift)... 121
Figure 6-32 - Instantaneous power flow (-10° phase shift) ... 122
Figure 6-33 - Capacitor charge for 0° phase shift ... 125
Figure 6-34 - Capacitor voltage for a phase shift of 0° ... 125
Figure 6-35 - DC bus voltage ... 126
Figure 6-36 - Capacitor voltage for a phase shift of 0° ... 128
Figure 6-38 - DC bus voltage (zoomed in view) ... 130
Figure 6-39 - Capacitor change for a phase shift of -1° ... 131
Figure 6-40 - Capacitor voltage for phase shift of -1° ... 131
Figure 6-41 - DC bus voltage for a phase shift of -1° ... 132
Figure 6-42 - Capacitor charge for phase shifts of 0° and -10° ... 134
Figure 6-43 - Capacitor charge for phase shifts of 0° and -10° ... 134
Figure 6-44 - Simulation results for fault condition (network perspective) ... 138
Figure 6-45 - Simulation results for fault condition (STATCOM perspective) ... 139
Figure 6-46 - Open-loop DC bus reaction to the fault ... 140
Figure 6-47 - IGBT plus diode currents and Inductor current ... 141
Figure 12-1 - STATCOM connected to the power network (equivalent circuit) ... 154
Figure 12-2 - STATCOM simplified to a RLC series circuit ... 158
Figure 12-3 - RLC circuit switched at 0°source angle ... 164
1 INTRODUCTION
Due to improvements in performance and cost of high power
power-electronic devices Static Synchronous Compensators (STATCOMs) have
become the preferred solution for providing electricity networks dynamic
reactive power support. Also due to its improved response times and
reduced harmonic generation STATCOM technology has become a most
desired option over the much older Static VAr Compensator (SVC)
technology.
While there has been much research on STATCOM operational
characteristics, detailed operational information is often highly protected by
manufacturers to protect hard earned intellectual property. Ergon Energy as
an owner operator of a sub-transmission connected STATCOM device has
first-hand experience of this.
1.1 PROJECT MOTIVATION
In 2012 Ergon Energy commissioned its first major STATCOM system.
This system was manufactured by the American Super Conductor group
who branded their system by the name D-VAR®. Since its installation Ergon
Energy has experienced a number of faults due to fluctuations in the DC bus
voltage. This experience has highlighted the fact that the way in which the
DC bus in the D-VAR® STATCOM is built based on the power electronics
switching strategy is not well understood by Ergon Energy. In addition,
what is not well understood is how system transients affect the DC bus
voltage.
This project will provide an analysis of the IGBT switching strategy
techniques used by American Super Conductor in the D-VAR® STATCOM
to provide a better understanding of the D-VAR® operation and to propose
1.2 AIMS AND OBJECTIVES
The aim of this project is to develop a mathematical model which describes
the open-loop DC bus operational capabilities of a single phase STATCOM
and can assist in fault-finding the D-VAR® STATCOM at Ergon Energy’s
St. George Substation.
Based on some limited information provided by American Super Conductor
(AMSC), the manufacturer of the D-VAR® STATCOM, the following
specific aims are proposed for this project:
- The development of a mathematical model of a single phase
STATCOM with open-loop control
- Implement and verify the mathematical model by using modelling
software (MATLAB®) and compare it to theoretical results from
derived equations within project
- Assess how the Pulse Width Modulation (PWM) switching strategy
of the modelled STATCOM affects the DC bus voltage level
- Evaluate any effects of Network transients in the modelled
open-loop controlled STATCOM
This is aimed to be achieved by analysing the Pulse Width Modulation
(PWM) switching strategy utilised by AMSC to operate the converter
electronic switches, insulated-gate bipolar transistor (IGBT), contained
within the unit and assess its role (if any) in maintaining/controlling the DC
bus voltage.
As the main objective, we have to explain possible reasons for the premature
failures of the D-VAR® STATCOM’s Dynamic Breaking Board (DBR) on
an equivalent single scenario disregarding any control system response
While the initial main goal of this project was to develop a three phase
model of the D-VAR® STATCOM to assist in answering the above
questions, it became clear during the evolution of the project that the
technical complexity of the overall project was under-estimated.
Also adding to this, the control system philosophy for this STATCOM is
unknown, steering the modelling to be done by using an open-loop
approach. This choice in itself is valid when considering the control system
response speed of the STATCOM as reasonably slow when compared to a
system transient.
1.3 BACKGROUND
In 2012 Ergon Energy commissioned its first STATCOM system into the
sub-transmission network at St George Queensland. This STATCOM
replaced an aged Static VAr Compensator (SVC) unit which had been
deemed unsustainable due to reliability issues, and due to the fact that the
SVC manufacturer was no longer available to provided technical support for
the unit.
In addition to the classic advantages provided by STATCOM units over the
older SVC technology the D-VAR® unit purchased by Ergon Energy also
provided additional security through the use of two independent dynamic
VAr units (called Power Module Enclosures or PMEs), a redundant Master
Control Enclosure (or MCE) and three D-VAR® controlled 5MVAR
capacitor banks.
1.4 AMERICAN
SUPER
CONDUCTOR
AND
ERGON ENERGY
In order for Ergon Energy to provide ongoing support (in collaboration with
AMSC) for the St George D-VAR® STATCOM the Commissioning and
understanding of the protection, control and operational aspects of the
D-VAR® STATCOM.
The training provided to Ergon Energy’s personnel by AMSC was only to a
functional block level and did not provide any real detail on how the system
operated. Understandably AMSC also did not want to divulge specific detail
of the D-VAR® design as this would surrender their hard earned intellectual
property.
Based on the design information provided by AMSC and additional
information requested, Ergon Energy developed protection and control
system function diagrams to assist with understanding the operating
characteristics of the D-VAR®. One of these functional diagrams is shown
in Figure.1-2.
In the first year of operation of the D-VAR®, Ergon Energy experienced a
number of trip events which either removed the D-VAR® from service or
restricted its output capability. These events were investigated with support
from AMSC and resulted in some control system and component changes.
These investigations also highlighted the fact the limited understanding that
Ergon Energy had on how the unit operated also severely limited its ability
to understand and critically assess the rectification information provided by
AMSC.
One of the main concerns experienced was the high failure rate of the
Dynamic Braking Resistor control board (or DBR board) which was used to
help manage the DC bus voltage of the D-VAR®.
In essence the DBR board acts as an “overseeing controller” for the DC bus
which is used to build the DC bus when the inverters are idle and to
discharge energy from the bus when its voltage becomes too high.
One of the issues found after the failure of a number of these boards was
Unfortunately, the software change had not been made and this caused the
thermal rating of the new DBR boards to be exceeded resulting in premature
failure.
Since the rectification of this error the number of DBR board failures has
significantly decreased but there have still been a number of subsequent
failures experienced.
In order to better understand the nature of why the DBR boards are failing
we first need to understand how the board operates in context with the main
control system.
As stated previously, the DBR board is not the primary control mechanism
for the DC bus voltage but does act to a secondary control system
overarching the main control system. In normal operation the DC bus
voltage is controlled by the IGBT firing strategy which simultaneously
generates an AC voltage on the output (for reactive power output) and
maintains the DC bus voltage within its target range.
There are however two conditions where the IGBT firing strategy cannot
perform its duty of maintaining the DC bus voltage, these are when the
system is idle (that is the reactive power output is zero) and the other is
when a system transient results in a high speed over or under voltage
excursion of the DC bus voltage.
It is the latter of these two which it is hoped will provide some insight as to
why the DBR boards might be failing. To explain what is happening within
the D-VAR® under system transient conditions we first need to understand
how the D-VAR® switching strategy achieves its two objectives.
1.5 ST. GEORGE SYSTEM CONFIGURATION
The D-VAR® was connected to the St George 33𝑘𝑉 bus via two star-delta
33𝑘𝑉/480𝑉 transformers. The D-VAR® control system was designed to
bus. The St George D-VAR® STATCOM configuration is shown in
Figure.1-1
The two separate sections of the D-VAR® are interfaced into the 33𝑘𝑉 via
two Ring Main Units (RMU1 and RMU2) and these provide connection via
RMU1 33𝑘𝑉 feeder and RMU2 33𝑘𝑉 feeder respectively into the 33𝑘𝑉 bus
system, this voltage level is then raised to 66𝑘𝑉 to supply the local Sub-Transmission network through two step-up autotransformers and finally the
66𝑘𝑉 local network, see Figure 1-1 for details.
From a contractual point of view, whilst American Super Conductor had
previously commissioned a number of D-VAR® STATCOM throughout
Australia the Ergon Energy D-VAR® STATCOM would be the first
Australian system which would be operated by a government owned and
operated supply utility. A key point of significance resulting from this was
that unlike all previously installations AMSC could not be granted unlimited
and uncontrolled access to the D-VAR® STATCOM which when
commissioned formed part of the Ergon Energy operational network.
The AMSC experience at all previous installations was based on its ability
to monitor, maintain and modify the D-VAR® STATCOM s as it deemed
necessary to provide an operational system. Under this arrangement whilst
AMSC was required to coordinate with the D-VAR® owner to gain access to
the units it fundamentally managed and operated the D-VAR® STATCOM.
Due to security and operational constraints this type of arrangement was not
possible for the Ergon Energy D-VAR® STATCOM. This change in the
D-VAR® maintenance and management strategy meant that Ergon Energy
would play a collaborative role with AMSC in the maintenance and
management of the D-VAR® STATCOM.
The D-VAR® STATCOM is composed of a number of key sections /
devices as depicted in Figure.1-2. AS one of the key primary plant devices
STATCOM with the electrical Network via a three phase 33𝑘𝑉/480𝑉
(𝑌 − Δ) transformer.
A number of inverter modules (Inverter 1 Upper / Lower, Inverter 2 Upper /
Lower, Inverter 3 Upper / Lower, Inverter 4 Upper / Lower), operate
simultaneously supplying the STATCOM output with the required amount
of reactive power needed at any given time via separate current steering
reactor modules (2 × 100𝜇𝐻) and each inverter is equipped with its own
Dynamic Breaking Board (DBR) module.
The PME also contains a harmonic filter within, see Figure 1-2 for a
LOCAL T2 11kV/433 100kVA
=EB08 CB3670
ST GEORGE TOWN 33kV FDR
=EB06 =EB04 =EB02
CB3667 =EB05 ES3675 AB3657 AB3655 AB3652 AB3659 CB3656 CB3658 =EA03 =EA06 ES3672 CB3665 =EB07 =EB03 33kV/110V 200VA 33kV/110V 200VA
33kV, 3<, 50Hz, 1250A
25kA, 170kV B.I.L. 33kV, 3<, 50Hz, 1250A25kA, 170kV B.I.L.
AB3651 =EA01 =EA04 =EB01 =EB09 AB3654 AB3653 RMU 2
33kV FDR 33kV FDRRMU 1
N
5MVAr
CAPACITOR CAPACITOR5MVAr 5MVAr CAPACITOR CB3664 ES3671 ST GEORGE MEATWORKS 33kV FDR THALLON 33kV FDR CB3668 NOONDOO 33kV FDR ES3676 CB3680 ES3678 ES3673 ES3674 66/33/11kV, 20/11MVA/500kVA Yna0d1, 66/33/11kV, 20/11MVA/500kVA Yna0d1, =TX02
TRANSFORMER 2 =TX01TRANSFORMER 1
CB3666 ES3682 CB3681 PME PME ES3677 CB3669 DO3662 LOCAL T1 11kV/433 100kVA DO3661
33kV RMU 2 33kV RMU 1
4MVAr 4MVAr
SSC 2
N
SW3702 SW3693 SW3692
=MX04 =MX05 =MX03 =MX02 =MX01
[image:21.1191.178.952.59.747.2]DBR/ Boost Nut
Trigger Pluses
Inverter 1 Upper
C B A Brkr 1 Brkr 2 To Inverter
3 & 4 33 kV
480 V
Inverter 1 Lower A B C A B C
Inverter 2 Upper
Inverter 2 Lower
T o I n v e rt e r 3 & 4 Pre-Charge 1.5 Ohms 60 Amps T o C o n tr o l To Control To Control To Control
+/- 0.5 MVAR
Pole Cap = 8100μF (450V)
Snubber cap = 10μF (1000Vdc)
+/- 0.5 MVAR
+/- 0.5 MVAR
+/- 0.5 MVAR A
B C
A B
C Po
w e r In te rf a c e P o w e r In te rf a c e T ri g g e r P lu s e s In v e rt e r 1 U p p e r T ri g g e r P lu s e s In v e rt e r 1 L o w e r T o C o n tr o l To Control Harmonic Filter
PME
FU1 (1A) FU2 (1A) FU3 (1A) 400A 400A 400A 1A 1A 1A3 x 30.7 Micro F 3 x
30.7 Micro F
3 x 30.7 Micro F
3 x 30.7 Micro F 3 x 30.7 Micro F 3 x 30.7 Micro F 3 x 30.7 Micro F
3 x 30.7 Micro F 3 x 30.7 Micro F
2 X100 µH
1 0 0 µ H 1 0 0 µ H 1 0 0 µ H 2 X 1 O h m s V Sense Card V Sense Card Trigger Pluses Trigger Pluses Trigger Pluses Trigger Pluses Trigger Pluses
2 X100 µH
2 X100 µH
[image:22.595.115.475.84.608.2]2 X 1 O h m s 2 X 1 O h m s
1.6 PROJECT LIMITATIONS
This project has been developed to provide an insight in some of the
operational capabilities of the D-VAR® STATCOM. While the highest
degree of care has been taken to develop the whole project in such manner,
with this very objective in mind, some hurdles were reached which limited
the initial aims to be reached, the main reason described below:
The D-VAR® STATCOM is a three phase device:
- Without thorough knowledge of a single phase STATCOM model, it
would have been impossible to develop a greater understanding of
how a three phase version of this STATCOM may operate and for
this reason this project has been “scaled down” to a single phase
STATCOM
The theory developed throughout this dissertation applies to the very single
phase model analysed within. While it is clear that some of the
characteristics are similar between the single phase and the three phase
devices, progressing with the single phase model only due to time constrains
will ease any further / future analysis of a three phase STATCOM device.
The D-VAR® STATCOM control system:
- American Super Conductor (AMSC) utilises a number of controllers
throughout the STATCOM and these are bound under AMSC’s
Intellectual Property policies.
While an attempt has been made to reach a higher understanding of this
STATCOM, it has to be kept in mind that due to the lack of knowledge of
the control system philosophy used it is not possible to accurately model a
“perfect STATCOM” which will operate exactly as the D-VAR®
.
We were informed by Matt Pugh from AMSC that the D-VAR® control
alone, unfortunately, does not provide enough information about the control
system to enable this project to create a control system which will mimic the
D-VAR® STATCOM to the level needed for the modelling.
With that in mind the approach taken was to consider the STATCOM
control system as an open-loop control system and therefore assuming slow
control systems responses during its operation.
The above arguments reinforce the reasons for the approach taken during
this project, but does not diminish the level of work done and the
accomplishments reached during the course of this work, especially
considering the limited time allowed for the project to take place.
1.7 OVERVIEW OF DISSERTATION
This dissertation has been structured following the classic undergraduate
thesis structure:
The first chapter, INTRODUCTION – Introduces the topic of STATCOM
and the background information on the motivation, aims and objectives of
the dissertation. The St. George Substation system configuration is
introduced and an explanation is given is regards to any limitations reached
during the project.
The second chapter, LITERATURE REVIEW – Describes the limited
literature that was reviewed during the research process of this project.
Introduces the reader to key concepts related to this dissertation, such as
Reactive Power, its needs and the use of Reactive Power is managed by the
electrical utilities and electrical network operators.
The third chapter, METHODOLOGY – Briefly describes the methodology
used during the project and quickly introduces the reader to the model
MATLAB® used during the dissertation process.
The fourth chapter, THEORETICAL ANALYSIS – Guides the reader
explaining the reason for the analysis of each separate concept that so they
can be merged together and used side by side in the final analysis of the
STATCOM model.
The fifth chapter, MATHEMATICAL MODEL – Explains the MATLAB®
model in a “block-by-block” manner, aimed to demonstrate a
comprehensive understanding of the operational characteristics of the
numerical solving MATLAB® blocks utilised within the model.
The sixth chapter, SIMULATION RESULTS / DISCUSSION – As obvious
as its name, this chapter is aimed to present the results found during the
validation process of the model. It is in this chapter that the simulation
results were compared with a number of derived equations and some of the
well-known theory to ensure the validity of the MATLAB® model itself.
Only once the model was validated, discussions were developed to explain
the STATCOM operational capabilities in an open-loop state.
The seventh chapter, CONCLUSION – This is where the conclusions drawn
during the investigation process of the project are presented to the reader in
2 LITERATURE REVIEW
Static Synchronous Compensators have been widely used in power networks
for decades around the world (Vedam & Sarma, 2009) and several authors
have written about the topic at length.
STATCOMs operate interfaced in parallel to the network (Vedam & Sarma,
2009) and in the case of the D-VAR® the voltage support is provided by a
capacitor bank with relatively small energy storage capability and it does not
provide active power to the network during steady state operation (American
Super Conductor (AMSC), 2013).
Used to supply the network with needed amounts of reactive power for
voltage support and Power Factor correction (Ekanayake & Jenkins, 1996)
and therefore increasing the power transmission capability of the network
(Hingorani & Gyugyi, 2000), the amount of reactive power supplied by the
STATCOM to the network can be easily explained by classical power
transfer theory (Stevenson Jr., 1975), as can be seen in THEORETICAL
ANALYSIS section of the dissertation.
A number of authors have described the main functionalities of
STATCOMs, although much is unknown about proprietary techniques used
by different manufacturers of the technology to build the DC bus voltage
level higher than the peak value of the supply voltage.
Jenkins and Ekanayake explain that the capacitors in a STATCOM can be
charged up to the peak value of the supply voltage by managing the
switching strategy (Ekanayake & Jenkins, 1996), but their research does not
extend to assessing the generation of a DC bus voltage to a greater nominal
value than the input RMS voltage.
Marin describes differences, advantages and disadvantages of different
techniques used to build the AC signal at the converter level in a multi-pulse
cancellation characteristics of multi-pulse and multi-level converter
configuration and also pulse width modulation.
American Super Conductor uses pulse width modulation to generate the
output signal, with a switching frequency of approximately 4 kHz
(American Super Conductor (AMSC), 2013). Beyond this they do not
provide any detail of how the PWM technique also performs the building
and maintenance of the DC bus.
This project is intended to fill the gaps found in relation to the lack of
information on the specific IGBT switching strategy which enables the
D-VAR® to build and maintain the DC bus voltage at 840V𝐷𝐶 from a 480V𝐴𝐶
system voltage.
2.1 REACTIVE POWER
The power network is used to deliver electrical energy to domestic,
commercial and industrial customer throughout its reach. The electrical
power network is required to meet certain criteria to operate effectively,
efficiently and reliability; one of these criteria is voltage levels.
As described in section 4.51, sub-section (a), Power System Voltage
Control, of NER v.68, “the Australian Energy Market Operator (AEMO)
must determine the adequacy of the capacity of the power system to produce
or absorb reactive power in the control of the power system voltages”
(Australian Energy Market Commission, 2015).
AEMO must also agree, in consultation with the Network Service Providers,
not only upon voltage limits / settings, but also reactive power production
(or absorption) capacity among other appropriate limits to enable their use
by AEMO in the maintenance of power system security (Australian Energy
Market Commission, 2015).
determined by previous analysis or periodic contingency analysis
(Australian Energy Market Commission, 2015).
There are a number of Reactive Power supply methods available now a day
and these are categorised by its capacity deliver approach.
2.2 DISCRETE REACTIVE POWER DEVICES
Discrete Reactive Power devices can be capacitive and / or inductive. They
are used to provide a set amount of reactive power at strategic points of the
electrical network. Some examples of discrete Reactive Power devices
present in the electrical network are: Capacitor banks (usually shunt
connected), shunt and line Reactors (Inductors).
2.2.1 CAPACITIVE DEVICES
Placed at strategic locations / substations within the electricity network,
capacitor banks provide voltage support by the injection of Reactive Power
into the network, improving the system power factor, supporting the system
voltage and as result decreasing losses within the system. The decision to
invest in this solution is the result from model analysis by the electricity
supplier identifying the need for support at crucial periods of the day
(Vedam & Sarma, 2009).
Capacitor banks are a cost effective solution when connected to points in the
network where fast response times are not of major concern, such as
domestic distribution areas.
2.2.2 INDUCTIVE DEVICES
Among the various types of Inductive devices used in the electrical network,
shunt Reactors are a common solution to Reactive Power absorption within
the electrical network.
Commonly located at substations where long High Voltage transmission
lines arrive, shunt reactors absorb excess reactive power from the line when
nominal voltage value avoiding potential damage from equipment
overvoltage.
2.3 DYNAMIC REACTIVE POWER DEVICES
Unlike discreet Reactive Power devices, dynamic Reactive Power devices
are controlled by real times sampled systems. Their associated control
systems manage how much Reactive Power is needed, to be absorbed or
delivered, at any given time at the point of connection.
These control systems are commonly able to decide and operate within a
few cycles of the fundamental frequency (at 50 Hz, 1 cycle is 20 ms), these
fast reactions provide a seamless operation and considerable improvements
in the power quality of the electrical system voltages.
2.3.1 STATIC VAr COMPENSATOR (SVC)
The Static VAr Compensator is an example of dynamically controlled
Reactive Power system which uses capacitive and inductive banks to
provide a variable amount of Reactive Power when needed.
Among the various technologies used within the SVCs, they commonly use
Thyristor Controlled Reactors (TCR) and Thyristor Switched Capacitors
(TSC) and these are strategically switched managing any requirement of
Reactive Power need at the point of connection.
Due to its operational characteristics SVCs tend to generate a reasonable
amount of low frequency harmonics (usually 5th and 7th harmonic), requiring
the installation of harmonic filters for the above mentioned frequencies to be
contained within its installed system minimising the amount of harmonic
injected into the power system.
Until the “popularisation” of the STATCOMs, SVCs were widely installed
around the World when dynamic Reactive Power control, with fast response
2.3.2 STATIC
SYNCHRONOUS
COMPENSATOR
(STATCOM)
Since it was first proposed by Gyugyi and Pelly in 1976, the use of “all silicon” solutions to the challenges of reactive power compensation in
electricity networks has become very popular, eliminating the need for
reactive storage components used in rectifier-inverter based system, such as
the STATCOM (Krishna, 2014).
Considering its main control attributes, namely Negative Phase Sequence
(NPS) correction and oscillation damping in electrical networks, the
STATCOM has become a popular solution when some of these issues are to
be solved in certain parts of the electrical network.
The main control attributes contained in the studied STATCOM are;
Voltage control, VAr compensation, oscillation damping, voltage stability
and NPS correction.
Furthermore, the STATCOM contains some inherent advantages, such as
the non-generation of low frequency harmonics. This meaning that no
harmonic filters are needed to be installed as part of a STATCOM system
and therefore the foot print required for this solution is significantly smaller
of that of the earlier Static VAr Compensator (SVC).
2.3.3 POWER INVERTERS
The STATCOM is one of the key Flexible Alternating Current Transmission
Systems (FACTS) Controllers (Hingorani & Gyugyi, 2000) and has the
converter (Inverter) as its main element. A STATCOM can be designed to
operate using one of the two main types of inverter controls below:
- Voltage-Sourced Inverters (VSI) – Inverter which uses unidirectional
DC voltage from a DC capacitor which is converted to AC through
sequential device switching. By employing the correct converter
topology, it is possible to fully control the voltage output, not only in
voltage. This type of inverter when employed in a STATCOM uses
a voltage level threshold as its target and attempts to keep its voltage
output within the set range.
- Current-Sourced Inverters (CSI) – In the current-sourced inverter a
DC current (supplied by an inductor) is converted into AC current
(through sequential device switching) and is presented to the AC
system and it can be varied in magnitude and phase angle in respect
to the system voltage (its reference). This inverter dynamically
controls its current output based on its set target range.
Inverter technology is well-known and has been used in a number of
different applications since its development (Mohan, et al., 1989). Although
both types of inverters were briefly described above the Current Source
Inverters lay outside the scope of this project, since the inverter technology
used by AMSC on the D-VAR® STATCOM is clearly of a VSI, as depicted
in Figure 1-2 which shows that the DC bus is comprised of DC capacitors.
Voltage-source inverters (VSI) can be divided in 3 general categories, as
described by (Mohan, et al., 1989), and these are:
- Pulse Width Modulated (PWM) – This type of inverter uses an
essentially constant DC voltage input (in magnitude) and due to this
the inverter itself must control the magnitude and frequency of the
AC output voltages, which is achieved by pulse width modulation
technique. While there are various schemes used to pulse width
modulate the inverter switches operation in order to achieve the
desired wave shape output, all of attempt to generate an output that is
as close as possible to a “perfect sinewave”.
- Square wave inverters – In this type of inverter the control of the DC
bus voltage is achieved externally to the inverter which allows the
signal. This type of inverter has an output shape which is similar to
a square wave (hence the name)
- Single-phase Inverters with Voltage Cancellation – Inverters with
single phase output, have the ability to control
While a number of inverter categories exist, the focus of this project is in
PWM, which as described by AMSC, is the used technology to create its
sinewave output modulated at 4 kHz.
2.3.4 PWM SWITCHING
Despite the many different switching techniques used in various “all silicon”
DC/AC inverters / converters this project will give emphasis to PWM as this
is the technique used on the D-VAR® STATCOM.
This type of inverter controls the generation of its output signal by
comparing a control signal (𝑣𝑐𝑜𝑛𝑡𝑟𝑜𝑙) to a triangular waveform switched at
𝑓𝑠 = 4kHz (inverter switching or carrier frequency), which is kept constant
alongside its amplitude 𝑉̂𝑡𝑟𝑖 (Rashid, 1988). The control signal (𝑣𝑐𝑜𝑛𝑡𝑟𝑜𝑙) is
effectively used to control the IGBT duty cycle and is switched at frequency
(𝑓1), also called modulating frequency, which is the fundamental frequency
of the inverter AC output.
2.3.5 D-VAR
®SWITCHING METHOD
There are a number of ways in which a STATCOM can be configured to
operate, each with their own advantages and disadvantages.
STATCOM manufacturers such as Siemens use sinewave stepped
approximation as its method to generate its inverter output (Siemens, 2015).
Based on the information provided by AMSC the D-VAR® STATCOM
operates using a basic pulse width modulation technique.
While sinewave stepped approximation and PWM are well-known (Rashid,
1988), what has not been widely published is how a PWM switching
explanation based on controlling the phase shift between the system and
inverter voltages.
2.4 STATCOM OPERATION
To perform an analysis of the STATCOM, we re-define previously
introduced terms, such as:
- 𝑉̂𝑡𝑟𝑖→ carrier signal peak voltage
- 𝑓𝑠 → carrier signal frequency
- 𝑉̂𝑐𝑜𝑛𝑡𝑟𝑜𝑙→ modulating signal peak voltage
- 𝑓1 → modulating signal frequency
For a STATCOM system the modulating signal is defined in frequency by
the grid or system voltage, that is, we generally use a phase lock loop to
synchronise the STATCOM modulating signal to the system voltage. Thus
the system fundamental frequency 𝑓1 = 50𝐻𝑧 is the STATCOM modulating
signal frequency.
Based on the carrier and modulating signals we can define the amplitude
modulation ratio as:
𝑚𝑎 =
𝑉̂𝑐𝑜𝑛𝑡𝑟𝑜𝑙 𝑉̂𝑡𝑟𝑖
Equation 2-1
and the frequency modulation ratio is:
𝑚𝑓 = 𝑓𝑠 𝑓1
It can be shown that the peak amplitude of the fundamental component of
the PWM inverter output is given by:
𝑉̂𝑜𝑢𝑡_𝑓𝑢𝑛𝑑 = 𝑚𝑎𝑉𝑑 2 =
𝑉̂𝑐𝑜𝑛𝑡𝑟𝑜𝑙
𝑉̂𝑡𝑟𝑖
×𝑉𝑑 2
Equation 2-3
provided that 𝑉̂𝑐𝑜𝑛𝑡𝑟𝑜𝑙 ≤ 𝑉̂𝑡𝑟𝑖 (or 𝑚𝑎 ≤ 1.0). Here 𝑉𝑑 is the DC bus voltage (that is from the positive to the negative rail).
Given the equation for the peak of fundamental component of the
STATCOM voltage output we can approximate the values for P and Q
delivered by the STATCOM as follows;
𝑉𝑆 = |𝑉𝑆|∠𝛿 = (𝑚𝑎
𝑉𝑑
2 ×
1 √2) ∠𝛿
Equation 2-4
𝑉𝐺 can be found using a load flow solution based on the source Thevenin
impedance and a fixed power load.
Given 𝑉𝑆 and 𝑉𝐺 we can find P and Q using the previously derived equations
(having the grid as the reference);
𝑃 =|𝑉𝐺||𝑉𝑆|
𝜔𝐿𝑆 sin(𝛿) =
|𝑉𝐺| (𝑚𝑎𝑉2 ×𝑑 1
√2)
𝜔𝐿𝑆 sin(𝛿)
Equation 2-5
𝑄 =|𝑉𝐺| 𝜔𝐿𝑆[(𝑚𝑎
𝑉𝑑
2 ×
1
√2) cos(𝛿) − |𝑉𝐺|]
This approach could also be used when creating the STATCOM model to
determine values for the modulation index (𝑚𝑎) and the DC bus voltage for
a given Reactive Power output. A simple and quick calculation like this can
save significant time when trying to set up the model parameters to provide
3 METHODOLOGY
The studies performed in this thesis will be based on numerical modelling
and the application of power electronic principles. A MATLAB®
SimPowerSystems model has been developed and was used to validate the
theoretical findings of this project.
The MATLAB model is used to develop a better understanding on how the
IGBT switching strategy is employed to build and maintain the DC bus and
once a full appreciation of the IGBT switching strategy was gained, an
analysis of the effects of network transients on the DC bus voltage was
performed.
To develop this theoretical approach a number of equations have been
derived from first principles and these will assist in developing an
understanding on possible mechanisms used by the manufacturer to achieve
some key goals within the D-VAR® STATCOM functionalities.
3.1 STATCOM MODEL – MATLAB
®As a key part of this project a MATLAB® SimPowerSystems model of a
single phase STATCOM was developed as to assist in the analysis process.
This model was developed relying only on a limited number of key details
supplied by the manufacturer, AMSC, and keeping this in mind, the IGBT
switching strategy analysis was performed only taking into consideration
power electronics principles of operation with the DC bus control system in
open-loop state, see Figure 3-1 for reference.
The main reason for this approach is the understandable reluctance from
AMSC to provide specific information on operational details on the
4 THEORETICAL ANALYSIS
To be able to reach a solution to the question at hand the development of
theoretical understanding of the operational functionality of the STATCOM
is essential and to achieve this, a number of approaches were taken.
From the Network’s perspective the STATCOM acts as a Reactive Power
source and to assist in the understanding of this concept power flow theory
was considered and investigated.
Once full understanding was reached in regards to how a source (the
STATCOM) delivers power into the Network, further investigation was
carried out in the attempt to comprehend how the converter operates and
manages its IGBT operation.
Finally allowing a complete analysis of how the switching strategy
influences the DC bus voltage and how the STATCOM copes with a
number of Network transients.
4.1 POWER FLOW
To explain how power flow takes place between the STATCOM and the
network, we use the equivalent circuit depicted Figure 4-1.
LS
VG
VS
Is
VLs
Figure 4-1 - STATCOM connected to the power network (equivalent circuit)
By analysing the above equivalent circuit, we conclude that the amount of
Active and Reactive Power transferred between the STATCOM and the
𝑃 =|𝑉𝐺||𝑉𝑆|
𝜔𝐿𝑆 𝑠𝑖𝑛(𝛿)
Equation 4-1
and
𝑄 =|𝑉𝐺|
𝜔𝐿𝑆 × (|𝑉𝑆|𝑐𝑜𝑠(𝛿) − |𝑉𝐺|)
Equation 4-2
As it can be seen in Equation 4-1 and Equation 4-2 from an equivalent
circuit approach, the STATCOM can be treated simply as a source
(generator) connected to the grid when power transfer is investigated.
For completeness, the derivation of the above equations from first principles
was carried out in APPENDIX B – GENERATOR EQUATION
DERIVATION.
It can clearly be seen that both P and Q can be controlled by adjusting the
values of 𝑉𝑆 and 𝛿 using the STATCOM control system. In the STATCOM,
the active power flow equation clearly shows that if the STATCOM voltage
𝑉𝑆 = |𝑉𝑆|∠𝛿 lags the grid voltage (that is 𝛿 < 0) then 𝑃 < 0, that is active
power flows from the grid into the STATCOM.
If we consider the reactive power equation for 𝛿 = 0 then we have
𝑄 = |𝑉𝐺|
𝜔𝐿𝑆[|𝑉𝑆| −|𝑉𝐺|]
Equation 4-3
for |𝑉𝑆| < |𝑉𝐺| then 𝑄 < 0 and the STATCOM appears inductive to the network.
We must remember that 𝑆 = 𝑉𝐼∗ and thus;
- Capacitive current → Current leads voltage → 𝑄 < 0
- Inductive current → Current lags voltage → 𝑄 > 0
For the perspective of the STATCOM everything is reversed. Remember
that when we derived the above equation for Q we did so it in terms of the
STATCOM. From the Grid perspective we would have had:
𝑆 = 𝑃 + 𝑗𝑄 = −𝑉𝐺𝐼𝑆∗
Equation 4-4
which would give us;
𝑃 = −|𝑉𝐺||𝑉𝑆|
𝜔𝐿𝑆 sin(𝛿)
Equation 4-5
That is – if the STATCOM voltage 𝑉𝑆 = |𝑉𝑆|∠𝛿 lags the grid voltage (that is
𝛿 < 0) then 𝑃 > 0, which means that active power flows from the grid into
the STATCOM.
𝑄 = −|𝑉𝐺|
𝜔𝐿𝑆[|𝑉𝑆|cos(𝛿) − |𝑉𝐺|]
Equation 4-6
from the STATCOM perspective that this was 𝑄 > 0. This is because if the current lags the voltage from the STATCOMs’ perspective then it leads from the grids’ perspective.
Note – the reason we derive the above equations in terms of the active and
reactive power delivered from the STATCOM with the grid voltage as the
reference is that in practice we consider the grid voltage phase angle as fixed
and the power to flow from the STATCOM into the grid in support of the
grid voltage.
Whilst this may introduce some confusion (in that it may not be seen as
conventional to treat the grid voltage as the reference source but then define
the current as flowing from the STATCOM into that source) there are
benefits in defining the system in this way. The main benefit is that for
𝛿 > 0 we have 𝑃 > 0 from the STATCOM perspective which aligns with
the standard convention of a leading source will deliver active power to a
load. The other real benefit of using the grid voltage as the reference it that
when we want to calculate instantaneous power flow using the inductor
current we can perform this calculation on either the STATCOM side or the
grid side of the current steering reactor.
When we consider that in practice the voltage on the STATCOM side is a
switched DC waveform then it becomes very apparent that is much simpler
to use the grid side voltage. The main disadvantage is that for |𝑉𝑆| > |𝑉𝐺|
we have 𝑄 > 0 at the STATCOM which by standard convention represents
inductive reactive power, however to the grid this would be seen as
capacitive reactive power.
As we are primarily interested in the flow of active power we will in general
persist with the above defined convention of current flow and voltage
reference.
It should also be noted at this time that for a STATCOM which is
two-quadrant operation) then the control of P is commonly used to regulate the
DC bus voltage.
Under steady state conditions this would in theory equate to the supply of
𝐼2𝑅 losses in the STATCOM which would be quite small. Based on the
derived power equations it could be argued that a change in |𝑉𝐺| and/or 𝛿 due to a system transient will affect P and Q flow between the STATCOM
and the grid. The question then begs what is the consequence of this on the
STATCOM reactive power output and the DC bus regulation in the short
term for a system transient condition?
4.2 STATCOM THEORETICAL POWER FLOW
ANALYSIS
For this theoretical analysis we will redefine the system as shown in the
figure below.
Figure 4-2 - STATCOM connected to the power network (equivalent circuit)
The reason for doing this is that it is much simpler mathematically and less
confusing for the reader if we define the grid voltage as the reference source
and the inductor current as flowing out of the chosen reference source.
Previously we defined the current direction as positive when flowing out of
the STATCOM as this better represented the system from a practical view
point.
Unfortunately, the change in ‘convention’ for this part of the analysis may
to maintain the previously established convention for the following
derivations. In essence the only change by reversing the current direction for
the following theoretical analysis is a sign change for the derived power
flows.
Given that the grid and STATCOM voltages are defines as follows
𝑣𝑔𝑟𝑖𝑑(𝑡) = 𝑉̂𝐺sin(𝜔𝑡)
Equation 4-7
𝑣𝑆𝑇𝐴𝑇𝐶𝑂𝑀(𝑡) = 𝑉̂𝑆sin(𝜔𝑡 + 𝛿)
Equation 4-8
and using the grid as the reference (that is the grid voltage is taken as
reference voltage and the current is assumed to flow out of the grid source
towards the STATCOM) the inductor voltage can be expressed as;
𝑣𝐿 = 𝑉̂𝐺sin(𝜔𝑡) − 𝑉̂𝑆sin(𝜔𝑡 + 𝛿)
Equation 4-9
⟹ 𝑣𝐿 = 𝑉̂𝐺sin(𝜔𝑡) − 𝑉̂𝑆[sin(𝜔𝑡) cos(𝛿) + cos(𝜔𝑡)sin (𝛿)]
⟹ 𝑣𝐿 = (𝑉̂𝐺 − 𝑉̂𝑆cos(𝛿)) sin(𝜔𝑡) − 𝑉̂𝑆sin(𝛿) cos (𝜔𝑡)
now
𝑖𝐿 =
1
⟹ 𝑖𝐿 =
1
𝐿∫[(𝑉̂𝐺 − 𝑉̂𝑆cos(𝛿)) sin(𝜔𝑡) − 𝑉̂𝑆sin(𝛿) cos (𝜔𝑡)] 𝑑𝑡
Equation 4-11
⟹ 𝑖𝐿 =
1
𝜔𝐿[(𝑉̂𝑆cos(𝛿) − 𝑉̂𝐺) cos(𝜔𝑡) − 𝑉̂𝑆sin(𝛿) sin(𝜔𝑡)] + 𝐶
Equation 4-12
where 𝐶 is the constant of integration. As we know that ∫ 𝑖0𝑇 𝐿𝑑𝑡 =
∫ cos(𝜔𝑡) 𝑑𝑡 =0𝑇 ∫ sin(𝜔𝑡) 𝑑𝑡 = 00𝑇 thus 𝐶 must be equal to zero. Now that we have an expression for the inductor current we can write an equation for
the instantaneous apparent power flow on the grid side of the current
steering reactor;
𝑠(𝑡) = 𝑣𝑔𝑟𝑖𝑑(𝑡) × 𝑖𝐿∗(𝑡)
Equation 4-13
Note that we use the conjugate of the current to get the correct polarity of
the reactive power component. As the inductor current is not expressed in
complex for we need to be able to determine what the conjugate is.
Fortunately, because it has been written in terms of sine and cosine terms we
can readily determine the real and imaginary components. That is, as the
grid voltage has been taken as 𝑣𝑔𝑟𝑖𝑑(𝑡) = 𝑉̂𝐺sin(𝜔𝑡) the sine term of 𝑖𝐿
will be in phase with 𝑣𝑔𝑟𝑖𝑑 and the cosine term will be at 90° to 𝑣𝑔𝑟𝑖𝑑 and
thus the cosine term represents the imaginary part of the current.
𝑠(𝑡) = 𝑉̂𝐺sin(𝜔𝑡) ×
1
𝜔𝐿[(𝑉̂𝐺 − 𝑉̂𝑆cos(𝛿)) cos(𝜔𝑡) − 𝑉̂𝑆sin(𝛿) sin(𝜔𝑡)]
𝑠(𝑡) = 𝑉̂𝐺
𝜔𝐿[(𝑉̂𝐺 − 𝑉̂𝑆cos(𝛿)) cos(𝜔𝑡) sin(𝜔𝑡) − 𝑉̂𝑆sin(𝛿) sin2(𝜔𝑡)]
Equation 4-15
𝑠(𝑡) = 𝑉̂𝐺 𝜔𝐿[
1
2(𝑉̂𝐺− 𝑉̂𝑆cos(𝛿)) sin(2𝜔𝑡) − 1
2𝑉̂𝑆sin(𝛿) (1 − cos(2𝜔𝑡))]
Equation 4-16
𝑠(𝑡) = 𝑉̂𝐺
2𝜔𝐿[𝑉̂𝐺sin(2𝜔𝑡) − 𝑉̂𝑆cos(𝛿) sin(2𝜔𝑡) − 𝑉̂𝑆sin(𝛿) + 𝑉̂𝑆sin(𝛿)cos (2𝜔𝑡)]
Equation 4-17
𝑠(𝑡) = 𝑉̂𝐺
2𝜔𝐿[−𝑉̂𝑆𝑠𝑖𝑛(𝛿) + 𝑉̂𝐺𝑠𝑖𝑛(2𝜔𝑡) − 𝑉̂𝑆{𝑐𝑜𝑠(𝛿) 𝑠𝑖𝑛(2𝜔𝑡) − 𝑠𝑖𝑛(𝛿) cos(2𝜔𝑡)}]
Equation 4-18
𝑠(𝑡) = 𝑉̂𝐺
2𝜔𝐿[−𝑉̂𝑆sin(𝛿) + 𝑉̂𝐺sin(2𝜔𝑡) − 𝑉̂𝑆sin(2𝜔𝑡 − 𝛿)]
Equation 4-19
Alternately, we could derive expressions for the instantaneous power flow
using the complex form of the inductor current. That is, we can rewrite the
previously derived inductor current as a complex number using the grid
𝑖𝐿 = − 𝑉̂𝑆
𝜔𝐿𝑠𝑖𝑛(𝛿) + 𝑗 {(
𝑉̂𝑆𝑐𝑜𝑠(𝛿) − 𝑉̂𝐺
𝜔𝐿 )}
Equation 4-20
From this expression we can see that the component of the current in phase
with the grid voltage is given by:
𝑖𝐿_𝑎𝑐𝑡𝑖𝑣𝑒 = − 𝑉̂𝑆
𝜔𝐿𝑠𝑖𝑛(𝛿) 𝑠𝑖𝑛 (𝜔𝑡)
Equation 4-21
and the component of the current at 90° to the grid voltage is given by
𝑖𝐿_𝑟𝑒𝑎𝑐𝑡𝑖𝑣𝑒 = (
𝑉̂𝑆𝑐𝑜𝑠(𝛿) − 𝑉̂𝐺
𝜔𝐿 ) 𝑐𝑜𝑠 (𝜔𝑡)
Equation 4-22
Thus the instantaneous active power flowing from the grid to the
STATCOM will be given by
𝑝(𝑡) = 𝑣𝑔𝑟𝑖𝑑× 𝑖𝐿_𝑎𝑐𝑡𝑖𝑣𝑒 = −
𝑉̂𝐺𝑉̂𝑆
𝜔𝐿 𝑠𝑖𝑛(𝛿) 𝑠𝑖𝑛2(𝜔𝑡)
Equation 4-23
⟹ 𝑝(𝑡) = −𝑉̂𝐺𝑉̂𝑆
2𝜔𝐿𝑠𝑖𝑛(𝛿) (1 − 𝑐𝑜𝑠 (2𝜔𝑡))
⟹ 𝑝(𝑡) = −𝑉̂𝐺𝑉̂𝑆
2𝜔𝐿𝑠𝑖𝑛(𝛿) +
𝑉̂𝐺𝑉̂𝑆
2𝜔𝐿𝑠𝑖𝑛(𝛿) 𝑐𝑜𝑠 (2𝜔𝑡)
Equation 4-25
and the instantaneous reactive power will be given by
𝑞(𝑡) = 𝑣𝑔𝑟𝑖𝑑× −𝑖𝐿_𝑟𝑒𝑎𝑐𝑡𝑖𝑣𝑒 = −
𝑉̂𝐺
𝜔𝐿(𝑉̂𝑆𝑐𝑜𝑠(𝛿) − 𝑉̂𝐺) 𝑐𝑜𝑠(𝜔𝑡) 𝑠𝑖𝑛 (𝜔𝑡)
Equation 4-26
⟹ 𝑞(𝑡) = − 𝑉̂𝐺
2𝜔𝐿(𝑉̂𝑆𝑐𝑜𝑠(𝛿) − 𝑉̂𝐺)𝑠𝑖𝑛 (2𝜔𝑡)
Equation 4-27
⟹ 𝑞(𝑡) = −𝑉̂𝐺𝑉̂𝑆
2𝜔𝐿𝑐𝑜𝑠(𝛿) +
𝑉̂𝐺2
2𝜔𝐿𝑠𝑖𝑛 (2𝜔𝑡)
Equation 4-28
Note – we need to introduce the negative sign for the 𝑞(𝑡) calculation as we
need to use 𝑖𝐿∗ otherwise the sign of 𝑞(𝑡) will be incorrect. This is just a
negative sign as 𝑖𝐿_𝑟𝑒𝑎𝑐𝑡𝑖𝑣𝑒 is the imaginary component of the inductor
current.
The advantage of this derivation is that it provides expressions for both the
instantaneous active and reactive power. These results are not surprising as
we can see that in both cases the average power flowing from the grid into
𝑃 = −𝑉̂𝐺𝑉̂𝑆
2𝜔𝐿𝑠𝑖𝑛(𝛿)
Equation 4-29
Previously we derived the same equation for 𝑃 with the only difference
being the negative sign. As stated at the beginning of this section the sign
reversal comes from the fact that we have reversed the current direction.
Both equations are identical in that they tell us that for 𝛿 > 0 (that is the STATCOM fundamental voltage output leads the grid voltage) active power
flows from the STATCOM to the grid. That is, from the perspective of the
grid the power flow is negative and from the perspective of the STATCOM
the power flow is positive. The equations also show us that the converse of
this is true for 𝛿 < 0.
In order to assess the behaviour of the active power flow for varying phase
shifts between the STATCOM fundamental output voltage and the grid
voltage we need to go back to basics. We know that the general form for
power flow is given by
𝑆 = 𝑉𝐼∗= 𝑃 + 𝑗𝑄
Equation 4-30
which tells us that
|𝑆| = |𝑉||𝐼| = √𝑃2+ 𝑄2
𝜙 = 𝑡𝑎𝑛−1(𝑄
𝑃)
Equation 4-32
and thus for a fixed Q and V (assumed constant grid voltage) if we increase
P then 𝐼 must increase in magnitude and the phase angle 𝜙 must decrease.
Alternately, if we reduce P then 𝐼 must become smaller and the phase angle
must increase. Obviously the STATCOM will not be an exception to these
rules but the question is how is this achieved through the control of active
and reactive power within the STATCOM? Looking at the expressions for
the average active and reactive power flow from the grid to the STATCOM
(repeated here for convenience)
𝑃 = −𝑉̂𝐺𝑉̂𝑆
2𝜔𝐿𝑠𝑖𝑛(𝛿)
Equation 4-33
and
𝑄 = − 𝑉̂𝐺
2𝜔𝐿(𝑉̂𝑆𝑐𝑜𝑠(𝛿) − 𝑉̂𝐺)
Equation 4-34
we can see that for a change in 𝛿 we both change the P and Q values. This is
not really surprising when we look at our general power flow equations
above but we need to be careful here as 𝜙 in the generic power flow
equa