ii
University of Southern Queensland
Faculty of Health, Engineering & Sciences
Insulated Container Testing & Rating system
Development
A Dissertation submitted by
Mr. Thierry-Jacques Patrick Vever
Mechanical Engineering
In fulfilment of the requirements for the degree of
Bachelor of Engineering
iii
© Copyright by Thierry-Jacques Patrick Vever 2015
iv
Abstract
This research project seeks to develop a cheap, accurate, objective, repeatable and universal testing & rating system for insulated containers (eskies, chilly bins, coolers, ice boxes, cooler bags, pizza pouches, etc), similar to the star ratings for white goods, plumbing fixtures and motor vehicles, whether used for cold or hot items. Currently, there is no such system available on the domestic market, and none has been observed in any other market.
The testing consists of placing an empty vessel in a chamber at 5°C, and waiting until its temperature is in equilibrium with that chamber, then transferring it to a chamber at 55°C, and again waiting until equilibrium is reached, and the time taken to reach equilibrium is observed. This process is then reversed as a double check to compare heat ingress and heat egress.
The rating consists of taking the temperature differential and the time taken to reach steady-state and applying them to the volume of the vessel and the internal heat of air in the volume to determine a numerical result in W/K. The resultant number is the rating. This is far simpler than converting this into a number of stars (as is common with other ratings systems), and very quickly, consumers will begin to know the general range of numbers and be able to compare them to know what is sufficient for each of their needs.
Successful tests have been carried out to demonstrate that this is a viable testing & rating system which stands to benefit the general community whenever a consumer chooses to purchase an insulated container. By displaying the results of such a testing & rating system, manufacturers can instil confidence for their customers that their purchase will meet their needs with respect to the thermal performance of the chosen product.
v
Disclaimer
University of Southern Queensland
Faculty of Health, Engineering and Sciences
ENG4111/ENG4112 Research Project
Limitations of Use
The Council of the University of Southern Queensland, its Faculty of Health, Engineering & Sciences, and the staff of the University of Southern Queensland, do not accept any responsibility for the truth, accuracy or completeness of material contained within or associated with this dissertation.
Persons using all or any part of this material do so at their own risk, and not at the risk of the Council of the University of Southern Queensland, its Faculty of Health, Engineering & Sciences or the staff of the University of Southern Queensland.
vi
Certification
University of Southern Queensland
Faculty of Health, Engineering and Sciences
ENG4111/ENG4112 Research Project
Certification of Dissertation
I certify that the ideas, designs and experimental work, results, analyses and conclusions set out in this dissertation are entirely my own effort, except where otherwise indicated and acknowledged.
I further certify that the work is original and has not been previously submitted for assessment in any other course or institution, except where specifically stated.
TJ Vever
vii
Acknowledgements
My first thanks must go to my wife and children, who have been so patient and understanding over the last 8 years as I completed my degree in mechanical engineering. My second thanks must go to my supervisor, Ruth Mossad, without whom I would have given up at least 2 years ago. Ruth’s ability to extend herself for me during some of the final courses of my degree has made it all bearable. I specifically chose Ruth to be my supervisor knowing that she would humbly continue that support all the way to the end.
I would also like to thank Terry Byrne for all his assistance with preparing the laboratory tests carried out for this project, including making temperature and pressure sensors for live reads in the hot and cold chambers, which also involved some clever 3D printed brackets and cradles for containing them in small packages. There is also the fine assistance of Friederike Eberhard and Adrian Blokland for monitoring and assisting with regards to the use of the laboratory equipment and carrying out tasks during the tests.
I must also thank the various librarians that have assisted me in this project. They include Sandra Cochrane, for consistently coming back with answers, Vivienne Armati, for walking me through EndNote, and Marcos Riba, for spending his personal time helping me manipulate databases. None of my research or my citations & referencing would have been possible without their training and support.
I would also like to thank various industry organisations that have assisted with information for the research of this project. They include Choice Magazine Australia, NATA (National Association of Testing Authorities), Standards Australia, and NMI (National Measurement Institute).
viii
Table of Contents
Abstract ... iv
Disclaimer... v
Certification... vi
Acknowledgements ... vii
List of Equations ... xii
List of Figures ... xiii
List of Tables ...xiv
Glossary of Terms... xv
Nomenclature ...xvi
1. Introduction ... 1
1.1. Selection Confusion ... 1
1.2. Project Aim ... 2
1.3. Project Focus ... 3
1.4. Limitations... 3
2. Literature Review ... 5
2.1. Current Industry Practice ... 5
2.1.1. Industry Tests & Ratings ... 6
2.1.2. Similar Industry Processes ... 6
2.2. Industry Observers ... 7
2.3. Researchers Insights ... 8
2.4. Regulators ... 9
2.5. Applicability of Literature ... 10
3. Methodology ... 14
3.1. Target Products ... 14
3.1.1. Consumer Market Testing ... 15
3.1.2. Commercial Market Testing ... 15
3.2. The Science Within ... 16
3.3. The Concept of Heat ... 16
3.3.1. Modes of Heat ... 17
3.3.2. Media for Heat ... 21
3.4. Testing Processes ... 23
ix
3.4.2. Experimental Testing ... 24
3.5. Testing Procedure ... 27
3.5.1. Volume & Surface Area ... 27
3.5.2. Temperature Versus Time ... 30
3.6. Rating Procedure... 31
3.6.1. Human Interpretation ... 31
3.6.2. Shifting the Interpretative Function ... 31
3.6.3. Rating System Options ... 32
3.7. Sustainability ... 35
4. Analysis (Results) ... 36
4.1. Mathematical Results from MS Excel ... 36
4.1.1. Air/Water Comparison ... 36
4.1.2. Shape Impacts ... 38
4.1.3. Size Impacts ... 38
4.1.4. Total Internal Energy ... 39
4.1.5. Temperature Selection ... 41
4.1.6. Specific Internal Energy ... 42
4.1.7. Material Impacts ... 44
4.2. Experimental Results from USQ Laboratory ... 47
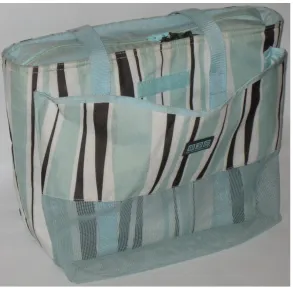
4.2.1. Sample Specimen Selection ... 48
4.2.2. Laboratory Equipment ... 50
4.2.3. The Test Plan ... 52
4.2.4. Outputs ... 56
4.2.5. Analysis of Experiments ... 63
4.3. Rating System Selection ... 71
5. Conclusion (Discussion)... 73
5.1. Observations ... 73
5.2. Considerations ... 74
5.3. Reflections... 74
5.4. Looking Forward ... 75
5.4.1. System Development ... 75
5.4.2. System Ownership ... 77
5.4.3. Remuneration Options ... 77
x
Appendices ... 81
A. Project Specification ... 82
B. Timeline & Resources... 83
C. Guarded Hot Box Apparatus ... 84
D. Test Plan ... 86
Test Plan ... 86
Equipment & Personnel ... 86
Equipment ... 86
Personnel ... 86
Test 1 – Standard Test ... 87
Objective... 87
Task Run ... 87
Test 2 – Half Standard Test with Volume Change ... 88
Objective... 88
Task Run ... 88
Test 3 – Half Standard Test with RH Change ... 89
Objective... 89
Task Run ... 89
Test 4 – Standard Test with Design & Material Change ... 90
Objective... 90
Task Run ... 90
Test 5 – Half Standard Test with ATM Change ... 91
Objective... 91
Task Run ... 91
E. Risk Assessment & Management ... 92
Risk Assessment & Management ... 92
F. Work Permit ... 94
G. Induction Checklist ... 95
H. Standard Operating Procedure ... 96
I. ELG Logger Graphs ... 97
a. Test 2 ... 97
b. Test 3 ... 99
c. Test 4 ... 101
xi
xii
List of Equations
Equation 3.1 ... 18
Equation 3.2 ... 18
Equation 3.3 ... 18
Equation 3.4 ... 19
Equation 3.5 ... 20
Equation 3.6 ... 20
Equation 3.7 ... 27
Equation 3.8 ... 27
Equation 3.9 ... 28
Equation 3.10 ... 28
Equation 3.11 ... 28
Equation 3.12 ... 28
Equation 3.13 ... 28
Equation 3.14 ... 28
Equation 3.15 ... 29
Equation 3.16 ... 29
Equation 4.1 ... 37
Equation 4.2 ... 37
Equation 4.3 ... 37
Equation 4.4 ... 37
Equation 4.5 ... 40
Equation 4.6 ... 40
Equation 4.7 ... 43
Equation 4.8 ... 43
Equation 4.9 ... 44
Equation 4.10 ... 44
Equation 4.11 ... 44
Equation 4.12 ... 45
Equation 4.13 ... 46
Equation 4.14 ... 67
Equation 4.15 ... 67
Equation 4.16 ... 67
Equation 4.17 ... 67
Equation 4.18 ... 67
xiii
List of Figures
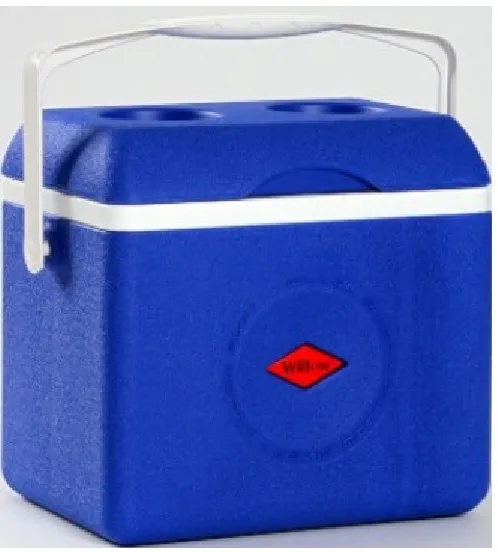
Figure 4.1 – The Willow Sixer cooler (image courtesy of Willow) ... 48
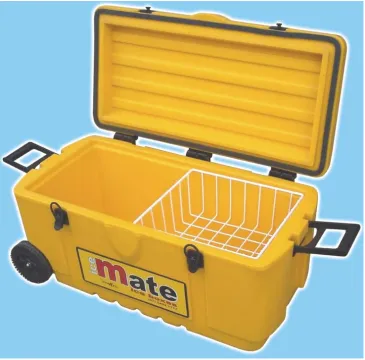
Figure 4.2 – The EvaKool IceMate ice box (image courtesy of EvaKool) ... 49
Figure 4.3 – The Outdoor Plus cooler bag... 50
Figure 4.4 – The data logger used for testing (image courtesy of Lascar) ... 52
Figure 4.5 – ELG graph of the logger from the vessel for Test 1 ... 57
Figure 4.6 – ELG graph of the logger from the cold room for Test 1 ... 57
Figure 4.7 – ELG graph of the logger from the oven for Test 1 ... 58
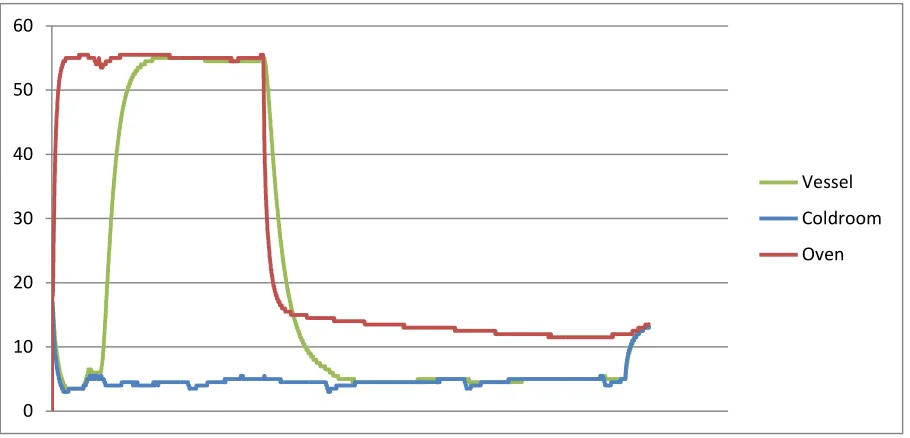
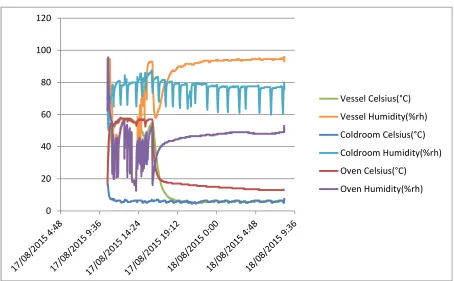
Figure 4.8 – Excel temperature graphs of the loggers for Test 1 showing both the heat ingress and egress processes ... 59
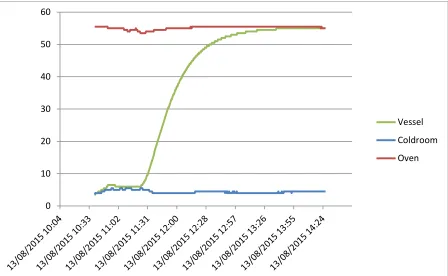
Figure 4.9 – Excel temperature graphs of the loggers for Test 1 showing the heat ingress with greater clarity ... 60
Figure 4.10 – Excel temperature graphs of the loggers for Test 1 showing the heat egress with greater clarity ... 60
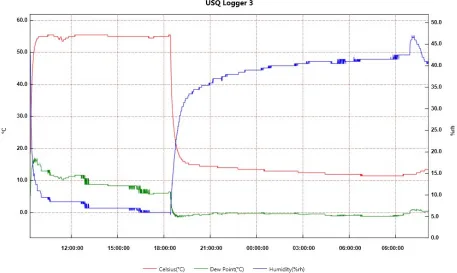
Figure 4.11 – Excel temperature graphs of the loggers for Test 3 showing the time taken to gain a maximum RH in the oven and vessel ... 62
Figure 4.12 – Excel temperature graphs of the loggers for Test 3 showing the heat egress with greater clarity ... 63
Figure C.1 – Schematic diagram of the operation of a guarded hot box apparatus... 84
Figure C.2 – A guarded hot box apparatus in use ... 85
Figure I.1 – ELG graph of the logger from the vessel for Test 2 ... 97
Figure I.2 – ELG graph of the logger from the cold room for Test 2 ... 98
Figure I.3 – ELG graph of the logger from the oven for Test 2 ... 98
Figure I.4 – ELG graph of the logger from the vessel for Test 3 ... 99
Figure I.5 – ELG graph of the logger from the cold room for Test 3 ... 100
Figure I.6 – ELG graph of the logger from the oven for Test 3 ... 100
Figure I.7 – ELG graph of the logger from the vessel for Test 4 ... 101
Figure I.8 – ELG graph of the logger from the cold room for Test 4 ... 102
Figure I.9 – ELG graph of the logger from the oven for Test 4 ... 102
Figure J.10 – Excel temperature graphs of the loggers for Test 2 showing the heat egress process . 103 Figure J.11 – Excel temperature graphs of the loggers for Test 2 showing the heat egress with greater clarity ... 104
Figure J.12 – Excel temperature graphs of the loggers for Test 4 showing both the heat ingress and egress processes ... 105
Figure J.13 – Excel temperature graphs of the loggers for Test 4 showing the heat ingress with greater clarity ... 106
xiv
List of Tables
Table 4.1 – Volume to Surface Area Ratio w.r.t. Shape ... 38
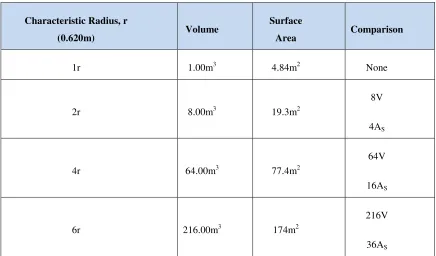
Table 4.2 – Volume to Surface Area Ratio w.r.t. Size ... 39
Table 4.3 – Interpolation for Specific Internal Energy ... 42
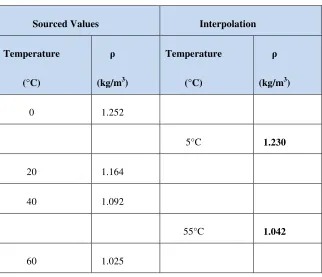
Table 4.4 – Interpolation for Density ... 43
Table 4.5 – Thermal Conductivity of Some Common Materials ... 45
Table 4.6 – Heat Transfer Rates and Timeframes ... 46
Table 4.7 – Test 1 Raw Data ... 64
Table 4.8 – Test 1 Outputs ... 65
Table 4.9 – Ratio of Test 1 Outputs... 65
Table 4.10 – Test 2 Raw Data ... 68
Table 4.11 – Test 3 Raw Data (See for %RH results) ... 68
Table 4.12 – Test 4 Raw Data ... 69
Table 4.13 – Test 2 Outputs ... 69
Table 4.14 – Test 3 Outputs ... 69
Table 4.15 – Test 4 Outputs ... 70
Table 4.16 – Test 1 Raw Data for %RH (heat egress only to match Test 3) ... 70
xv
Glossary of Terms
Term Definition
ATM Normally this notation means ‘atmosphere’ in
the context of the pressure of air in the
atmosphere, such as 1atm=101.325kPa.
However, in this document it is mostly used as shorthand to denote atmospheric pressure in general, as opposed to any other pressure, allowing for the fact that atmospheric pressure changes with elevation.
ISC Insulated Shipping Containers – these are
typically cardboard boxes lined with insulating material such as foam.
PCM Phase Change Material – any substance which
changes state with the addition or subtraction of heat, specifically with the aim of achieving a desired temperature, ice being the most obvious (and natural) example.
Product Any insulated vessel from the manufacturer’s
perspective
Stock Any contents in a vessel from the producer’s
xvi
Nomenclature
Symbol Definition
L (m) Length along a heat flow path, equivalent to
material thickness
r (m) Characteristic length of a shape with respect to
the unit volume. For a sphere it is the radius, while for a cube it is the side.
1
1.
Introduction
Esky is a brand name. It is so common in general Australian parlance that many may not know that. In New Zealand, they are known as chilly bins (possibly also a brand name), while other countries may refer to them as ice boxes, ice chests, coolers or other terms. These are portable, hard-cased, insulated vessels designed to keep food and drink cool by repelling heat ingress. There are drink specific ones, known as a Thermos (also a brand name) or soft versions known as cooler bags, and others designed to keep food hot, such as pizza pouches. There are even disposable vessels such as the foam boxes for fruit and vegetables, or the more specialised insulated shipping containers, used for transporting medicines and other temperature sensitive products.
1.1.
Selection Confusion
Whatever the name and whatever the use, selecting the correct one is not an easy task since no information about the thermal performance of each product on the market is provided by the manufacturers. Commercial consumers, who develop strong relationships with their suppliers will come to know the right product for their needs, but may sustain unnecessary expense leading to that arrangement. A retail consumer entering a shop with the intent of purchasing such a product could easily struggle to determine which one would meet their specific needs. Is it to be for camping, a picnic, or just bringing frozen foods home from the shops?
2
different criteria, one from another, which can prolong the consumer’s uncertainty about which product is most suitable for a given need.
So how can a consumer, commercial or retail, know for sure which product has the best thermal performance that suits their particular need? What is needed is an objective testing & rating system that allows any consumer to interpret the result to their specific needs.
1.2.
Project Aim
This project aims to create a universal, independent, transparent and repeatable testing & rating system for portable, insulated vessels that allows consumers to purchase the right product for each purpose with confidence. The outcome should be similar to the energy-efficiency ratings for refrigerators, the water-energy-efficiency ratings for showers or the fuel-efficiency ratings for cars. With rating labels on every product on display in any commercial or retail environment, any consumer can determine for themselves, based on their own individual interpretation of what the ratings mean to them, the right product they may need for any given situation they may encounter.
3
they can state ‘hand-on-heart’ that their products achieve a certain rating, while also being able to fast track R&D1 processes to fulfil market demand.
1.3.
Project Focus
The work in this project is divided into two distinct parts. Firstly, there is the scientific aspect which looks at the insulated vessels thermal efficiency and how this affects stock in the vessels. Secondly, there is the human aspect which looks at meeting the perceived understanding of the consumer to whom this system is targeted. From the scientific perspective, the testing system must look at both ingress and egress of heat, if the application is to extend to both hot and cold requirements. From the human perspective, the rating system must have a meaningful reading, such as the stars on refrigerators and showers.
1.4.
Limitations
It is important to state at this stage that the aim of this project in not to rate the quality of the products. This is only aiming to rate the thermal efficiency which will determine the products effectiveness in resisting temperature change over time. To this end, cooler bags used for keeping lunch or shopping cool for a few hours (or a pouch to keep pizza warm for a similar timeframe) will not require as high a rating to be considered a quality product for the task, while ice boxes that are used on fishing trips (keeping the prized catch cold for days) will require a much higher rating to be considered fit for purpose.
This system is also aimed only at passively cooled or heated vessels, not any actively controlled vessels such as fridges or ovens, and is only aimed at enclosed vessels, which excludes ‘stubbie’2 coolers for keeping single-serve drink bottles cold once opened, or any other similar open insulators.
1 R&D stands for Research and Development. 2
4
5
2.
Literature Review
The literature review for this project has been carried out through 4 key searching processes. Initial searches via the internet and databases failed to return any meaningful results. As a consequence of this, manufacturers were contacted for information on how they have carried out the tests for their performance claims, as well as any literature that they may have used. This allowed returning to the internet and database searches with more specific search terms. This lead to more fruitful information, which in turn allowed further research based on the references in some of those documents.
2.1.
Current Industry Practice
Three local manufacturers were contacted in order to ascertain current industry practices. The selection was relatively random, and no favour was placed on any manufacturers over any others. One of the three firms selected suggested contacting a fourth, which was done. The manufacturers contacted were Coleman – Esky, Evakool, Techniice and Waeco.
Each company was quick to share current practices over the phone, all of which showed similar thinking with variations on a theme. Emails were sent to each firm with questions regarding existing rating systems that they were aware of (either internal or from other sources, such as Choice Magazine), or the use of R-values for raw materials in product development, and any literature that may have been accessed, such as journal articles, papers standards or procedures. Each was also invited to share policy or procedure documents used for the testing of performance characteristics of their products.
6 2.1.1. Industry Tests & Ratings
In an email from Evakool (R Mendes 2015, pers. comm., 22 May) it was demonstrated that their current testing regime consists of using a control room at 32oC, in which a test specimen is placed. It is loaded fully with ice (not specified whether block ice or party ice – bags of ice cubes) and opened thrice daily (time open was not stated). The quantity of ice is observed daily and once no ice is observed the number of days is noted. The melted water was left in the vessel. The rating for this test was simply the number of days of keeping ice frozen.
Similarly, Waeco provided their procedure in an email (S Elliott 2015, pers.comm., 31 May). Waeco, who are better known for actively-refrigerated portable vessels, pointed out that they are relatively new to the market with passively-cooled vessels, and therefore developed their system based on the claims of the competition. They observed that their competitors were claiming numbers of days for keeping contents cold and set about doing the same. Their test consists of a control room at 30oC and the use of 6 blocks of 5kg ice as well as a 4kg bag of party ice. The lid is opened once daily for 1 minute and water is removed daily during the lid opening. In one example test of one of their models, they observed enough ice left for ‘effective use’ after 11 days, 1kg of ice left after 12 days, and no ice remaining on day 13. The published result was ‘10 days’, allowing a conservative experimental margin of error, however no scientific explanation was provided for this factor of safety.
2.1.2. Similar Industry Processes
7
sense in that industry, which means that borrowing from that industry would not lend itself well to this particular project, since the aim here is to have a rating for a complete product.
2.2.
Industry Observers
Choice Magazine has been a household name in Australia for quite some time, and was targeted in the initial searches for any testing of this range of products. One of the manufacturers contacted also suggested contacting Choice, which provided kudos for this rationale. Other reviews were also found, two of which are shared here.
Choice Magazine has actually been regularly reviewing ‘eskies’ for about 20 years (M Steen 2015, pers. comm., 26 May) using a test and rating that has satisfied their readers over time. In their most recent test (Steen 2014) a variety of products were put to the test for not only their thermal performance, but also their features, which was far more subjective. Their thermal testing consists of filling each vessel with bottles equivalent to 20% of the vessel volume (no details on the temperature or contents of the bottles was provided, but it is assumed that they had sensors inserted for the ensuing results) as well as ice also equivalent to 20% of the vessel volume (again no mention of the type, but assumed to be party ice to fit around the bottles) and placing them in a control room at 32oC (each specimen was preconditioned to this temperature). The temperature of the bottles was measured over time for ranges of 0oC-2oC and 2oC-8oC, but not enough detail was provided to determine whether the bottles were already at 0oC or had to initially cool to this temperature within the test (this would provide uncontrolled variables in the testing process which could skew the results). Each vessel was opened for a few seconds to ‘tamp down the ice’ but the frequency of this task is not defined. Each product was given a percentage score; however the method of determining this was not explained. The best performer achieved 95%, which leads to questions such as ‘was this based against the rest of the products tested, against some uncited benchmark, against manufacturers claims, or some other yard stick’.
8
have had fluctuations, however all samples were together so this should not have impacted significantly for the purposes of this analysis. The products in question were not given a rating as such, but were ranked in terms of which held the liquid at the highest temperature for the duration of an average 8 hour work day: An objective outcome, but nonetheless specific to one subjective perception of performance.
In a third review, again with insulated vessels, called coolers in this instance – as it was performed in the USA - a number of specimens were tested with boating needs in mind (Vance 2013). This review also looked at a number of factors, including the ratio of internal and external volumes; therefore the thermal performance was not necessarily the most important consideration. In this test, each vessel was filled to full with ice (not specified as to whether block, party or otherwise, however the article stated ‘slight crushing of ice’ when closing the lid which suggests party ice). They were then placed in the sun (the first test to hint at radiant heat and not just assume conductive or convective heat alone), and water was drained daily for one week, at the end of which the quantity of ice was calculated as a percentage of the original ice. The remaining ice percentage acted as the rating of thermal performance.
2.3.
Researchers Insights
Research was also carried out to determine what other researchers may have uncovered or developed over time. There was very limited material found, suggesting that (as far as this particular product type is concerned) little emphasis has been placed on thermal performance in the past. Given that until recent decades there has been little emphasis on thermal performance in other more significant industries, such as the built environment, this is a plausible deduction.
9
and humidity, there is little mention of the physical or thermal aspects of the test specimens. There is mention of the materials in a casual way – with more focus on the shape for convective air flow inside – but no mention of the thermal performance of each construction (as if this aspect was not a consideration in that era), other than one sample having a metal lined wood with a density conducive to resisting heat, but certainly no R-value or even an indication of W/m-K or similar parameter for any material combination.
At the other end of the spectrum, a Paper on insulated shipping containers (ISC) proved to be very useful for this analysis. In this particular study (Singh, Burgess & Singh 2008) there is a dedicated focus on determining the R-values of various package systems. This involved an ‘ice-melt’ test which preconditioned slabs of ice (by allowing a small amount of water to be produced to ensure a 0oC temperature of the ice) with which the actual test was carried out. Each shipping container was then left in a control room of 23oC such that air could contact the top and all sides of each specimen, containing a preconditioned ice slab within a bucket, which was taped up as per industry practice. These were left for 12 or 24 hours (ensuring a minimum of ice remained) after which the quantity of water was measured and divided by the timeframe to determine the ‘melt rate’. From this a system specific R-value was created for each sample. This is the first test that takes the specimen surface area into consideration, showing an understanding that variations in volume and surface area can skew the results if not taken into account in the tests.
It is important to note here that this study focused on the combination of a package type and an anticipated product thermal load, making it more industry specific than would be useful for this project. This paper even discussed how the commercial operator would calculate the quantity of ice required to adequately ship products without excursion from their desired temperature range during shipment. This would certainly not be adopted by domestic consumers who are more likely to guess their requirements than perform any computations.
2.4.
Regulators
10
The International Safe Transit Association has developed numerous procedures for a variety of issues for the container shipping industry, one of which (ISTA 2007) focuses particularly on the thermal performance of ISCs. Their test methodology is similar to the process outlined above for ISCs by researchers; however there is more focus on a specific product/package combination, as well as the actual trip taken by the parcel. The testing consists of a sequence of different temperatures over varying timeframes, with ramping up and down in some cases, intended to simulate generalised shipping lanes for their clients’ products. In more recent work (Cox 2012), they have greatly increased their research on temperature fluctuations of actual shipping lanes within the USA and developed software simulation models for determining the exact packaging requirements for any client’s product’s trip from door to door. The aim is to maintain the product within an acceptable temperature bandwidth (measured with sensors inside the packaging) for each given product throughout the sequence of test cycles. The rating in this instance is simply pass or fail.
The other testing process is one developed by the World Health Organisation (WHO) specifically for the transport of vaccines (and similar temperature-sensitive medical products, such as pathology samples) where refrigeration is not possible. Their methodology (World Health Organisation 2010) is quite similar to that defined for ISTA above, however their focus is on not exceeding a critical temperature, either up or down (depending on the requirements), within a minimum timeframe. The ratings of this test are known as ‘cold life’, ‘cool life’ and ‘warm life’, of which only the cold life rating must meet a minimum timeframe, suggesting that for the others the methodology is still in a developmental phase of its life.
2.5.
Applicability of Literature
There is a fair range of information within this literature review to prepare a suitable methodology and subsequent testing & rating system. There are strong and weak points about each of the processes outlined above.
11
use the vessels, however it is clear that ice comes in different forms and at different temperatures which would make comparisons very difficult. Since water holds much more heat than air (due to a much higher specific heat value) or certain food items, any test using large quantities of ice will favour larger vessels which have more ice to thaw. These tests also make broad assumptions about how the products will be used by all consumers, rather than being as objective as possible and allowing each consumer to interpret the ratings, tailored to their own usage patterns. Much the same can be said for the comparisons carried out by the 3rd party observers. There is also noticeable vagueness in the ratings, some of which are very subjective. The best is the percentage ice remaining, followed by the final temperature at the end of a work day, but others don’t necessarily reflect a result that can be easily repeated by any other tester/consumer.
On the other hand, the commercial systems are obviously applying science to achieve a commercially viable outcome, but for very specific applications. These tests and ratings are far more objective in their nature and apply more controls to ensure repeatable results; however they may not lend themselves to such a broad application as for this analysis, since each has been designed for a particular outcome. For example, the Paper on ISCs used only cube shaped boxes with the same insulation and cold packs, however coolers come in all different shapes and sizes and consumers will use a variety of cooling media from gel packs to dry ice, and will be needing to preserve a wide variety of food items for a number of different scenarios, so such a test may not cover all these combinations and permutations. Similarly, a rating which does not exceed a temperature within a timeframe is very precise for vaccines being transported in a predetermined way, but may be meaningless to a variety of consumers using the same product in different ways. Also, these systems are designed to ensure that a specific temperature sensitive product is preserved over the same repeated transit on a regular basis, which again does not reflect the random usage patterns of the average consumer using an esky for different activities at different times of year.
12
the sun in the back of a vehicle at nearly 60oC at one point and then sitting on the ground outside a tent at nearly 0oC during the night. Therefore testing to a set temperature or to a set of temperatures is not indicative of how a domestic consumer will use their cooler, even if it can be seen as appropriate for replicating the shipment of a commercial product in a predictable and repeatable process.
It is also worth pointing out that some tests involve opening the samples while others don’t. This is based on predicted usage patterns. For example a domestic consumer is likely to want to access stock from a vessel at various times, but an ISC will remain closed from the start to the finish of its transportation. Similarly, some tests use ice and gel packs or phase change materials (PCMs) while others have air gaps, or a combination. These practices are also intended to mimic usage patterns; however it is less likely to be precise for consumer applications than for known commercial applications.
The combination of air and water will greatly affect the temperature change patterns, so there must be care taken in determining such combination, which of course is again less likely to be precise domestically than commercially. This is even more important with the use of PCMs which are capable of maintaining a particular temperature for long periods of time, perfect for a known stock requirement. The same can be said of ice melting, which will maintain food at 0oC for longer than at other temperatures when the water is either solid or liquid, which could greatly skew any results as a function of the quantity of ice.
Extending from this point is the fact that one test left melted ice in the cooler, while the others drained the water: This will allow heat transfer in two different ways, which again can skew the results. The commercial ratings are also clearly based on a stock/product combination, and in some cases a stock/product/trip combination, while the domestic ratings are limited to assessing the product (insulated vessel) only, as the contents in real applications will not be what was tested.
13
14
3.
Methodology
The methodology for this project consists of firstly defining the specific range of products to be included in the analysis, followed by analysing current processes by manufacturers and other testing & rating bodies. There must be a review of heat transfer principles with an analysis of what is pertinent to this project. Next, a testing procedure can be developed. This can then be followed by mathematical analysis, using software, to determine approximate ranges of results, and then also by experimental testing, using laboratory equipment at the USQ Toowoomba campus. The experimental results must be analysed against the mathematical results to determine whether the testing process achieves the objectives of this project. Finally, a rating system can be devised to reflect the testing results in a meaningful way for the consumer.
3.1.
Target Products
As has been mentioned in the sections above, this analysis primarily aims at developing a system to meet consumer needs, but is not limited to just that sector of the market. The previous section has demonstrated that there are viable systems in place for the commercial market which appear to be limited to very specific circumstances such as the repetitive delivery of a specific product along the same transit path each time; however they do not appear to be universal for other applications. That does not mean that this system (being developed here) could not or would not be adopted by the manufacturers of ISCs.
15 3.1.1. Consumer Market Testing
The current testing regimen by the manufacturers tends to be based on simulation of consumer usage, with a rating of meeting a number of ‘days cold’, rather than assessing the thermal resistance of the unit as a whole and having a more objective rating. This is fraught with too many assumptions about what the consumer needs, which simply reflects the many varied usage patterns of so many different consumers.
There are also too many variations in the test procedures, such as keeping water in the vessel or removing it on a regular basis. This will greatly influence the results since the water in the vessel will act as a bridge for the heat path to the ice, where air would act as a barrier. Equally, the use of ice does not define the temperature of the ice to begin with, so additional time may be gained by using very cold ice and draining it regularly, compared with one of the commercial tests, which ensures the ice is at 0oC before commencing the process and retains the water for measuring the heat gain.
The risk with this for consumers is that they may naïvely assume that the claimed number of days cold is based on their own usage patterns rather than anyone else’s usage patterns, not stopping to think about the fact that different people use the product in different ways. This leads to consumer dissatisfaction and lack of consumer confidence for the manufacturers, who are actually trying to achieve the very opposite.
3.1.2. Commercial Market Testing
16
3.2.
The Science Within
Past assessments have focused more on temperature than heat; however heat is more important as it is the source which creates any resultant temperature. In particular the heat transfer from one side of the vessel walls to the other (due to a temperature differential across the wall, driving the heat transfer from hot to cold) is more important than the heat holding capacity of the volume of the vessel itself.
Therefore, the requirements for assessing thermal performance of an insulated vessel is about heat,but only as limited to the effects of heat passing through the vessel walls. In particular, this is about the rate of heat transfer (Watts, or Joules per second) rather than the quantity of heat being transferred (Joules), as that is limited to the volume of the vessel and the thermal properties of its contents, while the rate of transfer will impact directly on the success of maintaining an internal temperature within a desired bandwidth over a desired timeframe for the preservation of the vessel’s contents.
Fluid mechanics (such as any convective flows of air within or around the vessel), however, are not aspects of the science that need to be addressed in this analysis. These would be for any entity choosing to educate the consumer on how to maximise the use of their cooler. Such an objective is clearly beyond the scope of this analysis.
Likewise, the assessment of the different thermal properties of various materials should be kept within the realm of the manufacturer’s design processes, as the testing & rating system being proposed in this analysis is not attempting to define the best designs, but simply to rate what has been designed. This obviously extends to shape and size of each product.
3.3.
The Concept of Heat
17
function of the total usage patterns of these media by a consumer, so it is important to consider the limitations of this analysis.
A consumer would understandably be keen to know good practices for keeping food colder longer, such as allowing air flow around items, and draining water from the vessel regularly: One touches on convective heat, while the other touches on conductive heat (although heat through water is convective, the transfer of heat from the vessel wall to the ice, via the water, involves conduction, which is relevant to this project3). They may also be keen to know that leaving their esky in the sun is worse than having it in the shade, even though the air may have the same temperature in both places. This touches on radiative heat. Alas, all these are beyond the scope of this project, simply because the way that a consumer chooses to use their cooler is beyond the control of this testing & rating system.
Similarly, the analysis of heat transfer within the contents is beyond the scope of this project, because the aim here is not to prescribe to the consumer what they can and cannot transport in their cooler, but to allow them to learn to determine for themselves, based on experience using this system, which vessel will meet a particular need.
Another aspect of heat transfer is how it travels through the walls of the vessel. A Dewar flask has a vacuum between an inner and outer lining, while a budget model cooler might have an air gap between two layers of moulded plastic, and a premium ice box could be made of polyurethane. The considerations of radiant, convective and conductive heat in each application are different; however these are ultimately beyond the scope of this analysis since it is the prerogative of the manufacturer, based on a multitude of customer demands, to determine what construction materials are used.
3.3.1. Modes of Heat
All heat ultimately comes from the sun, with the possible exception of the heat rising to the earth’s crust from within: however since this is highly insulated (other than via volcanoes or geothermal applications, far removed from this analysis), it can be ignored and only the sun’s
3
18
heat will be considered. There are also other forms of heat, such as a fire or an electric heater, but they do ultimately get their energy from the sun, stored in wood or fossil fuels.
The heat from the sun is radiant, so this form of heat should be discussed first. As the sun’s heat reaches earth, it interacts with the earth’s atmosphere, which is gaseous (a fluid) and is the subject of convective heat, which will be discussed second. Finally, the radiant and convective heats, identified herein, come into contact with solids, such as the soil, plants & animals, humans, and humanity’s entire built environment, converting to conductive heat: Logically this will be discussed third.
Radiant heat flow can be estimated mathematically by
= − −
Equation 3.1
measured in Watts (W), based on the Stefan-Boltzmann law, using the Stefan-Boltzmann constant
= 5.67 × 10 ⁄ ∙
Equation 3.2
and ε is the emissivity of a grey body4, A is the surface area (more regularly referred to as As in this report) and is the surface temperature of the grey body in question, and is the surface temperature of the surrounding surface, such as a room’s extremities or the atmosphere, (Cengel & Boles 2007).
Convective heat flow can be estimated mathematically by
!"#$= ℎ!− &
Equation 3.3
using Newtons’ law of cooling, where & is the fluid temperature and hc is the convective heat transfer coefficient, which is far too complicated to calculate easily (as each instance
4
19
requires a variety of preliminary calculations which make each situation unique), and is not necessary to meet the scope of this project, but suffice to say that it ranges from 2-100,000 (Cengel & Boles 2007).
Conductive heat flow can be estimated mathematically by
!"# = −'(
) )*
Equation 3.4
as per Fourier’s law of heat conduction, where kt is the thermal conductivity and dT/dx is the temperature differential with respect to the thickness, x, of the conducting material, otherwise identified as L in this analysis (Cengel & Boles 2007).
According to The Principles of Heat Transfer (Kreith, Manglik & Bohn 2010) only conduction and radiation are heat transfer processes, suggesting that convection requires not just a temperature differential (like the other two) but also mechanical mass transport. This would be for a fluid, whether gas or liquid. This may be a consideration for PCMs as they change phase and convective flows start to occur within, however this analysis in not intending to cover the efficacy of such aids in the temperature control process. Another example that could look at convection is in the simpler coolers which have an air gap between the inner and outer shells. However, since this is a small, contained volume of fluid, which is only demonstrating mass transport perpendicular to the overall heat flow direction, it is not necessary to investigate this when ultimately it will be converted from conductive heat, to convective heat, and back to conductive heat through the walls of the vessel at the micro level, equating to one overall conductive heat transfer at the macro level.
Similarly, much work could be carried out for the effects of radiant heat transfer, however, as noted in Thermodynamics: An Engineering Approach (Cengel & Boles 2007), radiation that is incident on an opaque solid body (as hard and soft coolers invariably are) is only absorbed to within a few microns of the surface, after which it becomes conductive heat transfer (which is what makes the vessel surface hotter than the ambient air surrounding it).
20
overall heat transfer coefficient. This is most obvious in the equation for convective heat, by the use of the letter h with the subscript c; hc. In fact it could be defined as hconv, while for radiant heat it could be defined as hrad – although this requires some manipulation with respect to temperature, given the power of 4 in the equation and the Stefan-Boltzmann constant – and as hcond (sometimes written as hk5) for the conductive heat, which is mathematically equivalent to kt/L, where L is the thickness of the conductive material (as mentioned above), also referred to as the thermal conductance per unit area (Kreith, Manglik & Bohn 2010): The thermal conductance being defined as
= '( +⁄ ⁄ .
Equation 3.5
Alternatively, this can also be considered in terms of
, = 1 ⁄
Equation 3.6
being the mathematical reciprocal which looks at the thermal resistance of the vessel rather than its conductance; perhaps more pertinent for the understanding of the end user in this application when selecting an appropriate vessel for their needs.
The heat transfer coefficient, measured in W/m2-K, is heat flux (in W/m2) divided by the temperature (measured in K or oC), effectively making it the heat flow rate (in W) per unit area (in m2) per unit temperature (in seconds). All things being equal in our testing of each vessel (the surface area of the vessel, and the temperature differential of the test), this is the characteristic of each vessel which will determine its performance. Given that, in the case of the conductive heat transfer coefficient, hcond, it is governed by the thermal conductivity, kt, and the material thickness, L, both of which are entirely in the hands of the manufacturer to correctly select materials according to their thermal properties and correctly design the vessel body based on thermal requirements, as a function of other requirements driven by market demand.
5
21 3.3.2. Media for Heat
Consideration must be given to the medium through which heat is transferred. This is complex, since there is the outside environment through which heat is transferred, there are the vessel walls, through which heat is transferred, and then there is the stock within the vessel through which heat is also transferred.
Ultimately, it is all about the stock in the vessel. Each individual item has a preferential temperature at which it is best to be stored: Milk requires a different temperature from frozen meat, while a pizza heading towards an excited ‘footy’ fan has an entirely different ideal temperature altogether. All of these are outside the control of the manufacturer of the vessel (who cannot dictate to the consumer how to use the vessel), and therefore beyond the scope of this project (other than the ratings guiding manufacturers to improve their designs for better ratings).
What is within the scope of this project is the temperature change across the vessel walls, within the limitations of simply observing and reporting on the changes. Current industry testing tends to use ice, mimicking the most common current practice of the consumer. However, this may not be conducive to carrying out an accurate, repeatable, universal testing methodology. Testing needs to be objective, repeatable and universal, if it is to be acceptable, therefore the methodology must remove any subjective criteria which create ‘noise’6 in the testing regimen. Furthermore, testing should be quick and cheap in order to gain industry acceptance. No manufacturer is going to go through the arduous process of some horribly convoluted, expensive, uncertain testing regimen which then fails to instil any confidence in their customer base, therefore this analysis must aim to achieve a fast and cost-effective system which is accepted primarily by the consumer and then, by consequence, by the manufacturer.
If one looks at the contents of any insulated vessel there will always be a minimum amount of air in the mix, with the exception of a vessel with a convex internal lid profile which is filled to the brim with a liquid on a perfectly flat surface (with respect to gravity, where a liquid is concerned). Therefore, any fully conclusive scientific analysis of a vessel with a variety of stock must consider the properties of each constituent, which includes the air in between
6
22
everything. Effectively, the air makes up the balance of the volume regardless of the contents, and therefore must always be part of any heat transfer consideration, whether simply through the walls – as in this project – or within the confined space (as every keen camper or fisher may want to discover in order to prolong their pleasure).
Looking at air as a testing medium, one can quickly find some simple comparisons with the ice/water combination. Firstly, air holds far less heat than water; whether the water is liquid or solid: This means that the temperature change will be faster in air. Secondly, in the temperature range that most consumers are likely to use there insulated vessels, the ice/water combination will go through a phase change: This means that during that phase change there will be no change in temperature, and is the key attraction to modern phase change materials (PCMs) designed to change phase at a particular desired temperature. This is a good thing for the consumer; however it adds time to any test for the testing laboratory. The test is not meant to replicate applications in real life, but to provide an idea of efficiency for any application in real life: This can be done with a test which is different from real life situations, but provides the understanding required for interpretation and application to a real life scenario (which will be interpreted differently for each consumer – this is the crux of this project; to develop a universal testing regimen which can be interpreted by all users to their own benefit!).
If the temperature change of air is faster than that of an ice/water mixture then the results must happen faster, which leads to a cheaper testing process in the laboratory. Equally, if there is no phase change in the testing process, then the heat transfer is truly a function of temperature differential at any value, making all tests comparable, regardless of the temperature range or the contents or PCMs used, effectively isolating such variables from an objective universal and repeatable testing regimen.
23
3.4.
Testing Processes
Traditionally, there are two main approaches that can be employed in any research project of this nature. Firstly, there is always some form of mathematical analysis, starting from simple sums and calculations to complex numerical modelling approaches employing such concepts as Finite Difference Method (FDM), Finite Element Method (FEM) – also known as Finite Element Analysis (FEA) – or Boundary Element Method (BEM), as examples. All of which have their strengths and weaknesses, depending on what needs to be achieved. Similarly, there is also the experimental approach, which can range from a simple laboratory confirmation of the numerical analysis, to more complex empirical processes, in the field, which actually drive the scientific and engineering understanding of the nature of life on earth which surrounds us. Both of these processes are discussed below.
3.4.1. Mathematical Analysis
Mathematical analysis involves making calculations that predict a desired outcome. If done correctly, this may also identify errors, anomalies and even derivations from our current understanding.
Given the complex shapes and the variety of materials of insulated vessels, one could easily start to think that some incredibly complex software program would be required to carry out a viable analysis of these products, involving one of the numerical methods listed above. This might be of interest to a manufacturer who wants to know exactly where in their product the heat is passing through so that they can improve the design, but for the intent of this project such complex analysis is not necessary. Counter-intuitive to this initial thinking, the best option is to simply carry out some quick sums in any simple software, such as Microsoft Excel (or similar open software program) or even with a calculator and a notepad.
24
Such a mathematical analysis process has been developed in MS7 Excel, which is expanded upon in Section 4 below.
3.4.2. Experimental Testing
Experimental testing involves actual replication of a real-life situation, or at least a simulation which is as close as possible to the real situation. Again, if done correctly, may identify errors, anomalies and even derivations from our current understanding.
Herein lies the most important part of this whole project. The point of this research is to develop a testing methodology which can be replicated anywhere at any time by any accredited organisation, so it makes sense to carry out such a testing regimen as part of the experimental testing for this project. The purpose of carrying out experimental testing is to determine whether such a testing regimen actually works or not. The aim, here, is to determine exactly what such an effective testing process is.
Testing for the thermal performance of raw materials (either individually or in composition) already exists. A common test is the hot plate test, which is a simpler version of the guarded hot box test used in the construction industry for determining R-values of building fabric constructions (Sugo, Page & Inglis 2007a). Such testing consists of placing a sheet of the material in question between two environments of dissimilar temperature and measuring the heat exchange across the material. This is acceptable for any homogeneous material that is effectively 1-dimensional (1D), meaning that the heat transfer is in one direction through its thickness and the area does not impose any impact on the result, since the output will be measured in W/m2-K.
This is not initially a suitable option for a vessel which is intrinsically a 3D object, through which heat will transfer in all 3 dimensions, and has non uniform thickness or density throughout its surfaces: i.e. we are looking at heat transfer in or out of the object, not just through a sample of the walls of the vessel in isolation, and we are also looking at that heat transfer through variable thicknesses, densities and materials (as these vessels are often made of more than one material in their construction), rather than a homogeneous thickness of one
7
25
individual material or a consistent composition of materials. However, with a little lateral thinking this testing methodology can be adapted to achieve a similar outcome in a 3D application.
The guarded hot box tests require two chambers from which the heat is transferred through the medium in real time, with the chambers butted up to each other. If we look at the possibility of storing the heat in the medium, momentarily, and transferring it from one chamber to the other (the chambers may not be butted up together, to avoid excessive insulation between them, but should be in close proximity to each other to reduce the transfer time to a minimum), then the same assessment could be achieved. Effectively, the proposed testing regimen in this analysis is a 3D equivalent of the hot box test, and it is not too dissimilar from the testing carried out by ISTA and WHO (as outlined earlier).
In brief, this project attempts to determine whether it is possible to create a universal rating system for all insulated vessels with this one simple test.
The test involves the use of two chambers at dissimilar (but stable) temperatures. A test specimen is placed in one chamber and allowed to equalise its internal temperature with the chamber (this can be accelerated with the vessel open). At this time, the specimen should be transferred swiftly to the other chamber, preferably via an intermediary space with thermal properties lying between those of both chambers (i.e. the temperature, relative humidity or air pressure are not outliers for the test, but are all between the high and low equivalents in each chamber) to mitigate any ‘noise’ in the data such that the transfer happens faster than any heat exchange could happen across the vessel wall.
The test should then be repeated in reverse order as a double check and to determine whether there is any difference between heat ingress and heat egress as a function of the design (such as a weakness in the lid/body interface) because heat in a natural convective flow tends to move upwards, although in many cases this may not be a detrimental issue (however cooler bags with zippers at the top may prove to need this double test, as an example).
26
industry, but in line with the current commercial industry. Although not analogous to how the consumer uses the product, it avoids further ‘noise’ in the data collection.
The primary sensors required are temperature sensors. These are ideally cordless and capable of transmitting feedback to a computer which can track real-time changes for more accurate results in this analysis, for determining the best commercially viable test regimen for this industry.
Equally, relative humidity (RH), φ, and atmospheric pressure (ATM) should also be controlled. If the RH in one chamber is vastly different from the other, then the water vapour present in one chamber will impact the heat transfer one way or the other, depending on the chamber in which it is present. Equally, if the air pressure is different from one chamber to the other (due to different fan pressures), then again the results could be skewed. Either of these possibilities is far less likely than the difference between one test (on one product in one laboratory at one time of year) compared with another test (of another product in another laboratory at another time of year), especially where altitude is involved. This is where the importance of universal testing comes to light.
To a lesser degree, but still important, is the need to ensure that the chambers operate at consistent temperatures, RH and ATM. This is attested in the hot box testing protocol which requires an internal control box and an outer supply box8, although in this particular testing methodology the stability of these parameters is less critical. This can be mitigated by the use of chambers with modern HVAC systems which operate with VSD (variable speed drive) mechanisms and inverter technology to reduce hysteresis for small variations in the identified parameters.
A final consideration, only within the context of this project, is the age of any specimen used for the experimental tests. The ideal would be to use brand new products, however if any specimen is used that has been in service, there is a possibility that damage or degradation may reduce its performance and skew the results. This however should not be an issue for this project, as the aim here is not to test every current product and rate them all, but to
8
It is left to the reader to find the freely available information on the internet regarding the basic
27
establish a possible testing & rating methodology, therefore any sample that has seen service will not be representative of that product, but simply an example for this analysis.
3.5.
Testing Procedure
In order to be certain of the best testing procedure, there must be a discussion of the variables that can be measured. Given that the materials, shape and size are all determined by the manufacturer, the remaining variables are the ratio of volume to surface area (V:As), the temperature differential (ΔT)and the time elapsed (Δt).
3.5.1. Volume & Surface Area
Thermal energy is a function of both the volume of a vessel and its surface area. The volume can store only so much thermal energy, based on the thermal properties of its stock (air, water/ice, food, etc.) while the volume boundary can transfer that quantity of thermal energy, but only at a rate determined by the thermal properties of the material in question. Therefore, the stored thermal energy of the volume governs the timeframe of the heat transfer, as a function of the temperature differential, ΔT and the heat transfer coefficient, k/L (hcond), and the surface area of the volume.
Volume and surface area are related in some geometric shapes. In such cases, surface area is the derivative of the volume with respect to their shared characteristic length. For example, a sphere has a volume,
- =4 301
2
Equation 3.7
and a surface area,
= 401.
28
Differentiating the volume with respect to the radius gives
)-)1 = 3 × 4 301
Equation 3.9
reducing to
)-)1 = 401
Equation 3.10
which is the surface area. Similarly, a cube, with a side, s, and a half-side, a, has a volume
- = 32 = 252 = 852
Equation 3.11
and a surface area
= 625 = 245.
Equation 3.12
Differentiating the volume with respect to the half side, a, gives
)-)1 = 3 × 85
Equation 3.13
reducing to
)-)1 = 245
29
which is the surface area, again. Likewise, the same could be done with an open cylinder of length, l, as
- = 017
Equation 3.15
And
= 2017.
Equation 3.16
However this relationship is only valid for certain shapes. If one tried the same with an enclosed (or solid) cylinder, for example, the two end circles must be added which would change the relationship.
However a more important relationship exists between volume and surface area. There is a ratio between them which is different for different shapes. It is well known that a sphere has the smallest surface area for a unit volume, while a cube will have a smaller surface area than a cuboid of the same volume. Therefore, applying this to the shape of our insulated vessels, it would be best to have a spherical shape, but this would be impractical. Coolers tend to be of cuboidal shape; even cooler bags are inclined to be cuboidal rather than cubic, cylindrical or spherical. This obviously will impact the thermal efficiency of the vessel.
More important than the impact of the shape is the impact of the size. If the characteristic length, r, of the sphere above is doubled the volume would then be 8 times larger (23) but the surface area would only be 4 times larger (22). Therefore the ratio of the volume to the surface area gets larger as the size increases, which means the quantity of heat stored increases more than the surface area through which it can pass. This unfairly favours larger vessels while smaller vessels suffer greater heat loss or gain.
30
would appear to perform worse. This would favour the manufacturers of smaller vessels but it would actually give the consumer a false belief that a smaller vessel actually performs like a larger one when this is not true. This would only lead to eventual lack of confidence in the system, therefore such an approach must be quite intentionally avoided in order to provide consumers with an understanding that larger vessels tend to perform better than smaller ones. The manufacturers are then left to find the balance between providing the thermal performance demanded by the consumer and the practicality of size and shape also demanded. This may ultimately prove to drive manufacturers to tweak the ratio of the dimensions of the shape to improve performance rather than to just increase size, although it may also ultimately drive consumers to purchase larger vessels as they will provide better performance for the money spent.
That said, the effects of volume impacting on performance can be offset by the manufacturers by adjusting the vessel wall thickness to compensate, which would have to be done as a function of the penalty of product mass and physical footprint for the effective storage capacity, something which was rated by Boating Magazine in their assessment of various products (Vance 2013).
3.5.2. Temperature Versus Time
After all is said and done (and this project has attempted to do just that), there are just 2 parameters that can be considered for a meaningful assessment of the thermal performance of insulated vessels: These are the internal temperature change, as a result of heat transfer across the vessel walls, and the timeframe over which this happens; These are known as ΔT, and Δt, respectively.
Since these are the only parameters left, it is mathematically clear to pick either one arbitrarily and carry out a test. However if there is a very large insulated vessel with an incredibly resistant construction it may take a very long time to achieve a rating for a set temperature differential, if time is the variable, which would make for an inefficient, albeit accurate assessment: After all, ‘time is money’ as they say.
31
questioned. This is far less likely than the first scenario for obvious commercial reasons (poor products create poor sales), however poor products exist in all industries, so such an outcome should not be considered impossible.
It now becomes important to consider mathematical analysis. The results achieved analytically will greatly determine whether temperature or time should be the variable. Section 4 below expands on this as the core of this analysis is developed.
3.6.
Rating Procedure
Testing is of little use unless the results are used in some way. In this case, the results of any test are used to compare with other results of other tests, which is the tool for rating each vessel. This is the process of rating the tested specimens.
3.6.1. Human Interpretation
Each different person has their own views in life, and this will influence everything one does. Each person developing a testing & rating system will be influenced by their world view as to what makes a good test. This can be seen in the variety of tests that already exist, and it is the reason why this particular analysis is looking to develop a system that is as objective as possible in order to remove such differences.
Equally, each person selecting a rated product will interpret the testing & rating system based on their world views. This is actually useful in this analysis since the results are as objective as possible: It leaves the consumer with the freedom to have their own perspective of what the results mean to them, as opposed to what they might mean to the next person.
3.6.2. Shifting the Interpretative Function
32
view their products, and should not be expected to do so, and should not attempt it as it has more chance of failure than success. Consumers, however, know how they think and are not concerned about other c