City, University of London Institutional Repository
Citation
:
Strigini, L., Povyakalo, A. A. and Alberdi, E. (2003). Human-machine diversity in the use of computerised advisory systems: a case study. Paper presented at theInternational Conference on Dependable Systems and Networks (DSN'03), 22 - 25 Jun 2003, San Francisco, California.
This is the unspecified version of the paper.
This version of the publication may differ from the final published
version.
Permanent repository link:
http://openaccess.city.ac.uk/280/Link to published version
:
Copyright and reuse:
City Research Online aims to make research
outputs of City, University of London available to a wider audience.
Copyright and Moral Rights remain with the author(s) and/or copyright
holders. URLs from City Research Online may be freely distributed and
linked to.
City Research Online: http://openaccess.city.ac.uk/ [email protected]
systems: a case study
Lorenzo Strigini, Andrey Povyakalo, Eugenio Alberdi
Centre for Software Reliability, City University Northampton Square
London EC1V 0HB, U.K.
Telephone: +44 20 7040 8245, Fax: +44 20 70408585 {Strigini, Andrey, Eugenio}@csr.city.ac.uk
Version: 0.6c, 7 December 2002
Abstract
Computer-based advisory systems form with their users composite, human-machine systems. Redundancy and diversity between the human and the machine are often important for the dependability of such systems. We describe a case study on assessing failure probabilities for the analysis of X-ray films for detecting cancer, performed by a person assisted by a computer-based tool. Differently from most approaches to human reliability assessment, we focus on the effects of failure diversity – or correlation – between humans and machines. We illustrate some of the modelling and prediction problems, especially those caused by the presence of the human component. We show two alternative models, with their pros and cons, and illustrate, via numerical examples and analytically, some interesting and non-intuitive answers to questions about reliability assessment and design choices for human-computer systems.
Copyright of the authors, 2002
1
Introduction
Most computer systems are used as part of larger human-machine systems. Aircraft are controlled by pilots in combination with multiple computer systems; patients are cured by doctors using diagnostic and advisory computer systems; bank tellers are assisted by computers; and so on. The success of an aircraft flight, a patient’s treatment or a bank transaction thus hinges on the dependability of a composite, human-machine system. To assess or to reduce the risk of these activities, one needs to study the dependability of such composite systems. There is now an established (and yet controversial) body of techniques for assessing human reliability, and another body of techniques for computer dependability. Yet our grasp of the dependability of systems including the two is still unsatisfactory. We report some work now under way within a U.K.-funded interdisciplinary project, DIRC (the Interdisciplinary Research Collaboration on the Dependability of computer-based systems) which is addressing some of the open problems.
We focus on an interesting broad category of human-machine systems: those in which a single human uses a computer to support his/her decisions. We discuss a case study about dependability assessment for a system of this kind.
An important aspect in the dependability of human-machine systems is the fault tolerance provided bydiverse redundancy in the co-operation between machines and their human users. For instance, in our chosen category – single-user advisory systems – both the human and the machine can perform a large part of each other’s tasks, and form, in this sense, a redundant system, of which the human and the machine are subsystems. In normal operation, the human and the machine often perform different subtasks (e.g., the machine is used for searching information in databases, and the human user thus does not need to search manually through paper literature): their co-operation improves the performance that could be obtained from the human alone. However, if one of the two subsystems fails to perform properly, the redundancy between them is brought to bear. Both the human and the machine subsystems usually have some ability to detect errors of the other, and to recover from some such errors (not necessarily the same subset) if detected. E.g., when the machine’s database search function appears not to work, the human can obtain the required information by reading literature.
Our case study concerns “computer-aided detection” in the interpretation of X-ray films, used in screening programmes for detecting breast cancer. Interpreting these X-ray images is a specialistic, difficult tasks, and computerised aids have been developed to help with it. Our interest in the problem arose in relation to clinical trials being conducted for a specific model of computer aid [2], but what we report here is related to general issues with this application area, and advisory systems in general, rather than to a particular product.
about, e.g., adopting a specific computer aid require extrapolating from the effects observed in the trial to an educated guess about the effects in the field. An advantage of “clear box” reliability modelling is precisely the ability to predict dependability measures for a future or hypothetical system, or an existing system when used under different circumstances; one can compare alternative system designs, which in this case may include changes to the design of the machine, the choice or training of users and/or the procedures of use. In the case of a human-machine system, one must also consider that the detailed understanding of each component and its failure processes belongs to practitioners of different disciplines, like engineers and psychologists. Explicit system dependability modelling is meant to help in connecting together these various, partial views and understanding their system-level implications.
In view of the redundancy and diversity present in a human-machine system, we apply a modelling approach which we have found useful in analyzing issues of diversity and common-mode failure in redundant systems [5]: we use a coarse-grained subdivision of the system into components, plus analysis of component dependabilityconditional on classes of demands, and how its variation generates correlation between their failures.
In the next section, we outline the background of this study: the use of computer-aided detec-tion in breast screening and the way we are going to study it in terms of redundancy and diversity. Section 3 considers a reliability model for this system, derived directly from its intended mode of operation, and concludes that it is unsuitable; Section 4 proposes an alternative, less usual model. Sections 5 and 6 deal, respectively via examples and analytically, with using the latter model to predict the probability of failure of the system in new circumstances, and the effects of design improvements. A Conclusions section follows.
2
Background
2.1 Computer aids for mammography
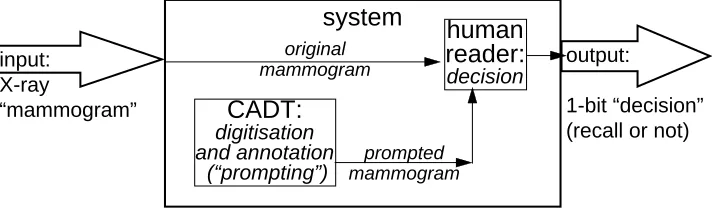
The human-machine system we consider – Fig 1 – involves a human expert (“reader”) using a computerised aid in screening “mammograms” (X-ray films) for signs of cancer. The function of the system is to decide whether the patient should be “recalled” for further tests because there is suspicion of cancer, or instead informed that no problem was found. The computerised aid used (CADT henceforth, for “computer-aided detection tool”) processes a digitised version of the X-ray film, applying pattern recognition algorithms to recognize and highlight (with conventional marks – “prompts” – on the image) those features in the picture that the reader should examine. The design goal for the CADT is to aid the reader to notice all the features in a mammogram that ought to be examined as potential indications of cancer. The task of producing a “recall/no recall” decision is seen as having two components – detecting relevant features, and classifying them as representing probable cancers or not – and it is in the “detection” component that pattern-matching algorithms are expected to help the human reader, compensating e.g. for lapses of attention.
The reader receives (on film and/or on a screen) the original X-ray images plus copies with the “prompts” added by the CADT.
There are two ways that the reader’s decision can be wrong: a “false negative” decision, in which a patient with cancer is not recalled, and a “false positive” one, in which a healthy patient is recalled. Decisions about how to organise the screening have to take into account the probabilities of both kinds of undesired outcome, and seek a reasonable trade-off between their frequencies.
system
input: X-ray
“mammogram”
output:
1-bit “decision” (recall or not)
CADT:
digitisation and annotation
(“prompting”)
human
reader:
decision
original mammogram
[image:5.612.125.481.69.173.2]prompted mammogram
Figure 1: Role of a computer-assisted detection tool (CADT) in decisions on breast X-rays. The system that produces decisions has two components, the CADT and its user, the reader.
have varied, though several have shown this kind of computer aids to improve the probability of cancers being detected.
2.2 Redundancy and diversity
The function of the CADT is to detect and highlight those features that a reader should examine in a mammogram, even when the reader alone does not notice them. In this sense, the CADT provides fault tolerance within the system.
There are two possible components in the advantage given by the CADT (or by a second reader, as in current practice in the U.K.). The first is simple redundancy, i.e. the advantage of repeating a task that is known to be subject to random errors: the chance of a feature escaping detection twice is lower than that of escaping it once. The second advantage is “diversity”, related to the fact that errors have asystematic component as well: each human reader, and each pattern recognition algorithm, will be more likely to make mistakes on certain cases than on others. An algorithm (a CADT) which were especially good at detecting those cancers that are most difficult for readers to detect could be very useful, even if it were much less good on most other cancers.
Practitioners are aware of these issues, at an informal level, but we want to make it possible to discuss them in a more formal, mathematical way: informal reasoning may miss important aspects of the problem, both in assessing dependability and in deciding on design options. For instance, we would hope to help to identify any circumstances in which a designer should aim to increase the failure diversity between a machine and its human users, even at the cost of decreasing the effectiveness of the machine if considered in isolation from its users.
2.3 Terminology and modelling approach for the redundant system
Human Detects
Detects Machine
[image:6.612.94.324.68.157.2]Human Classifies
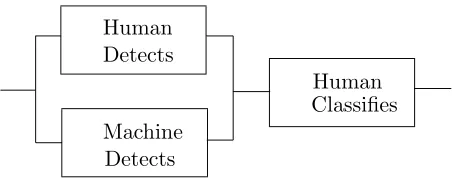
Figure 2: Reliability Block Diagram (RBD) for the “parallel detection” model of computer-assisted detection.
write “failure” this can only mean a false negative.
Our system – Fig 1 – has two subsystems: the CADT and the human reader. The reader’s decision is the output of the whole system: reader failures and system failures coincide. Likewise, the CADT may have false negative failures (not highlighting the film features that indicate a cancer), or false positive ones (highlighting features in films of patients who do not have cancer).
This system is somewhat unusual for reliability engineers, in two ways:
• the failure probabilities that we will be discussing are somewhat high. The probabilities of (false negative) failure of readers in this decision task may be well over 10%;
• failures may not be due to any physical fault, or to anything that we would normally call a design or implementation flaw in the CADT. A CADT “failure” may be just the effect of unavoidable limitations of pattern-matching algorithms; or it might be due to a coding error in producing the software, and our model would not make any distinction between the two cases. Likewise, a reader’s “failure” in this terminology is any wrong decision, even if it may be the best decision feasible under the circumstances (e.g. if the mammogram’s appearance is misleading).
3
A dependability model based on the intended procedure of use
of the CADT
The CADT and the reader can be co-ordinated in at least two ways:
1. the reader examines the films alone, then considers the output of the machine –based on the same films–, and then the reader reviews his/her judgement. Ideally, whenever the CADT highlights a feature in the films, the readers will examine it with the same attention and skill as the features that they noticed themselves.
2. the machine processes the films first, and then the reader processes together both the original evidence and the machine’s “annotations” on it.
mammogram that the CADT has not prompted. Users are emphatically informed of this and dis-couraged from using the CADT as a diagnostic system, and the message is reinforced by presenting the CADT’s output on low-resolution copies of the mammograms.
With this procedure, we can separately consider the two parts of the decision-producing activ-ity: detecting important features in the films, for which the reader is helped by the CADT, and classifying them.
Any feature that the reader should examine in the classification part of the task is actually examined, provided that either the reader or the CADT “notices” it. In the subtask of detecting features, there is 1-out-of-2, parallel redundancy between the reader and the CADT. Proper clas-sification, instead, depends on the reader alone: if the reader misclassifies the important features, the system fails. Figure 2 depicts this “parallel detection” scenario. It can be read as showing the flow of information, from left to right, through the functions of the system components, but also as a reliability block diagram: the system does not fail on a case iff there is at least one path joining the points at the left-hand and right-hand ends of the diagram without encountering a component that fails on that case.
Mathematically, we can describe the probability of a false negative as follows. Given a case, randomly chosen from the subset of people, within the population to be screened, who have cancer, we wish to describe the probability of a [false] negative decision. We write:
P(false negative failure of the system) =
P(M f ANDHmiss) +P(NOT(M f ANDHmiss)ANDHmisclass) (1)
Where M f,Hmiss, Hmisclassdesignate these events:
• M f (“machine fails”): “false negative” failure of the CADT: the CADT does not prompt any feature[s] in the mammogram that would indicate cancer;
• Hmiss(“human misses”): “false negative” failure of the reader in the detection task, defined in the same way as for the CADT;
• Hmisclas(“human misclassifies”): “false negative” failure of the reader in the classification task: the reader takes the wrong decision on a case although the relevant features have been identified for his/her analysis.
The probabilities of these events can, in principle, be estimated from results of evaluation trials. However, there are some complications. This model would be very convenient if:
1. we could estimate the parameters of the various blocks separately, even when not connected in the system (e.g., from the abundant data on readers’ performance without the CADT), as we would expect to do with a hardware reliability model;
2. we could assume independence between the failures of the various blocks, so that we could write:
P(false negative failure of the system) =
✲ ✲ ✲
Features Input
case
Machine Human
Decision Highlights
[image:8.612.150.463.89.152.2]on the case Decides
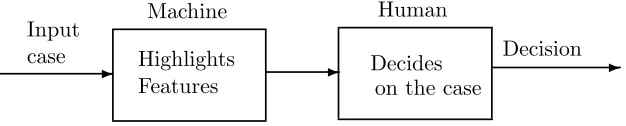
Figure 3: System structure and information flow in the sequential case
About point (2), we do not expect this independence to hold. It is true that the reader and the CADT perform the detection step separately, but this only implies that the probability of the reader detecting the relevant features in a mammogram depends on the mammogram itself but not on the CADT’s reaction to it. Given this “conditional independence”, the probability of failure of the detection part of the task could be written as [5]):
P(detectionf ailure) =PMf·PHmiss+cov(PMf, PHmiss). (3)
where the termPMf·PHmissis the probability of detection failure if the CADT and the reader
failed independently. The new termcov(PMf, PHmiss) is the covariance between the probabilities of failure of the CADT and the readerconditional on each specific case. If and only if this term is 0, detection failures by the CADT and the reader are indeed independent. High covariance would indicate that cases on which the reader is likely to miss the important features are those on which the CADT is also likely to miss them: the advantage given by the CADT is then less than if it failed with the same probability PMf, but independently of the reader’s failures. If negative, it indicates the opposite, i.e. that there is useful “diversity” between the two. It is not cleara priori how feasible it would be to estimate the covariance term.
Another problem with this model is that the two steps “Human detects” and “Human classifies” are not physically separate. That is, readers may not be consciously performing two different, separate steps. We do not know how to identify the information that is the output of the first step and input to the second. So, there are serious difficulties in evaluating the parameters P(Hmiss) and P(Hmisclas).
Last, but not least, we cannot be assured that the procedure followed actually guarantees even conditional independence between failures of the three blocks in Fig. 2. E.g., can we assume that the reader’s classification of a feature in the mammogram is the same independently of whether it was detected by the reader him/herself or by the CADT, or both? If we cannot, i.e. readers violate, at least unconsciously, our simplifying assumptions, this model is no longer attractive.
All these doubts imply that it may be desirable to design the procedures of use with the explicit goal of satisfying the assumptions that would make this model practical. However, without evidence that they are indeed satisfied we need a more general model.
4
A less restrictive model: “Sequential” operation
valid. Procedure 2) on p. 4, with the reader examining at the same time the mammogram and the CADT’s output, seems faster and a better use of the machine’s support to save human labour, at the cost of the CADT’s output possibly biasing the reader. It also seems to be the procedure assumed in some evaluation trials of mammogram-reading aids. In practice, in clinical trials or actual practice, the readers can be asked to use the “parallel detection” procedure, but there are not necessarily constraints or “affordances” in the experimental or clinical set-up to ensure that they would not use the other one, perhaps unconsciously.
This scenario is best described by the simple diagram in Figure 3. The reader receives infor-mation that has been pre-processed by the CADT. We no longer assume that we can identify two separate phases in the reader’s activity, nor that any part of the reader’s task is unaffected by the CADT’s output. Fig. 3, differently from Fig. 2, cannot be interpred as a reliability block diagram.
We name the events of interest:
• M f (“machine fails”): “false negative” failure of the CADT, defined as before;
• Hf (“human fails”): “false negative” failure of the reader and thus system failure: “no recall” decision for a patient with cancer;
• M s=M m: “machine succeeds”, i.e. the negation of “machine fails”.
Then,
P(false negative failure of the system) =P(human fails) ,
and to represent the effect of the CADT on the human’s results, we rewrite this in terms of the conditional probabilities of human failure, given that the CADT fails or that it succeeds:
P(Hf) =P(Hf|M s)·P(M s) +P(Hf|M f)·P(M f) (4)
If it happened that P(Hf|M s) =P(Hf|M f), the success or failure of the reader would be – on average – independent of whether the CADT succeeds or fails.
This model is less restrictive than the “Parallel detection” one: there are no assumptions constraining how the behaviour of the CADT affects the reader. By varying the values of the model’s parameters, any conceivable form of this influence of the CADT can be represented.
As a next step, we must take into account the fact that the failure probabilities of both machine algorithms and readers vary with the characteristics of their inputs: some cases are more difficult than others. We describe this variation by additional parameters – the probabilities of the various events, conditional on each possible input case. To emphasise that each such conditional probability is a function of the input case, we indicate them as functions. For instance, with reference to the “sequential operation” model just described:
• pMf(x) designates the probability of false negative failure of the CADT on a specific casex;
• pHf|Ms(x) - designates the probability of false negative failure of the reader on a specific case
x for which the CADT succeeded (highlighted all features relevant for a decision).
Mathematically, the meanings of these parameters are, e.g.:
pMf(x) =P(M f|the given case is x) = P(M f AND the given case isx)
P(the given case isx)
and
pHf|Ms(x) =P(Hf|M s AND the given case is x) = P(Hf AND M s AND the given case is x)
P(M s AND the given case is x)
(6)
These conditional probabilities can be said to characterise how difficult a case is, for a certain task performed on it. E.g.,pMf(x)> pMf(y) indicates that case xis such that the CADT is more
likely to fail on it than on case y. The difficulty for the CADT may be due to design choices, perhaps required to reduce false positive failures for some class of cases, or to design mistakes (bugs in the software), or to unavoidable limits of image-processing algorithms. A case that is more difficult than another for the CADT may or may not be more difficult for the readers as well. The probability of false negative failures at the system level depends on how the “difficulty” of cases for the CADT correlates with their “difficulty” for the readers, and, crucially, how likely the various cases are. To represent this latter aspect, we define the demand profile:
p(x) =P(the input case given to the system is casex)
The probability of system failure on a randomly chosen case is then:
PHf =
x
p(x)·[PHf|Ms(x)PMs(x) +PHf|Mf(x)PMf(x)] (7)
We do not show the similar development for the “Parallel detection” case, which leads to equation (3) for the detection task.
The model as described has three parameters for each possible case that may be presented to the system. Since each case is in some respect different from all others, it is infeasible to estimate these parameters. What can be done is to estimate the failure probabilities for classes of similar demands. So, in a controlled trial of the system, we would first subdivide the cases into classes. Equation 7 is still valid, if we interpret each xas representing a whole class of demands:
PHf =
x∈{classes of cases}
p(x)·[PHf|Ms(x)PMs(x) +PHf|Mf(x)PMf(x)] (8)
For each class of cases, we need to estimate the parameters PHf|Ms(x), PMs(x), PHf|Mf(x).
We would think that two demands belong to the same class if they are equivalent under all respects that significantly affect the difficulty of dealing with them correctly, both for the reader and for the CADT algorithms. I.e., the two demands are practically indistinguishable from the viewpoint of the failure probabilities they produce: all the demands in the same class have similar values of pMf(x), pHf|Mf(x), and pHf|Ms(x)1. In practice, we would try to classify the cases according to
various characteristics that are easy to identify and produce a feasibly small number of classes.
1Identical values ofp
Mf(x),pHf|Mf(x), andpHf|Ms(x) for allxin a class are a sufficient condition for one to be
5
Extrapolation from controlled trials to results in the field
In deciding about the adoption of the CADT in a new environment, or on possible design changes to the CADT or its use, it will be necessary to rely on measurements taken under different conditions from those for which the prediction is sought. For instance, the measurements may be taken in a controlled trial, which may by necessity be run under different conditions (especially, different demand profile) than those of actual clinical use. Equation (8):
PHf =
x∈{classes of cases}
p(x)·[PHf|Ms(x)PMs(x) +PHf|Mf(x)PMf(x)]
is the key to this kind of extrapolation.
Changes in the conditions of use of the CADT or its characteristics can be represented by changing the values of parameters in this equation. Consider first thedirect effects of such changes in the conditions of use, for instance:
1. the frequencies of different kinds of cases may be different. Provided that a useful classi-fication of the cases into classes is found, such that equation 8 is a suitable description of the probability of wrong decision, these changes would be represented by changes of the parameters p(x) (one for each category x) in the equation;
2. the readers have varying levels of ability (represented by the parameters PHf|Ms(x) and
PHf|Mf(x)). The trial data can indicate the range of these abilities, show whether there are strong discrepancies between humans, and if these affect different categories of demands differently (as is believed to be the case);
3. the behaviour of the readers, and thus PHf|Ms(x) and PHf|Mf(x), will evolve over time as
they learn more about the behaviour of the CADT, e.g., becoming more complacent about relying on its prompts, or more skilled in detecting its failures;
4. the probabilities of success or failure of the CADT,PMs(x) andPMf(x) = 1−PMs(x), may
change due e.g. to maintenance practices, systematic differences in film characteristics, better detection algorithms, different tuning of the detection algorithms (which may be decided as a consequence of measuring their performance), and so on.
There may be indirect effects as well. For instance, a large enough change in the prevalence of cancers (or of different categories of cancers) in the population of cases (item 1 in the list above), may change the readers’ failure probabilities, PHf|Ms(x) and PHf|Mf(x). To guess the range of
magnitude of the changes, we would need to rely on measurements of similar effects on human behaviours in similar tasks. The equation will show the corresponding ranges of uncertainty in the predicted probability of system failure. Another example is that changing the frequency of failures of the CADT, PMf, may affect the tendency of readers to depend on its outputs more
or less in formulating their own decisions, thus indirectly changing PHf|Ms(x) and PHf|Mf(x) as
well. Pertinent literature from research on cognition and HCI can inform conjectures about these changes.
that there are essentially just two categories of cases, which we have labelled here as “easy” and “difficult”. An experimenter has run a trial on the human-machine system and obtained the estimates shown in the table below for the model parameters. We assume for the sake of simplicity that narrow enough confidence intervals can be obtained for all parameters.
classes of cases Demand profiles Model parameters
Trial Field PMf PMs PHf|Mf PHf|Ms
easy 0.8 0.9 0.07 0.93 0.18 0.14
difficult 0.2 0.1 0.41 0.59 0.9 0.4
The two categories of cases are represented in proportions of 80% “easy” and 20% “difficult”. Suppose that the actual proportions in the field are 90% vs 10%. Clearly, to predict failure probabilities in the field one will need to adjust for this different “demand profile“.
The next table shows the difference between the dependability that will be observed in the field and that in the trial. So far, we do not need our complete model which identifies the roles of the machine and the human in system failure: all that we are doing is using, in the bottom line, weighted sums of the probabilities of system failures for the two categories of cases.
Probability of system failure easy cases 0.143 difficult cases 0.605
Trial Field all cases 0.235 0.189
Suppose now that designers wish to improve the CADT, reducing its probability of false neg-ative failure. They would want to predict the effects of this improvement on the dependability of the human-machine system, and to decide where they should concentrate efforts towards improve-ment. Apart from cost constraints, for pattern detection problems it is often possible to reduce greatly (for either a human or an automated algorithm) the probability of false negative failures if one is willing to accept a corresponding increase in false positive failures. However, the latter may make the CADT useless. Our hypothetical designers consider two alternative improvements to the CADT: a reduction by 10 of the failure probabilityPMf for the “easy” (and frequent) cases, or a similar reduction limited to the “difficult” (and rarer) cases. The following table gives the results of applying equation (8) to these scenarios, both for the “Trial” and for the “Field” profiles:
Probability of system failure
CADT improved for easy cases CADT improved for difficult cases
easy cases 0.140 0.143
difficult cases 0.605 0.421
Trial Field Trial Field
all cases 0.233 0.187 0.198 0.171
much more often, this improvement does not greatly affect the reader’s performance on those cases. Instead, the differencePHf|Mf−PHf|Msis larger for the “difficult” cases, and accordingly reducing
the CADT’s failure probability for these cases yields greater improvement in overall probability of failure (0.171 vs 0.189, for the “Field” profile; 0.198vs 0.235, for the “Trial” profile).
This example illustrate some properties of this model, which we discuss in the next section.
6
An analysis of human-machine interaction
6.1 Importance index
If we definet(x) =PHf/Mf(x)−PHf/Ms(x), we can rewrite equation (8) as
PHf =
x
p(x)·[PHf|Ms(x)PMs(x) +PHf|Mf(x)PMf(x)] =
x
p(x)·[PHf|Ms(x)·(1−PMf(x)) +PHf|Mf(x)PMf(x)] =
x
p(x)·[PHf|Ms(x) +PMf(x)·t(x)]
(9)
This says that the probability of reader failure (false negative decision) is given by the proba-bility of him/her failing given correct output by the CADT, plus the probaproba-bility of the CADTnot giving correct output (failing), multiplied by a termt(x).
The term t(x) seems a useful general measure of how much the decision support offered by an automated system affects a human user’s success or failure. t(x) is an “importance index” (of the CADT for the whole system) [1], or a “coherence index” (of the reader’s behaviour with the CADT’s advice). E.g., if t(x) = 1, then (since probabilities can only have values between 0 and 1) PHf/Mf(x) = 1 and PHf/Ms(x) = 0, i.e., the reader’s decision is correct (with probability 1) if
and only if the CADT’s output is.
One may think that t(x) measures how much the rate of success of humans without CADT help would be increased by the support of a (perfectly reliable) CADT. This is not necessarily true, because we have no evidence that a human given wrong advice by the CADT would perform just as well (or as badly) as without any advice. For instance, suppose that readers come to mistrust the CADT and disregard its output completely. Then,t(x) = 0 for every case. Yet, the readers’ failure probability may be just as without the CADT, or it may differ, e.g. because the CADT is a distracting factor.
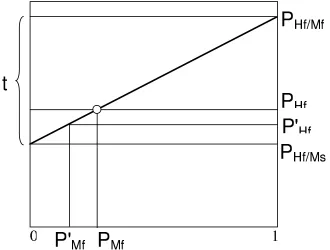
Fig. 4 shows the implications of equation (9), for a given value of t(x): the y axis is the probability of (false negative) system failure as a function of the probability of failure of the CADT (horizontal axis). The term t is represented by the slope of the line. The line shows how much better or worse we could make the system if we modified the CADT, changing PMf
(uniformly for all classes of cases), without changing PHf|Ms and PHf|Mf, i.e. the way the reader
reacts (statistically) to failures and successes of the CADT.
In particular, equation 9 and Fig. 4 show that, for given PHf|Mf and PHf|Ms, there is a lower
bound for the probability of system failure: this is PHf|Ms, represented by the point on the left
Figure 4: Role of the factor t(x): probability of system failure as a function of the probability of machine failure for a class of cases, given that the importance index tis known and fixed (the reader’s reactions to the CADT’s failures/successes do not change).
Of course, we should expect this figure only to be a good guide given small changes of PMf,
as t may not remain constant as the CADT is changed: for instance, readers might react to a perceived better dependability of the CADT by unconsciously becoming less attentive. This is one of the possible “indirect” effects discussed in the previous section. However, false negative failures of the CADT are very rare: PMf is small by design (at the cost of relatively frequent false positive failures), and cancers are rare in the screened population. So, readers may not usually see enough of them to be able to notice a reduction in their rate and adapt their own behaviour accordingly. Then, the effect of improving the CADT on system failure probability could be read on a graph as in Fig. 4, once this had been produced by measuring PMf(x) andt(x) in field usage.
6.2 Effects of varying difficulty of cases: role of covariance
We can rewrite equation (9) as
PHf =
x
p(x)·(PHf/Ms(x) +PMf(x)·t(x)) =
E[PHf/Ms(x)] +E[PMf(x)]·E[t(x)]+
+covx(PMf(x), t(x)) =
E[PHf/Ms(x)] +PMf ·E[t(x)] +covx(PMf(x), t(x))
(10)
The “covariance” term highlights the importance of how the two measures, PMf(x) and t(x), vary among cases. Knowing both the average probability of failure of the CADT and the average effect of the CADT’s failure on the reader is not enough to determine the probability of system failure, because of the additional termcovx(PMf(x), t(x)) in the equation. Rather, if those cases on which the CADT is more likely to fail (highPMf(x)) tend to be those for which the reader is more
of false negative will be worse than the means would make us expect; and vice versa. For the designer of the CADT, this means that improving the CADT’s failure probabilityon average over all kinds of cases may not be very useful. It may be more useful to concentrate any improvements on cases for which readers have a high t(x) (and that are somewhat frequent).
We should note here a problem with identifying classes of cases with a high “importance index” t(x) from experimental data. A hight(x) for a classxof cases may mean that it is a homogeneous class of cases that are difficult for the readers’ “detection” task, a difficulty that is greatly alleviated by a correct output from the CADT. However, it might also mean that the class contains “easier” cases on which both the CADT and the reader tend to succeed, and “more difficult” ones on which they both tend to fail. It would be better then to regard t(x) as just a “coherence index”. It may be that within either subclass the reader is not affected at all by whether the CADT’s output is correct or erroneous. Only a more detailed analysis of the data (possibly requiring more extensive trials, and possibly infeasible) could answer this question. This is a common problem in statistical inference.
7
Conclusions
We have explored clear-box reliability modelling for an important class of human-machine systems – humans using a computer in an advisory role – modelled as fault-tolerant systems.
The main practical advantages in this specific case is some help in extrapolating from measures taken in a controlled trial to predictions of results in the field in an orderly way. We have also shown some insights that the modelling offers into otherwise confusing complexities of the human-machine system. E.g., in section 6.1, the limits on how much one can improve the system by only improving the CADT; in section 6.2, the non-intuitive indication of how to choose classes of cases to target for incremental improvements of the CADT.
From the viewpoint of dependability modelling in general, we have outlined some modelling problems specific to human-machine systems, an alternative description approach to that of most “human reliability assessment” methods, and some useful insights, as just described.
There are two kinds of observations that seem important:
• with failure probabilities for the two components that vary heavily between classes of cases, it is essential in modelling to use detailed probabilities of component failureconditionalon types of demand, rather than marginal probabilities, and to avoid any unwarranted assumption of independence between components. This is a problem that also affects all reliability models for systems without humans [5], [4];
• while models of the kind presented will predict the effects of small changes in the system or its environment of use, larger changes may affect the dependability of the human components. That is, changes in parameters likePMf may affect parameters likePHf|Mf. Some may argue
that this makes these clear-box models useless, and only extensive empirical trials in realistic conditions should be used to assess these human-machine systems. We observe instead that such empirical trials may be infeasible, but the clear box model allows an analyst to take account of any existing knowledge about how people’s reliability may change depending on the characteristics of the machines they use and the demands they face.
from other disciplines to forecast the effects of CADT reliability on user behaviour (for instance, literature about “automation bias” [7]).
Of more general interest, in and beyond the medical application area, will be the study of trade-offs between the probabilities of false positive and false negative failures, a very common problem. We would attempt to describe, for instance, how alternative settings (compromises between false negative and false positive rates) of the CADT would affect the whole system’s false negative and false positive rates.
We are also considering looking at more complex systems that include advisory computer products. We have so far only modelled the behaviour of the simple system composed of a single human user assisted by a machine. But more complex combinations have also been considered for use of the CADT, to improve the cost-effectiveness of screening programmes; e.g. with two readers assisted by a CADT, or less qualified readers assisted by CADTs. By modelling these alternatives, we expect to explore modelling problems that are relevant to wider classes of advisory systems.
In conclusion, this style of modelling appears promising for the broad category of systems, “humans using advisory systems”, of which computer-aided screening is an example. There is nothing especially new in applying the engineering style of reliability modelling to systems including humans and machines, but we believe that our focus on diversity aspects is novel and important. In particular, it helps to avoid major pitfalls of reliability modelling – unjustified independence assumptions and unwarranted predictions based on average parameter values – and to clarify which improvements to either the computer or human parts of the system will produce tangible improvements for the system as a whole. This is just the first case study of its kind that we know of. In addition to any conclusions we obtain about the case study itself, we expect it to generate knowledge of more general interest, in terms of models, lessons learned about how to abstract the interaction between humans and machines, and data collection problems.
Acknowledgments
This work was supported in part by the U.K. Engineering and Physical Sciences Research Council via the Interdisciplinary Collaboration on the Dependability of computer based systems, “DIRC”. Many DIRC members contributed useful discussion, and especially Mark Hartswood, Rob Procter, Mark Rouncefield, as did Paul Taylor and Jo Champness, from UCL. David Martin, Andrew Monk and Peter Ryan provided helpful comments on a previous version of this paper.
References
[1] Z.W. Birnbaum, “On the importance of different components in a multicomponent system”, in P.R. Krishnaiah (ed.), Multivariate Analysis-II, Academic Press, New York, 1969.
[2] Champness, J., Taylor, P. and Given-Wilson, R. (in press). “Impact of computer-placed prompts on sensitivity and specificity with different groups of mammographic film readers”, in H-O. Peitgen (ed.). Proc. of the 6th International Workshopon Digital mammography, Springer-Verlag, 2002.
[4] B. Littlewood, “The impact of diversity upon common mode failures”, Reliability Engineering and System Safety, vol 51, 1996, pp. 101-113.
[5] B. Littlewood, P. Popov and L. Strigini, “Modelling software design diversity - a review”, ACM Computing Surveys, vol. 33, no. 2, June 2001, pp. 177-208.
[6] Sittek H, Perlet C, Helmberger R et al., “Computer-assisted analysis of mammograms in routine clinical diagnosis”, Radiologe, vol.38, 1998, pp. 848-52.
[7] L.J. Skitka, K.L. Mosier and M. Burdick, “Does automation bias decision-making?”, Interna-tional Journal of Human-Computer Studies, vol. 51, no. 5, 1999, pp. 991-1006.