City, University of London Institutional Repository
Citation
:
Carmona, M. L. R. (2006). Variability of chromatic sensitivity: fundamental studies and clinical applications. (Unpublished Doctoral thesis, City University London)This is the submitted version of the paper.
This version of the publication may differ from the final published
version.
Permanent repository link:
http://openaccess.city.ac.uk/12058/Link to published version
:
Copyright and reuse:
City Research Online aims to make research
outputs of City, University of London available to a wider audience.
Copyright and Moral Rights remain with the author(s) and/or copyright
holders. URLs from City Research Online may be freely distributed and
linked to.
City Research Online: http://openaccess.city.ac.uk/ [email protected]
AND CLINICAL APPLICATIONS
Maria Luisa Rodriguez Carmona
Doctor of Philosophy
City University
Henry Wellcome Laboratories for Vision Sciences
Department of Optometry and Visual Science
List of figures ... 7
List of tables ... 13
Acknowledgements ... 15
Declaration ... 17
Abstract ... 19
1 Introduction ... 21
1.1 Overview ... 22
1.2 Thesis syrlopsis ... 26
1.3 1.3.1 1.3.2 1.3.2.1 1.3.2.2 1.3.3 1.3.3.1 1.3.3.2 1.4 1.4.1 1.4.2 1.5 1.5.1 1.5.2 1.5.3 1.5.4 1.6 1.6.1 1.6.2 1.6.2.1 1.6.2.2 1.6.2.3 1.6.2.4 Anatomy and physiology of colour pathways ... 28
The eye ... 28
The retina ... 30
Photoreceptors ... 32
Post-receptoral retinal pathways ... 35
Visual processing beyond the retina ... 39
The lateral geniculate nucleus ... 40
The visual cortex ... 42
Colour vision models ... 46
Cone spectral sensitivities: evidence for trichromacy theory ... 47
Opponent mechanisms ... 50
Colour measurement and specification ... 53
The CIE standard colorimetric observer ... 53
Standard illuminants ... 57
CIE chromaticity diagrams ... 58
Chromatic discrimination ... 63
Individual differences in colour vision ... 69
Variation in 'normal' colour vision ... 69
Congenital colour vision defects ... 72
Incidence of pro tan and deutan defects ... 74
Incidence oftritan defects ... 75
Phenotypes of congenital colour vision deficiencies ... 76
2.2 Clinical and occupational colour vision tests ... 88 2.2.1 2.2.2 2.2.2.1 2.2.2.2 2.2.3 2.2.3.1 2.2.3.2 2.2.3.3 2.2.4 2.2.5 2.2.5.1 Test Battery ... 88
Plate tests ... 89
Ishihara pseudoisochromatic plates ... 90
American Optical - Hardy, Rand and Rittler test ... 92
Hue discrimination or arrangement tests ... 93
The Famsworth-Munsell 100 hue test.. ... 93
The Famsworth-Munsell D-15 test ... 94
The City University test (2nd Edition) ... 96
Lantern tests ... 97
Anomaloscopes ... 99
N agel anomaloscope ... 99
2.3 Evaluation of colour vision tests ... 102
2.3.1 2.3.1.1 2.3.1.2 . 2.3.1.3 2.3.1.4 2.3.2 2.3.2.1 2.3.2.2 2.3.2.3 Material and methods ... 103
Subjects ... 103
Administration of table based colour vision tests ... 104
Setting the norm and calibration of the Nagel anomaloscope ... 106
Statistical analysis ... 112
Results ... 114
Efficiency of principal colour vision tests ... 114
Pass/fail comparison ... 119
Performance comparison against the Nagel anomaloscope ... 120
2.4 Discussion ... 122
2.5 Conclusions ... 126
3 The CAD test: A New Approach to Colour Assessment and Diagnosis of Colour Deficiency ... 127
3.1 Introduction ... 128
3.2 3.2.1
3.2.2
3.2.3
3.2.4
3.2.4.1
3.2.4.2
3.2.53.2.6
3.2.7 3.2.8 Methods ... 130Spatio-temporalluminance noise ... 130
Effectiveness of the luminance contrast technique ... 132
Equipment ... 136
Definition of stimulus parameters ... 140
Effect of stimulus size ... 140
Effect of background luminance ... 142
Staircase method ... 144
Procedure of testing ... 145
CRT monitor calibration ... 148
3.4 Discussion and conclusions ... 159
4 Towards Establishing Limits of 'Normal' Chromatic Sensitivity in Human Vision ... 161
4.1 4.2 4.2.1 4.2.2 4.3 4.3.1 4.3.2 4.3.2.1 4.3.2 4.3.3.1 4.3.3.2 4.3.3.3 4.3.3.4 4.4 4.5 Introduction ... 162
Methods and Subjects ... 163
Subjects ... 164
Statistical analysis ... 165
Results ... 166
Study of variability within normal trichromats ... : ... 166
Validation of the CAD test against the Nagel anomaloscope ... 175
CAD test versus Nagel anomaloscope ... 177
Comparison of the CAD test against other colour vision tests ... 183
Ishihara test ... 183
AO-HRR test ... 185
D15 and CV tests ... 187
Overall agreements with the Nagel anomaloscope ... 189
Discussion ... 192
Conclusions ... 195
5 Colour Vision Assessment in Subjects with Unusual Anomaloscope Matches - a Molecular Genetics Insight into Colour Deficiency ...••.. 197
5.1 Introduction ... 198
5.2 Methods and Subjects ... 205
5.3 Results ... 210
5.4 Discussion ... 218
5.5 Further investigations ... 219
5.6 Conclusions ... 220
6 Chromatic Sensitivity and Macular Pigment Density in Human Vision ... 223
6.2.4
6.3 6.3.1 6.3.2 6.3.3
6.4
6.5
Data analysis and statistics ... 235
Results ... 235
Measurement of the spatial distribution of MP ... 235
MP group comparison ... 237
Chromatic sensitivity versus MPOD ... 240
Discussion ... 244
Conclusions ... 247
7 Summary and Conclusions ... 251
7.1 Concluding remarks ... 256
Appendices ... 261
Appendix A. Ishihara pseudoisochromatic plates ... 261
Appendix B. AO-HRR plates ... ; ... 263
Appendix C. Mathematical definition of the parameters used in the analysis of colour vision tests ... 264
Appendix D. Misreadings ... 266
Appendix E. Statistical analysis for MP OD levels in the fovea and periphery for all groups ... 267
Appendix F. 3D scatter plots of the Nagel anomaloscope matching parameters . ... 269
List of figures
Figure 1.1: Electromagnetic spectrum ... 23
Figure 1.2: A schematic representation based on the Munsell system ... 24
Figure 1.3: Cross section of a human eye ... 28
Figure 1.4: Schematic diagram of a tranverse section through the retina showing the different nerve cells and their interconnections ... 31
Figure 1.5: Main structural features of a typical rod and cone ... 33
Figure 1.6: Cone mosaic of the rod-free inner fovea of an adult retina ... 35
Figure 1.7: Types of retinal ganglion cell receptive field ... 38
Figure 1.8: Pathway of nerve signals from the retina to the striate cortex in the brain ... 40
Figure 1.9: Structural organisation of the striate cortex, showing blobs and orientation columns ... 43
Figure 1.10: Schematic drawing of concentric 'double-opponent' receptive field cells in the primary visual cortex ... 45
Figure 1.11: Stockman and Sharpe,(2000) cone fundamentals ... 49
Figure 1.12: Results of the hue cancellation experiment (Hurvich and Jameson 1955) ... 51
Figure 1.13: Simple opponent-colour model of normal human colour vision ... 52
Figure 1.14: Colour matching functions of the CIE 1931 standard colorimetric observer, for the ROB system (A), and the XYZ system (B) ... 54
Figure 1.15: The spectralluminous efficiency curves established by the CIE as the standard photometric observer: V'(A.) for scotopic vision, and V(A.) for photopic vision ... 56
Figure 1.16: The CIE colour matching functions for the 1964 supplementary standard colorimetric observer superimposed on the 1931 standard colorimetric observer ... 57
Figure 1.17: The CIE chromaticity diagrams for the XYZ systems of (A) the CIE 1931 and (B) the CIE 1964 standard colorimetric observers ... 59
Figure 1.18: The derivation on the 1931 CIE-x,y chromaticity diagram of dominant wavelength, complementary wavelength and excitation purity. Plot of the CIE standard sources A, B, C and D65 ... 62
chromaticity space. (B) Illustration of ellipse parameters ... 66 Figure 1.22: MacAdam's ellipses plotted in 1931 CIE-x,y chromaticity space
showing chromatic discrimination based on the dispersion of a series of colour matches ... 67 Figure 1.23: The approximately unifonn CIE u', v' chromaticity diagram with a
selection of the lines (just noticeable differences) of Fig. 1.20 ... 68 Figure 1.24: The average optical density spectrum of the lens absorption of a 20
year old, and that of a 70 year old ... 70 Figure 1.25: Absorption spectrum of the macular pigment. ... 71 Figure 1.26: Schematic of the X-linked recessive inheritance for deutan and
protan defects ... 74 Figure 1.27: Schematic of autosomal dominant inheritance (tritan defects) ... 76 Figure 1.28 : Average luminous efficiency functions for protanopes, deuteranopes
and tritanopes ... 78 Figure 1.29: Dichromatic lines of constant chromaticity or hue for (A) protanopes, (B) deuteranopes, and (C) tritanopes, plotted on the nonnal trichromat's 1931 CIE-x,y chromaticity diagram ... 80 Figure 2.1: Ishihara pseudochromatic plates showing: (A) 'transfonnation design', (B) 'vanishing design' and (C) 'protanldeutan classification' ... 91 Figure 2.2: The American - Optical Hardy, Rand, Rittler pseudosichromatic plate
test. ... 93 Figure 2.3: (A) Farnsworth D15 test showing a typical sequence ordered bya
protanomalous observer. (B) Results plotted on the results fonn showing typical results for a nonnal, protan, deutan and tritan observers ... 95 Figure 2.4: Photograph of the City University test illuminated with the Macbeth
easel1amp ... 97 Figure 2.5: Photograph of the Holmes-Wright lantern used in aviation ... 98 Figure 2.6: (A) Photograph of the Nagel anomaloscope. (B) Illustration of the
Nagel anomaloscope split field ... 100 Figure 2.7: Schematic of the type of colour matches for protan and deutan colour
vision deficient observers obtained on a N agel anomaloscope ... 102 Figure 2.8: Age frequency distribution of subjects tested in this study ... 104 Figure 2.9: Matching ranges and midpoints for 231 subjects measured on the
Nagel anomaloscope. Data for deuteranopes, extreme deuteranomalous, simple deuteranomalous, nonnal, simple protanomalous, extreme
protanomalous and protanopes ... 107 Figure 2.10: Distribution of the midpoint values of the red-green mixture range
Figure 2.12: Scatter plot of matching midpoints versus red-green discrimination index (RGQ for all observers ... 110 Figure 2.13: Comparison of the number of errors on the Ishihara plate test versus
RGI for protan and deutan colour vision deficient subjects ... 120 Figure 2.14: Comparison of the number of errors on the AO-HRR plate test versus RGI for protan and deutan subjects ... 121 Figure 3.1: Diagram showing luminance profiles for individual frames of spatial
random luminance modulation (RLM) for the stimulus array (15 by 15 checks) ... 131 Figure 3.2: An example of dynamic luminance contrast noise ... 132 Figure 3.3: The effect ofRLM amplitude on thresholds for detection of an
achromatic stimulus pattern in the fovea ... 133 Figure 3.4: The effect of LC noise amplitude on thresholds for the detection of
chromatic stimuli. Chromatic detection thresholds for the red-green (RG) and yellow-blue (YB) channels are plotted. (A) Data for a normal trichromat. (B) Data for a deuteranopic observer ... 134 Figure 3.5: Chromatic threshold contours for a deuteranopic observer are shown
on the CIE-x,y chromaticity chart for different RLM noise amplitudes ... 135 Figure 3.6: Photograph of experiment set-up and response button box ... 137 Figure 3.7: Schematic of the stimulus used to measure chromatic thresholds
showing a square array of 15 x 15 checks, subtending 3.3°. The test target subtends 0.8° and is defined having 21 coloured checks in a 5 x 5 square array ... 137 Figure 3.8: A schematic representation of some of the sequence of frames used in
the stimulus ... 139 Figure 3.9: Foveal RG and YB chromatic thresholds measured for different target
sizes for 5 observers ... 141 Figure 3.10: Foveal R, G, Y and B chromatic thresholds measured for different
background luminance levels plotted on a log scale for 5 observers ... 143 Figure 3.11: Schematic of the rapid dichromatism test ... 146 Figure 3.12: (A) Relative intensity output for the red (R), green (G) and blue (B)
phosphors of the CRT display. (B) Luminance versus gun voltage calibration for the R, G and B phosphors ... 150 Figure 3.13: Example of the region x,y-chromaticity space that can be reproduced
chart for four deutan observers ranging in severity of colour vision loss ... 155 Figure 3.17: Results for 78 mild colour deficient observers tested on both the
CAD test and the Nagel anomaloscope ... 157 Figure 3.18: Scatter diagram showing the correlation between two measurements
of chromatic thresholds perfonned on the CAD test for 33 observers ... 158 Figure 3.19: Plot of the percentage error in a measurement for RG and YB
threshold of chromatic sensitivity ... 158 Figure 4.1: Age distribution of subjects from a random population sample that
particiapted in this study ... 165 Figure 4.2: A scatter diagram of measured RG versus YB thresholds for 245
observers, including 128 male and 117 female ... 167 Figure 4.3: Plot of RG and YB thresholds for the random population sample
shown in Fig. 4.2 including colour deficient subjects making a total of 450 obset"V'ers ... 168 Figure 4.4: Frequency distributions of the following chromatic thresholds: (A)
YB, (B) RG and (C) ratio YBIRG, obtained in 237 observers with 'nonnal' trichromatic vision. (D) shows the two directions in 1931 CIE-x,y space used to compute both the YB and RG chromatic thresholds ... 170 Figure 4.5: Histograms showing the different distributions in RG thresholds
classified into male and female ... 171 Figure 4.6: Data showing the 97.5 and 2.5% statistical limits that define the
"standard" nonnal CAD test observer ... 173 Figure 4.7: Effect of age on YB and RG chromatic thresholds ... 174 Figure 4.8: Plot ofRG and YB thresholds in CAD nonnal units for the remaining
colour vision deficient subjects in Fig. 4.3 ... 175 Figure 4.9: Plots of the chromatic thresholds for the subjects in Table 4.2. These
four subjects are not within the 'nonnal' on the Nagel anomaloscope,
however satisfy the SNO on the CAD test. ... 178 Figure 4.10: Plots of the chromatic thresholds in CIE-x,y diagram and
summarised results for two subjects misclassified in Table 4.3. The classifications on the Nagel anomaloscope and on the CAD test are in
disagreement for these two subjects ... 181 Figure 4.11: Results of colour deficient observers measured on the CAD test and
Nagel anomaloscope. (A) 51 protan and (B) 108 deutan observers ... 183 Figure 4.12: Results of colour deficient observers measured on the CAD test and
Figure 5.1: Arrangement of visual pigments in a cone photoreceptor showing the enfolded membrane of the cone outer segment packed with photopigment molecules ... 199 Figure 5.2: Theoretical spectral sensitivity curves as a result of optical density
changes for the L-cone sensitive pigment. ... 201 Figure 5.3: Schematic of the tandem array ofL- and M-cones on the q-arm of the
X-chromosome. CA) The LCR, exons and introns. CB) Schematic of unequal intragenic crossover that would produce hybrid genes ... 202 Figure 5.4: Matching ranges and midpoints obtained on the Nagel anomaloscope
and predicted phenotypical results from genetics for 23 subjects ... 214 Figure 5.5: RG and YB chromatic thresholds measured on the CAD test in
'standard normal observer' (SNO) CAD test units for 23 subjects ... 215 Figure 5.6: Correlation ofNagel anomaloscope (RGI) versus RG thresholds on the CAD test for 23 subjects ... 215 Figure 5.7: CAD data for subjects 7 and 8. These two subjects have the same
genotypes with a peak separation ~Amax of2.5 nm ... 216 Figure 5.8: Peak separation between visual pigments (~A.max) versus RG chromatic thresholds ... 217 Figure 6.1: (A) Screen dumps showing the appearance of the stimulus employed
to measure the optical density of the macular pigment (MP) for two locations centred 0° and 1.25° from fixation. CB) Example of macular pigment optical density (MPOD) profile obtained by measuring MPOD at a number of retinal locations up to ±8° ... 229 Figure 6.2: A comparison of spatial profiles of MPOD measured using motion
photometry and the MAP test in four subjects ... 230 Figure 6.3: (A) Colour detection thresholds for both YB and RG discrimination
measured with the CAD test showing typical results for one normal
trichromat. Measurements were taken at the fovea and 3° in the periphery. (B) Bar plot showing typical results for one subject at the fovea and in the periphery ... 231 Figure 6.4: 2-D spatial profiles for two subjects plotted using MAT LAB
(Mathworks, Inc., Massachusetts) ... 236 Figure 6.5: Estimates of mean MPOD for each group of subjects at the end of
transmittance of blue light when the MPOD values in the P-C group are compared with the corresponding measurements in the P group ... 240 Figure 6.7: (A, C) Chromatic detection thresholds measured at the fovea and (B,
D) 5° in the periphery plotted against the available MPOD values at the end of phase 11 ... 241 Figure 6.8: Chromatic detection thresholds plotted against MPOD values
measured at the end of phase III of the study when full spatial profiles of MP density were available for P-C and P groups. (A, C) Average foveal and (B, D) average peripheral MPOD values ... 243 Figure 6.9: Analysis of cone contrasts and the corresponding colour signals
Table 1.1: Incidences of colour vision deficiencies in men and women ... 72 Table 2.1: Test battery carried out at City University ... 88 Table 2.2: Number of subjects that carried out each different colour vision test
used in the study ... 103 Table 2.3: Contingency tables comparing the Ishihara plate, AO-HRR and the
Farnsworth D15 colour vision tests with the Nagel anomaloscope ... 116 Table 2.4: Swnmarised results for several colour vision tests with reference to the
Nagel anomaloscope. The values of sensitivity, specificity, PPV and NPV are shown ... 117 Table 2.5: Comparison (pass/fail) of the various colour vision tests for the same
164 subjects that did all five tests ... 119 Table 3.1: Staircase parameters used to measure threshold discrimination
parameters ... 145 Table 3.2: Directions in CIE-x,y colour space (in degrees) used for testing nonnal
trichromats, deutan and protan observers ... 147 Table 3.3: Summary of results for protan subjects A-D in Fig. 3.15. For all four
subjects the Ra and YB chromatic sensitivity thresholds on the CAD test have been computed. The results on the Nagel anomaloscope: red-green range and RaI, the Ishihara, AO-HRR, CU and D 15 tests are given for each subj ect. ... 154 Table 3.4: Swnmary of results for deutan subjects E-H in Fig. 3.16. For all four
subjects the Ra and YB chromatic sensitivity thresholds on the CAD test have been computed. The results on the Nagel anomaloscope: red-green range and RaI, the Ishihara, AO-HRR, CU and Dl5 tests are given for each subject. ... 155 Table 4.1: Contingency table showing number of subjects that pass/fail the nonnal observer criteria for both the CAD test and the Nagel anomaloscope ... 177 Table 4.2: Subjects that failed the nonnal on the Nagel and passed the SNO on the CAD test. ... 179 Table 4.3: Contingency table showing number of subjects classified as having
deutanlprotanlnormaVtritan colour deficiency on the Nagel anomaloscope that are also classified as deutanlprotanlnonnaVtritan on the CAD ... 180 Table 4.4: Contingency table showing number of subjects that pass/fail the
Ishihara plate test and the nonnal observer criteria on the CAD test. ... 184 Table 4.5: Contingency table showing number of subjects that pass/fail the
including the CAD test in comparison to the Nagel anomaloscope ... 189 Table 4.9: Comparison (pass/fail) of the various colour vision tests, including the
CAD test, for the same 164 subj ects ... 191 Table 5.1: Summary of the clinical test results for 23 subjects selected for further
testing ... 209 Table 5.2: Summary of molecular genetic analysis for 23 colour vision deficient
observers ... 212 Table 6.1: Schematic diagram showing the various subject groups, the time course
of supplementation with carotenoids and the various tests of visual
I would like to deeply thank the various people who, during the several years I have dedicated to this work, provided me the support and encouragement I needed. This thesis could not have been written without their help.
Firstly I must thank John Barbur for his supervision and for the many and varied discussions we had. Having started from a physics background, I have gained a lot from working in a department with a wide variety of research interests. I have enjoyed learning about the field of vision science, and this would not have been possible without John's contagious enthusiasm.
J ennie Birch for her support and teaching me all about colour vision. Alister Harlow for the control programs. Theresa Squire and Helen Walkey for helpful discussions and advice on numerous occasions. Astrid Dempfle for the thorough reading of my thesis, help with statistics and, overall, very useful input. Steve Grupetta for help with drawings in Illustrator.
Carolina Gheri, Grace Walker, Brice Thurin, Valentina Arena, for their extra patience in carrying out additional experiments when needed.
I'm grateful to the UK Civil Aviation Association for involving me in studies of colour vision in aviation and allowing me more time to finish.
I'm also grateful to Wolfgang Schalch for giving me the opportunity to participate in the LUXEA-study trial.
I have to thank all the 472 subjects for their time and patience in taking part in this study.
The environment at City has been great. I have to really thank everyone, especially Carolina, Brice, Vale, Vincent, Cristiano, Christophe, Grace and Steve for being there when needed.
This investigation involved a number of related studies with the principal aim of assessing the variability in chromatic sensitivity in "normal" trichromats and colour deficient observers. An important outcome was the development of a new method for accurate and efficient measurement of chromatic sensitivity and the establishment of reliable statistical limits that describe the distribution of red-green (RG) and yellow-blue (YB) chromatic sensitivity in normal trichromats. Chromatic sensitivity was assessed using a computer-based psychophysical procedure that employs spatiotemporal luminance contrast (LC) masking techniques to isolate the use of colour signals. The colour-defined stimuli were buried in dynamic LC noise and moved diagonally across a square. The subject's task is to indicate one of the four possible directions of stimulus motion by pressing the corresponding response button. The Colour Assessment and Diagnosis (CAD) test was optimised for stimulus size and background luminance level to provide an efficient measure RG and YB chromatic sensitivity. Colour detection thresholds are assessed along 16 directions in chromaticity space, selected to yield maximum information on RG and YB chromatic sensitivity loss and to distinguish between deutan and protan deficiencies.
The CAD test was used to measure chromatic discrimination thresholds in 472 observers. The results made it possible to evaluate the screening and diagnostic efficiency of the CAD test in comparison with a number of established clinical colour vision tests, e.g., Nagel anomaloscope and Ishihara pseudoisochromatic plates. The specificity and sensitivity of the CAD test versus the Nagel anomaloscope (223 subjects) was found to be 100% and 97.5%, respectively. The diagnostic agreement with respect to the Nagel anomaloscope was 0.99; only two subjects showed inconsistent classification deficiency. Chromatic thresholds measured in normal trichromats were also examined and the variability amongst normal colour vision was investigated. The data obtained were used to establish the statistical limits for the standard normal observer on the CAD test. A template based on these limits was generated and provides an efficient way of separating accurately colour deficient from normal trichromats. The high specificity found is consistent with the correct detection of minimal colour deficiencies that sometimes go undetected in other colour vision tests.
1.1 Overview
Today colour is all around us; it was only a few decades ago that photography, films and TV were still in black and white. The extensive use of black and white media makes it obviously clear that colour is not usually required to carry out many visual functions. Yet, perception of colour greatly enriches our visual experience. Beyond esthetical reasons, colour can enhance visual performance through increased conspicuity, segmentation and coding.
The human visual system is capable of distinguishing between many different colours (Judd and Wyszecki 1975). The perception of colour is a three-way interdependent system which involves: a source oflight, the physical properties of the object, and the observer. This system does not simply depend on the reflectance of the object, but also on the spectral composition of the light illuminating it. In addition, colour perception depends on the characteristics of the observer which vary from one person to another. Besides, what makes human colour perception so useful is the roughly invariant perception of object when viewed in context, despite variation in the composition of incident light. Colour vision is therefore not simply a record of the physical parameters of the light reflected from the object's surface but rather a sophisticated abstracting process ultimately achieved by the brain. Therefore, colour is a primary dimension of visual processing that provides additional information on the physical properties of the environment.
can be congen1ta\ OT aCC;\l\tecL Ccm.g,enital colour vision defi .j n j S uro ",n"" common and more prevalent in men (-8%) than in women (-0.4%). Acqulrecl deficiencies may be caused by aging effects, retinal or general diseases, toxic effects of certain drugs, etc.
The wavelength range to which the human visual system responds extends
nonnally from 380 to 780 nm. The main regions of the electromagnetic spectrum are shown in Fig. 1.1. The infra-red and ultra-violet regions are outside the visible region of the spectrum; they can provide radiant energy that tans the skin or wanns the body, but they cannot nonnally be seen as light. Our ability to see colours is a result of evolution and it must have appeared early in the evolution of vision. For certain living species, the capacity to differentiate only light and dark without colour must have been a handicap. Two types of photoreceptor evolved first, one responding to one region and a second responding best to another region
of the visible spectrum (Nathans 1999). With this arrangement, the brain compares two signals in order to distinguish colour; it is the relative rather than
the absolute differences that are interpreted. The trivariant system of colour vision as known today, evolved 30-40 million years ago, in the transition from New
World monkeys to Old World monkeys, suggested to facilitate the ability to pick
out fruit amongst green foliage (Moll on 1989; Osario and Vorobyev 1996). The basis of this system is the presence of three photoreceptors in the eye responsible
for vision under daylight conditions that are sensitive to different parts of the
visible spectrum.
Wavelength (nm)
Ultra-violet
10.14 10-12 10-10 10-a 10-' 10" 10-2 1
Wavelength (m)
In psychophysics there are two main types of experiment; one depends on an observer reporting what is seen or perceived, i.e. colour naming, and the other
involves measuring performance thresholds on tasks such as detection, discrimination or colour matching ability. Limitations on colour naming are self-evident as a scientific method since names depend upon a common use of
language. Our understanding of the perceptual properties of colour vision has been acquired principally from studies of visual thresholds related to performance-based experiments.
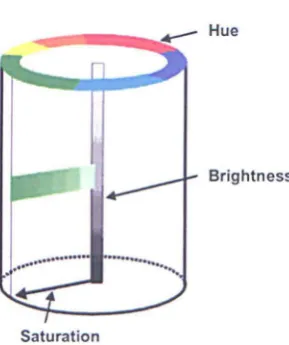
Hue
Brightness
[image:25.554.200.345.283.456.2]Saturation
Figure 1.2: A schematic representation based on the Munsell system. The brightness scale is on the vertical axis, the hue scale is on the perimeter of the cylinder and saturation is on a radial scale.
The basic attributes of colour can be described as varying along three perceptual dimensions of hue, brightness and saturation. The dimension of hue is usually described based on how similar the visual stimulus is to one, or to proportions of two of the perceived colours namely red, yellow, green and blue (physically related to the wavelength of light). Brightness is the attribute that describes the lightness of the visual stimulus, i.e. bright, dim. Saturation describes the colourfulness of the colour sample and can be judged with respect to a reference
The arrangement of colours was such to produce approximately constant perceptual differences between any two neighbouring samples. Fig. 1.2 shows a simplified representation underlying the basis of a colour ordering system.
Reliable measurements of human perception of colour and in particular the ability to discriminate different colours are becoming increasingly important. Technological improvements in colour displays have made it possible to use a range of colour combinations to improve visual performance for many different tasks. For example, in the transport industry, colour is used for lights, signs, display panel instruments and other control applications. In these situations colour, in addition to enhancing conspicuity (Barbur and Forsyth 1990), is used for the coding, grouping and segmentation of packets of information, which can improve significantly the processing and interpretation of visual information. The conspicuity of objects can be increased significantly by addition of colour, though luminance contrast is undoubtedly the most important parameter. Thus a person with a colour vision deficiency, not able to use correctly colour-coding, may be a handicap in practical situations such as employment. The increased need for clinical testing of congenital colour defective observers has been attributed to the development of demanding occupations and hence the need to screen colour defective observers. In recent years, some employers have considered the need to review their current standards of colour vision. Concern has been expressed particularly by the Civil Aviation Authority in the U.K. Although flight crew must be able to discriminate colours because their work involves the recognition of various colour codes, it is not certain if the present requirements and testing procedures are fully appropriate for the tasks that are carried out.
1.2 Thesis synopsis
Several investigations that have emanated from the different topics introduced above form the body of this thesis and are described in the remaining chapters.
• This chapter reviews the anatomy and physiology of the human eye with emphasis on aspects relevant to the topics covered in this thesis. A description of the process that starts with the absorption of photons by the eye, converting electromagnetic energy in the form of light into nerve impulses. Following an initial coding within nerve cells in the retina, the nerve impulses are transmitted along the optic nerve and nerve fibres to terminate at the back of the brain. The chapter also describes various methods of colour measurement and specification and introduces the different forms of abnormal colour vision.
• Chapter 2 describes some of the basic clinical techniques available for evaluating congenital colour vision defects. The definitions of the parameters used to evaluate the efficiency of a colour vision test employed throughout this thesis are also included. The results of observers assessed on the principal colour vision tests enables direct comparison with data from a new colour vision test described in Chapter 3.
• Chapter 3 describes the Colour Assessment and Diagnosis (CAD) test that addresses some current problems in colour vision assessment. The process of development and optimisation of the CAD test for measuring chromatic sensitivity is described. This chapter includes also a short investigation into the effects of different stimulus sizes and background luminance on chromatic sensitivity in order to understand the limits of the test. The results obtained in subjects with congenital colour vision deficiency on the CAD test are also described.
• In Chapter 5, a study of colour vision assessment in subjects with unusual colour matches on the Nagel anomaloscope is described. In addition to the results on colour matching performance and chromatic discrimination thresholds, genetic sequencing of the photopigment in the photoreceptors has been carried out in the Neitz's lab in Wisconsin (D.S.A). This allows direct comparison of the predicted peak wavelength separation based on genetic identification of their hybrid genes and the measured psychophysical colour discrimination performance.
• Chapter 6 describes an investigation into the effect of the macular pigment, a pre-receptoral filter, on chromatic discrimination thresholds measured in subjects with higher than normal levels of macular pigment.
1.3 Anatomy and physiology of colour pathways
1.3.1 The eye
The eye is located in the bony orbit close to the midline of the head cushioned by
surrounding fatty tissue. Movement of each eye is controlled by three pairs of
extraocular muscles that determine the position of the eye within the orbit. A
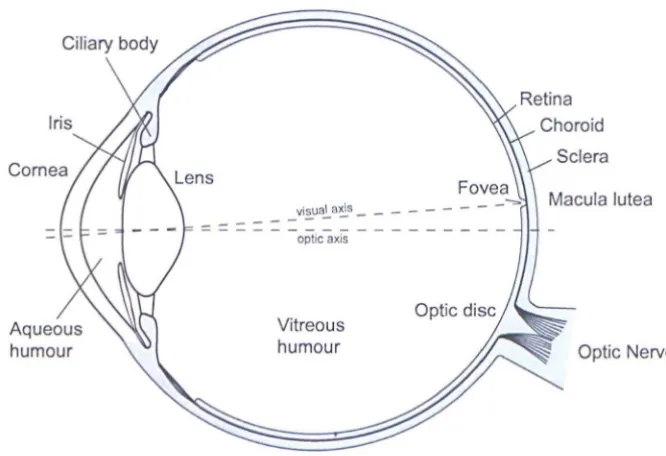
horizontal section of the human eye is shown in Fig. 1.3.
__ v;~ua~a~s __ _ - -optiC axis
[image:29.558.95.428.277.505.2]Vitreous humour
Figure 1.3: Cross section of a human eye.
Optic Nerve
The outer layer consists of the transparent cornea, the white opaque sclera and a
transition region known as the limbal region. The cornea, optically a clear
refractive tissue which covers the nearly spherical protuberance at the front of the
eye, is the major optical component of the human eye providing clarity,
impermeability and protection. Given the absence of blood vessels, protection
from microbes and pathogens, provided by the antimicrobial factors in the tear
film, is carried out by blinking and the limbal region, also involved in drainage of
fonns the pupil of the eye and detennines the amount of light that can pass through. Two involuntary muscles, the sphincter and the dilator control contraction and dilation of the pupil respectively. The pupil diameter can vary from about 2 to 8 mm controlling the light flux captured by the eye. The ciliary body fonns a ring of tissue inside the sclera extending from the iris to the anterior edge of the retina. Together, the ciliary muscle and the zonule fibres, change the shape of the lens. The lens of the eye contains crystallins and is elastic in nature whose alteration of its optical properties, during the act of accommodation, allows the viewing of objects at different distances.
The choroid is a vascular layer lying just inside the sclera through which oxygen and nutrients are supplied to the outennost portion of the retina. The retina is a multilayered structure comprising the pigment epithelium, the photoreceptors and other nerve cells, and is responsible for the preliminary processing of light signals. The retina also contains many blood vessels supplying the inner portions of the retina. With the aid of an ophthalmoscope an orange-red hue can be seen that is characteristic of the retina's vascular supply.
The fovea is a small depression from 2.5 to 3 mm in diameter located at the centre of the retina about the visual axis. Apart from having the highest cone density, the foveal depression reduces the amount of scattered light within the retina, which aids the fonnation of a retinal image of excellent optical quality. The eyeball continuously moves so that light coming from the area on the object of primary interest falls on this region. An image is constantly shifted across different receptor cells by these nonnal eye movements. The macula lutea (yellow spot) is a central area extending beyond the fovea in which a yellow pigmentation may be seen.
The anterior and posterior chambers located in front of the iris and between the iris and the lens and the ciliary body respectively, are filled with a transparent fluid called the aqueous humour. The aqueous humour circulates through the anterior and posterior chambers. This liquid is continuously generated and
a transparent gelatinous mass called the vitreous humour. The structure of the eye, which approximates to a sphere with a radius of curvature of about 12 mm, is maintained by the pressure (-1 0-20nunHg) of these internal fluids.
The visual axis is defined as the line joining the object of interest and the fovea, the area of highest visual resolution (see Fig. 1.3). Slightly more nasally than the visual axis is the optic axis projecting closer to the optic nerve. The optic axis is the longest sagittal distance between the front or vertex of the cornea and the furthest posterior part of the eyeball. It is about the optic axis that the eye is rotated by the extraocular muscles.
Before light can be absorbed in the retina to initiate the visual response it must first transverse the ocular media where a variation in the absorbance with wavelength can change the spectral composition of the stimulus, and thus the resultant colour perception. Structures anterior to the photoreceptors in the retina, acting as pre-receptoral filters, are the cornea, lens and macular pigment (in the macula region) and are described in Section 1.6.
1.3.2 The retina
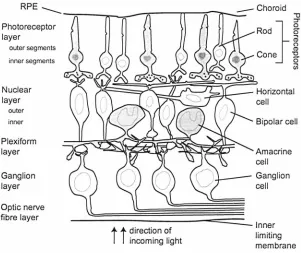
The retina is contained within the inner limiting membrane, which separates the retina from the vitreous humour, and the choroid, the vascular and pigmented layer attached to the sclera. The retina is less than half a millimetre thick over most of its extent. Within the retina 200 million nerve cells are found that are directly involved with the processing of visual information and are distributed across the retina in a highly organised way. Fig. 1.4 shows the main retinal layers containing the different kinds of nerve cells (neurons) and fibres based on the classification by Polyak (1941). Light passes relatively unblocked through all the retinal layers shown, until the retinal pigment epithelium (RP E), to reach and
Photoreceptor layer
outer segments
inner segments
Nuclear layer
outer inner Plexiform layer Ganglion layer Optic neNe fibre layer
"'tJ
} 5 Rod 0
Cone
I
Cil~~~~~~~~5~Y=~Horizontal
t t
direction of incoming lightcell
Bipolar cell
Amacrine cell
Ganglion cell
[image:32.538.128.429.85.338.2]- Inner limiting membrane
Figure 1.4: Schematic diagram of a tranverse section through the retina showing the different nerve cells and their interconnections. The ultrafine structure of the retina showing the subdivisions of the retina into layers are indicated on the left.
The outermost layer is the pigment epithelium, followed by the photoreceptor
layer. The next layer is the outer nuclear layer, which contains nuclei of various
types of bipolar cells, horizontal cells and amacrine cells. These cells form
intermediate connections in the sequence of signal transportation from the
photoreceptors to the ganglion cells. The connections between bipolar cells and
ganglion dendritic expansions are found in the plexiform layer. The layer of
ganglion cells contains the nuclei of ganglion cells and the axons that constitute
the fibres of the optic nerve. Ganglion cell axons traverse the retina and converge
at the optic disc where they form the optic nerve to the brain (see Fig. 1.3).
The stream of photons that constitutes the internal visual stimulus enters the retina
at the inner limiting membrane and proceeds through the various other retinal
layers before it reaches the light sensitive segment of the photoreceptors. The
photons that are absorbed elicit signals from the photoreceptors that trigger a
signals channelled through the axons of ganglion cells to higher levels of visual processing in the brain.
1.3.2.1 Photoreceptors
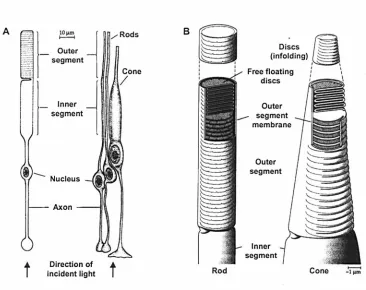
The pigment epithelium, the outermost layer of the retina, contains cells with processes interdigitating to a small degree the outer segments of photosensitive receptors known as rods and cones and the non photosensitive melanin pigment. The melanin pigment absorbs stray light after it has passed through the neural retina, reducing scatter that would otherwise degrade the retinal image. Fig. 1.5 shows the main structures of the rods and cones. There are roughly 120 million rods and 6 million cones intermingled nonuniformly over most of the retina. A typical rod has a cylindrical outer segment and a cylindrical inner segment, both of similar diameters. A typical cone, o? the other hand, is pyramidal and has its largest diameter at the bottom of the inner segment. It is in the outer segment where the interaction of the visual pigment and light initiates the process of vision. Rod outer segments consist of a large number of laminations, referred to as discs. The discs found in the cone outer segments differ from rods in that they are formed by an infolding of the cone membrane. The generation of discs IS
A
t
~1
Outer segment
,
..
"
1
segmentAxon
Direction of
incident light
Rods
Cone
t
B
ii
II I I
Rod
Free floating discs
Outer
segment membrane
Outer
segment
Inner
segment
[image:34.538.101.467.67.357.2]Cone
Figure 1.5: Main structural features of a typical rod and cone. (A) Schematic of photoreceptor anatomy, and (B) organisation of discs in rod and cone outer segments. Adapted from Oyster (1999).
The rods mediate vision primarily at scotopic (very low light) levels when visual
performance is generally poor and are also involved in motion detection. Cones
respond best at photopic (high or daylight) levels, when colour vision and the
resolution of fine detail are possible. There are four types of photosensitive
pigments in the normal human retina, one contained within the rods and the
remaining three distributed amongst the cones. All four photopigments consist of
a protein molecule, called opsin, which is bound to the isomer ll-cis retinal
(chromophoric group). The chromophciric group is common to all four
photopigments, and it is the protein that determines the spectral absorbance
properties. The pigment found in rods is known as rhodopsin and it absorbs
mostly in the middle wavelength range of the spectrum and transmits light at both
the short end and long wavelength ends of the visible spectrum (see Fig. 1.1).
When light is absorbed by rhodopsin the bonds in the isomer molecule retinal
tenus cis and trans refer to two fonus of the molecule. This process causes the isomerising molecule to break loose from the protein opsin, by which rhodopsin is bleached and no longer affected by light. The process of isomerisation transmits infonuation to adjacent neural elements within the retina. A similar process is believed to occur during isomerisation of the visual pigments of the cones. The process by which the retinal molecule breaks loose from the opsin gives rise to a change in electrical potential across the outer segment of the rod or cone which increases with the rate at which photons are absorbed.
The time-course of the rod response is longer than that of cones (MacLeod 1972), and the absorption of a single photon by a rod receptor is believed to be sufficient to produce a rod response (Schneeweis and Schnapf 1995). Contrarily, the response of cones is characterised by a fast response and lower photon amplification. There are three types of cone photopigments which are most sensitive or have maximum absorbance values in different parts of the visible spectrum. These are usually referred to as long (L-), medium (M-) and short (S-) wavelength sensitive cones according to the location of the peak of sensitivity in the visible spectrum; traditionally it is common to speak of red, green and blue cones, respectively (see Fig. 1.11). This will be discussed further in Section 1.4.1 .
greater than from other regions. These features are believed to be responsible for
the higher sensitivity of the fovea to visual stimuli as compared to that of other
retinal regions, when the eye is light adapted.
The three cone classes are distributed more or less randomly in the retina (Mollon
and Bowmaker 1992) and the retinal densities of L-, M- and S-cones can vary
significantly from subject to subject. There is also the innermost area of the
foveola (-0.34° in diameter) that is free of S-cones (Curcio et al. 1991). Roorda
and Williams (1999) combined adaptive optics and retinal densitometry (see
Section 1.4.1) to obtain images of the arrangements of S, M and L cones in the
living eye. Fig 1.6 is an example of an image of the cone mosaic in the retina.
Large individual differences in L:M ratios have been found (such as 1.15 and
[image:36.556.174.373.370.534.2]3.79) in two observers tested.
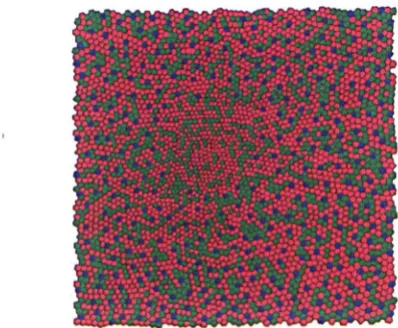
Figure 1.6: Cone mosaic of the rod-free inner fovea of an adult retina. The S-, M-, L-cones have been computer coloured. The diagram shows an inner area free of S-cones and the slightly smaller diameters of the cross sections in the centre compared to the outer edge. Reproduced from Sharpe et a1. (1999).
1.3.2.2 Post-receptoral retinal pathways
The photoreceptors synapse onto two major classes of neurones: the horizontal
horizontal cells to output from the photoreceptors were recorded by Svaetichin (1953). The responses exhibit graded potential changes (S-potentials) such that the change in potential increases with increasing stimulus intensity. Another feature of the neural coding in the visual system is the duality of polarisation, either an increase of the normal resting potential, hyperpolarisation, or a decrease, depolarisation. These are believed to originate two types of horizontal cells (measured in fish retina, Svaetichin 1958): one type exhibit only hyperpolarisation responses, shows little or no spectral selectivity and is believed to carry information about luminosity, the second type, on the other hand, exhibit both classes of response as the wavelength of the stimulus changes, hence providing the basis for colour vision. More recently, it is thought that horizontal cells provide lateral connections between L and M cones (avoiding S cones) and between S cones and weakly with L and M cones, but do not provide the basis for spectral opponency in the circuitry of the outer retina (Dacey 1999).
Signals from bipolar cell neurones undergo further changes as a result of lateral interaction effects that involve signals from amacrine cells. These are cells that integrate information over larger areas of the retina, up to 0.50
within the macular region and larger in the peripheral retina. Amacrine cells form a network linking inputs from groups of bipolar cells to ganglion cells and other amacrine cells. Several ganglion cells share input from the same L- and M-cones forming complex overlapping synaptic fields. Separate sets of bipolar and amacrine cells are believed to be involved in the extraction of luminance and colour signals. The rod system is also believed to have a separate set of bipolar and amacrine cells, thus achieving further functional separation for responses at scotopic light levels.
Convergence of signals to a ganglion cell occurs over well-defined areas of the retina. These areas are known as receptive fields and they have characteristic spatial distributions across the retina for gathering information about both luminance and spectral modulation. Typical receptive fields are circular in their organisation; where the central receptors provide an excitatory (+) input while the surround receptors form an inhibited (-) annulus. These receptive fields are known
achieved by comparison of signals from many adjacent overlapping receptive fields. There are also an equal number of cells with opposite response characteristics, where light falling in the centre inhibits firing of the ganglion cell and illumination of the surround annulus has an excitatory effect. These are known as OFF-centre receptive fields. Their opponent characteristics, adjacent areas of ex citatory and inhibitory activity, are fundamental to the way the retina extracts spatial modulations of intensity and spectral content (Lee 2004).
Spatial opponency is an effective algorithm for extracting information about luminance contrast differences. Information about colour is also coded through an opponent mechanism. The existence of spectrally opponent horizontal cells has already been mentioned, but there are also retinal ganglion cells that exhibit such properties. The response to different spectral wavelengths depends on the synaptic connections receiving input from sets of cones containing different photopigments. The spectrally opponent ganglion cells increase their firing rate to one set of wavelengths and decrease it to another, thus making it possible to discriminate coloured lights against a neutral background. These wavelength-opponent cells enhance the boundaries between regions of different colour in a similar way to luminance contrast taking place in other ganglion cells. The separation of luminance and chromatic signals is not complete and some of the receptive fields share and transmit information about luminance and colour at the same retinal location.
centre·surround Type 11
Type I
@
e
-
®
+ +®
,..
blue-ON + [image:39.538.83.439.67.224.2]®
Type III...
+ +®
+:+
e
red·ON
Figure 1.7: Types of retinal ganglion cell receptive field. In type I cells, the receptive field shows a +L/-M centre/surround antagonism and in type 11 cells, opposing inputs (S-cones vs. L- and M-cones) form two spatially coextensive fields and no centre/surround antagonism. In type Ill, cells have a concentric broadband receptive field. Adapted from Dacey (1996).
Fig. 1.7 shows the main retinal ganglion cell types based on the way in which the inputs from the three classes of cones are combined. The majority have an antagonistic response to M and L wavelengths (type I), the rest exhibiting an antagonism between S and L+M wavelengths (type 11). Type III cells exhibit antagonism between centre and surround but there is no antagonism between cone mechanisms. The centre and surround each combine inputs from both M and L cones. These broadband cells respond to the brightness of the centre versus the brightness of the surround. In type I, the interactions within a receptive field are
such that paired receptor types (e.g. L-cones and M-cones) oppose each other in their neural coding. For example, the centre of a receptive field coded for L and M wavelengths may be excited by signals from L-cones, whereas the adjacent surround to the receptive field gives an inhibitory response to signals from M-cones. The output of such a +U-M antagonistic ganglion cell will depend on the
relative amount of stimulation it receives from either the L or M-cones. If signals from the L-cones dominate, thus indicating a greater intensity of light of longer
ganglion cells. S versus L+M co-extensive receptive fields respond to input from the S-cones versus the combined signals from L and M-cones. These antagonistic response cells are commonly known as red/green and blue/yellow responses when LIM cells and S/(L+M) cells are involved, respectively.
When a stimulus is composed of wavelengths that activate and inhibit in equal amounts, the centre/surround receptive fields will be mutually antagonistic and the ganglion cell will not fire. These neutral points vary amongst these classes of ganglion cells and can be found in almost any part of the spectrum. The ensuing range of spectral sensitivities amongst these groups of ganglion cells gives a heterogeneous array of opponency throughout the retina (Zrenner 1985).
The types of ganglion cell responses described above may be contributing to luminosity and colour contrast effects and seem to form the basis for further visual analysis at cortical level discussed below. Recent reviews on colour processing in the retina include: Lee (2004), Dacey and Packer (2003) and Lennie (2003).
1.3.3 Visual processing beyond the retina
Left field
I
Left hemisphere
I A I \
I \
I \
I \
I \
Striate Cortex
\
Right field
\ \
[image:41.566.68.403.81.483.2]Right hemisphere
Figure 1.8: Pathway of nerve signals from the retina to the striate cortex in the brain. Nerve
fibres from the nasal half of the retina join fibres from the temporal retina of the fellow eye
at the optic chiasm. Objects from the left half of the visual field (darker shaded) are
processed in the right cortical hemisphere and vice versa. Neurons are layered in the LGN
into four parvocellular layers (3-6), two magnocellular layers (1&2) and interlaminar
konioceUular layers.
1.3.3.1 The lateral geniculate nucleus
The lateral geniculate nucleus (LGN), shown in Fig. 1.8, has a laminated structure
comprising of six distinct layers and several interlaminar regions (Kaas et al.
1978). The receptive field organisation of geniculate neurons in the different
LGN not only receives retinal input but a large number of synapses arise from descending inputs back from the cortex. The LGN therefore acts as a dynamic filter, regulating the passage through to the cortex (Sherman 1996). The top (dorsal) four layers, numbered 3-6, contain neurons with small cell bodies and are referred to as the parvocellular layers. The lower (ventral) two layers, known as the magnocellular layers, contain cells of larger size. The interlaminar regions contain the smallest cell bodies and these are termed the koniocellular layers.
The inputs to the distinct laminar zones of the LGN are segregated according to retinal ganglion cell class. These neurons that project to the LGN are frequently referred to as belonging to the magnocellular or parvocellular pathways. In general, it is the axons of the large (parasol) retinal ganglion cells with fast conduction velocities, which project to the magnocellular layers of the LGN, and the axons of smaller cells (midget), which project to the parvocellular layers. Cells of the magnocellular and parvocellular pathways are often known as M-cells and P-cells, respectively. The broad-band ganglion cells (type Ill) described above can be either M-cells or P-ce1ls, while the single-opponent cells (type I and Il) are exclusively P-cells (Leventhal et al. 1981). Thus, the magnocellular LGN layers are involved only in achromatic vision (Lee et al. 1988). The parvocellular LGN layers relay all colour information to the cortex in addition to information about luminance or achromatic contrast.
There is evidence that neurons in the koniocellular layers form a third pathway that can be traced from the retina to the visual cortex (Casagrande 1994). Small (bistratified) ganglion cells have been found projecting to the parvocellular layers of the primate LGN (Rodieck 1991; Rodieck and Watanabe 1993), but these have also been identified in interlaminar regions of the geniculate layers. These neurons mainly carry signals involving S-cones (blue-ON), suggesting that blue/yellow signals may be part of this third pathway (Dacey and Lee 1994).
initiated in a particular region of the retina are received at the LON with positional accuracy. Additionally, this segregation might account for stereoscopic vision, where appropriate combination of signals reflect different planes of depth.
In the LON the coding of signals and the receptive field characteristics are slightly more complex with 'sharper' spatial analysis than those of the retinal ganglion cells, although there is evidence of the same antagonistic centre/surround receptive field (Hubel and Wiesel 1968).
1.3.3.2 The visual cortex
The visual cortex (VI) is the region of the brain that is largely concerned with the processing of visual signals. The nerve fibres tenninating in VI, in the occipital lobe of the cerebral cortex, arriving from the LON are tenned optic radiations (see Fig 1.8). Signals coming from objects in different parts of the visual scene remain segregated along the neural pathways as far as VI. The spatial distribution of nerves can be mapped topographically on the surface of the brain corresponding to specific locations on the retina. This topographic mapping is such that the centre region of the visual field has a disproportionably large area of the striate cortex allocated to it. This accounts, at least in part, for the superior visual perfonnance associated with the fovea.
2, 3, and 4 receive input from the parvocellular system. The specific role of these
different areas is yet unclear. Area V5, also known as area MT (middle temporal
cortex), an area that contains cells sensitive to movement, receives input from the
magnocellular system which carries stereoscopic and motion information (Zeki
1974).
Cortical blob
, ... ,,,, III
_-- IV
_-- V
VI
Cortical layers
Figure 1.9: Structural organisation of the striate cortex, showing blobs and orientation columns. Reproduced from Schwartz (2004). Rand L means corresponds to the right and left eye, respectively.
One characteristic of cells in these areas is that those responsive to the same type
of stimulus, e.g. orientation or wavelength, are grouped together in parallel
columns perpendicular to the surface of the brain called columns. This specific
feature of the organisation of the visual cortex leads to orientation selectivity
(Hubel and Wiesel 1974). Another feature of cells in a column is ocular
dominance (Hubel and Wiesel 1968). These columns are responsible in
distinguishing inputs from the left or right eye. The ocular dominance columns are
significantly wider than orientation columns. The inputs from the two eyes remain
[image:44.539.150.390.225.436.2]rich in cytochrome oxidase and traverse the layers of the visual cortex as shown in Fig. 1.9. Chromatically sensitive VI cells are clustered together in blobs while cells in the interblob regions exhibit orientation specificity (Livingstone and Hube1I984; Conway 2003; Kiper 2003).
Figure 1.10: Schematic drawing of concentric 'double-opponent' receptive field cells in the primary visual cortex. Centre and surround each contain chromatic opponent mechanisms that generate opposite responses. For example, red-green contrast cells are activated by L-cones in the centre and inhibited by L-L-cones in the surround. M-L-cones have the opposite effect; they activate the cell in its surround and inhibit in its centre. Mixed cases of 'L' and 'M' represent imbalance of cone inputs between its centre and surround. Adapted from Hurlbert (2003).
[image:46.538.187.421.72.196.2]1.4 Colour vision models
Since the mid 18th century the field of colour science has produced an abundance of colour vision theories that aimed to explain how we see colours. Foremost amongst these is a proposition put forward by Newton that colour is a sensation and not a property of the light or electromagnetic radiation. He also realised that the sensation of colour associated with an object is related to the spectral reflectance of an object. Later in 1802 in a lecture at the Royal Society in London, Young added that the human colour vision depended on just three types of colour combinations. The idea he put forward emphasised that these three variables are not a physical property of the light but a physiological limitation of the eye.
This theoretical proposition would become the fundamental basis of what was later known as the trichromatic theory of colour vision. John Dalton around the same time described his own colour vision deficiency. Experimental evidence was provided by Maxwell who demonstrated by means of addition and subtraction of light, that all colours could be matched by the appropriate mixture of the three spectral colours; red, green and blue. Further support came a few years later by Helmholtz who proposed a physiologically based hypothesis of three channels with different but slightly overlapping spectral sensitivities. This experimental evidence showed how certain mixtures of colour were not simply additive in their response to light but appeared to cancel each other. For example, appropriate mixtures of red and green can form a yellow that appears totally devoid of any red or green.
colour vision became enriched when it was suggested that both theories could be accommodated to a zone theory model of colour vision where the mechanisms of trichromacy and opponency occur at different stages of visual processing. Land (1959) put forward the so-called retinex theory in which trichromacy is represented at the receptor level by the three cone types, and opponency holds at some later stage of neural processing.
1.4.1 Cone spectral sensitivities: evidence for trichromacy theory
The theory of trichromacy attributes colour perception to the activity of three primary cone classes. Colour vision is only possible over the operating range of the cones, Le under photopic or mesopic (twilight) conditions oflighting levels. In scotopic vision humans have no colour discrimination. The basis of trichromacy is the existence of three photoreceptors in the eye with overlapping spectral sensitivities.
M-Microspectrophotometry involves measuring the spectral transmission of a small beam going through the outer segment of an individual cone in vitro, compared to the reference beam. Results of measurements using this technique have confirmed the presence of three cone types in the normal human retina plus the rod receptors, containing photopigments with peak sensitivities in different regions of the visible spectrum (Bowmaker and Dartna111980). Suction electrode recordings have been obtained from L-cones, which involves drawing the outer segment of a single cone into a micropipette, which is connected to a current-to-voltage converter and then measuring its electrophysiological response when stimulated by light (Kraft et al. 1998).
Indirect methods of measuring cone spectral sensitivities were based on psychophysical data. The spectral sensitivity of the three cone types can be derived from the results of colour matching experiments. Colour matching involves matching one half of a bipartite field of monochromatic test light, with a mixture of altering intensities of three primary lights presented in the other half of the field. For some test wavelengths, a proportion of one or two primaries must be added to the test field to achieve a match. This method of colour matching has revealed the cone sensitivity curves more accurately than by direct methods (Smith and Pokomy 1975). This type of measurement is difficult in colour normals, but more successful in colour deficient observers lacking one or two cone types. In order to compare measurements for colour deficient observers with those of colour normals, the colour deficient observers must have cone sensitivities in their remaining cones that match those in normals. Appropriate observers maybe chosen by genetic analysis of the photopigment gene array.
cone spectral sensitivities and these are shown in Fig. 1.11. These measurements
are consistent with spectral sensitivities measured in dichromats, S-cone monochromats (see Section 1.6.2), and in colour normals, and they reflect typical macular pigment and lens densities for a 2° field.
S-cone Rod M-cone L-cone
>--
0.8.s; ;; .-. . - 1/1
1/1-c: .
-CI.I c: 0.6
1/1 ::I -0>-CI.I Cl
.!!!
:u
0.4 -ra c: CI.I
E-...
0Z 0.2
0
350 400 450 500 550 600 650 700 750
Wavelength (nm)
Figure 1.11: Stockman and Sharpe (2000) cone fundamentals. The curves represent normalised spectral sensitivity of the four receptor types in the human retina (Stockman et al. 1999; Stockman and Sharpe 2000). Data obtained from cvrl website (Color vision research laboratories) http://www-cvrl.ucsd.eduJ.
The peak sensitivities of the cones lie in the blue (~442 nm), green (~542 nm) and yellow-green (~570 nm) parts of the visible spectrum. The peak sensitivity of the rods occurs at 507 nm. It must be noted that the absorption spectra of the cone
pigments represent the probability that an individual photon will be absorbed at
the different wavelengths. However, the response of an individual photoreceptor relates only to the number of photons absorbed and signals no information about
the wavelength of light; this is known as the principle of univariance (Rushton
1972). Due to the overlapping of the spectra of the three cone pigments, there is a unique combination of absorbance probabilities of each wavelength in the visible
spectrum. By comparing the rates of absorption in different classes of cone, the
In summary, detailed evidence of the three cone types has been achieved, by microspectroscopy, suction electrophysiology and psychophysical methods. The most important psychophysical experiments have been those of colour matching initiated by Maxwell when he allocates the three colours to the corners of a triangle. In this triangle the corners represent the physiological primaries and any given location in the triangle can in principle specify the relative probabilities that a photon will be absorbed by each of the three types of pigment.
1.4.2 Opponent mechanisms