This is a repository copy of
Density distribution profile for internodes and nodes of
Phyllostachys edulis (Moso bamboo) by computer tomography scanning
.
White Rose Research Online URL for this paper:
http://eprints.whiterose.ac.uk/124974/
Version: Accepted Version
Article:
Huang, P., Chang, W-S. orcid.org/0000-0002-2218-001X, Ansell, M.P. et al. (2 more
authors) (2015) Density distribution profile for internodes and nodes of Phyllostachys
edulis (Moso bamboo) by computer tomography scanning. Construction and Building
Materials, 93. C. pp. 197-204. ISSN 0950-0618
https://doi.org/10.1016/j.conbuildmat.2015.05.120
Article available under the terms of the CC-BY-NC-ND licence
(https://creativecommons.org/licenses/by-nc-nd/4.0/)
[email protected] https://eprints.whiterose.ac.uk/
Reuse
This article is distributed under the terms of the Creative Commons Attribution-NonCommercial-NoDerivs (CC BY-NC-ND) licence. This licence only allows you to download this work and share it with others as long as you credit the authors, but you can’t change the article in any way or use it commercially. More
information and the full terms of the licence here: https://creativecommons.org/licenses/
Takedown
If you consider content in White Rose Research Online to be in breach of UK law, please notify us by
1
Density distribution profile for internodes and nodes of Phyllostachys edulis
(Moso bamboo) by computer tomography scanning
Puxi Huang1, Wen-Shao Chang2, Martin P. Ansell3, Y.M.John Chew4, Andy Shea5
Abstract
This study aims to quantify the density distribution, and specify the density distribution difference between internodes and nodes parts of Phyllostachys edulis (Moso Bamboo) in the radial, tangential and longitudinal directions. Due to the anatomical complexity of Moso bamboo, the measurement methods of bulk density are insufficient. In this work, Computed Tomography (CT) scanning has been selected to quantify the density distribution of Moso bamboo. Major findings from both anatomical analysis and CT scanning quantifications are that the Moso bamboo density of the internodes parts and the nodes parts reduce from the external surface to the internal surface of the culm wall in the radial direction. In the longitudinal direction, the internode parts of the Moso bamboo have relatively uniform density. Significant density fluctuation variations occur at the nodes parts of the Moso bamboo. The different proportions of the vascular bundles tissues and the parenchyma ground tissues dominate the density variation of the Moso bamboo in the radial direction. In the longitudinal direction, relatively uniform density of the internodes parts of the Moso bamboo is attributed to the straight vascular bundles. The significant density variation in the node parts is caused by the irregular intertwined vascular bundles.
1. Introduction
According to statistical analysis from UNEP (2014), at least one third of global energy use and 30 to 40% of global greenhouse gas emissions are attributable to buildings e.g. materials, constructions, maintenance etc. Using natural material to minimise environmental impact has proved to be an effective strategy in the building industry (Bribián 2011). Among a large number of natural plants, bamboo has considerable potential to be utilised as a sustainable building material due to its fast reproductive capacity, competitive mechanical properties and ease of manufacturing bamboo structures (Lobovikov 2003, Van Der Lugt et al. 2006, Flander and Rovers 2009). Both thermal and mechanical performances are crucial aspects in evaluating the feasibility of bamboo as a building material. Density is not only a physical property of an object but also a basic input datum in the quantitative research of thermal and mechanical properties and their analysis (Steppe et al. 2004). Bulk density of an object is relatively easy to measure. However, simply using bulk density to conduct thermal and mechanical analysis is not appropriate for natural materials as their density often varies as a function of position and orientation. A previous study has found that the density of bamboo is highly variable in the radial direction (Huang et al. 2014).
Limited research on density measurement of bamboo has been performed compared to timber. To accomplish the through-thickness and multi-dimensional density measurement of wood, several non-destructive technologies have been developed. A pulsed air-coupled ultrasound (ACU) method has been utilised to measure the density of particleboard (Sanabria et al. 2013). Microwave techniques have been found to provide an appropriate prediction of moisture content and density in Scots pine (Johansson et al., 2003). The dielectric properties of wood have been utilised to conduct high
2
frequency densitometry (Boden et al., 2012). Density measurements by X-Ray techniques rely on the principle of light absorption (Benson
-Cooper
1982, Mull 1984, Davis and Wells 1992, Reeves et al. 2012). All these methods are claimed to be sufficiently accurate to meet the requirements of density quantification research.Computer tomography (CT) scanning, based on X-Ray techniques, is widely utilised in timber densitometry. CT scanning has been applied in wood industry related research for more than thirty years (Benson-Cooper et al 1982) and the accuracy and calibration methods of CT scanning have been improved by many researchers (Mull 1984, Lindgren 1991). A linear relationship exists between X-Ray attenuation and density and therefore, CT scanning results can be directly transformed into density values (Davis and Wells 1992). Peng’s research (2009) utilised medical Computer Tomography (CT) to analyse density variation in bamboo culms at different ages and the linear relationship between the density of Moso bamboo and its Hounsfield Unit (HU) was determined in this study. However, the density of nodes parts is not included. In Peng’s paper, a phenomenon needs to be confirmed is that very low density values appeared at the first 1mm of the external surface side. These values could be regarded as the CT artifact. In addition, a fact needs to be emphasised is that the linear relationship is not universal due to the differences in CT scanning equipment and their specific settings (Reeves et al. 2012).
This study aims to quantify density distribution and specify the density distribution difference between internodes and node parts of Phyllostachys edulis (Moso Bamboo) in radial, tangential and longitudinal directions. The results of this study are prepared as the density database for the further work on CFD simulations for thermal performance of bamboo. In transient heat transfer studies, the density, thermal conductivity and specific heat capacity of the target material are three basic input parameters (Fourier 1878). Currently, there is insufficient density data for bamboo so researchers are forced to use the averaged density as the material parameter. However, the Moso bamboo is regarded as a non-homogenous natural material so density may vary as a function of position in the culm. The density variation may lead to relevant changes in other physical properties such as thermal diffusivity and specific strength. Better understanding of density distribution could provide more accuracy and clear guidance for optimum selection of certain specific parts of Moso bamboo for construction applications.
2. Anatomical characteristics of Moso bamboo
3
[image:4.595.185.405.93.290.2]
Figure 1 Terminology for a bamboo culm
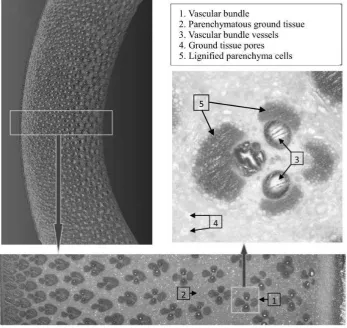
In the transverse section, the main morphological feature of Moso bamboo is that the vascular bundle tissue is surrounded by the parenchymatous ground tissue. Every vascular bundle unit has two large vessels which are the main channels of water transportation (Grosser and Liese 1971). The edge of the vascular bundle vessel is surrounded by dense lignified parenchyma cells. Figure 2 shows that the parenchymatous ground tissue is relatively uniform in size.
[image:4.595.124.472.418.746.2]4
In the radial direction, for internode parts, the total size and the area of vascular bundles’ vessels become larger from the external surface to the internal surface of the culm wall of the Moso bamboo. The quantity of the vascular bundle and the proportion of the lignified parenchyma cells decrease. For node parts, besides the aforementioned features, many horizontal tubular vascular bundles form a spoke-shape transverse section (Figure 3).
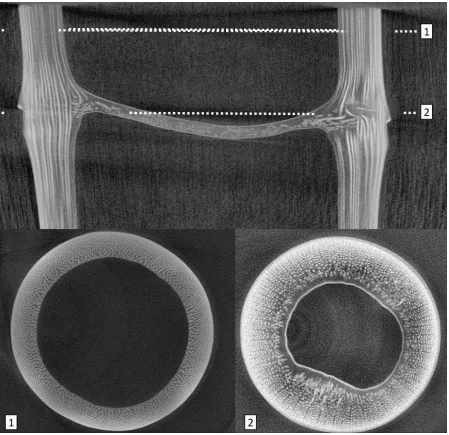
[image:5.595.75.525.276.711.2]Longitudinally, for internode parts, parenchyma cells and lignified parenchyma cells maintain a remarkably straight alignment with the longitudinal axis of the culm (Liese 1985, Lo et al. 2004). The vascular bundle vessels are present as continuous vertical cavities in the longitudinal direction. The constitution of every longitudinal line is relatively homogenous. For node parts, vertical vascular bundles gradually bend towards the horizontal direction (Figure 3). These interwoven bundles are irregularly distributed in the zone between the diaphragm and the peripheral cortex of nodes (Grosser and Liese 1971).
5
The morphological characteristics of the Moso bamboo along the tangential direction are determined by the morphological characteristics of the radial and longitudinal direction. The orientation of vascular bundles dominates the morphological difference between the nodes and internode parts of Moso bamboo. For internode parts, the direction of the vascular bundles is perpendicular to the tangential line. For node parts, the distribution of the vascular bundles is not uniform.
2. Methodology
2.1 CT Scanning
CT scanning technology is a method for quantifying the inner density variation of a Moso bamboo specimen as a function of orientation. This technique provides accurate visual information, an easy operational process and a simple method for calculating density (Mull 1984, Davis and Wells 1992). There are limitations in the CT scanning technique. To obtain an acceptable resolution for density quantification, the volume of specimen needs to be restricted to a relatively small size while the scanning time needs to be as long as possible (Grundberg et al.1995). The CT scanning environment needs to be fairly clean. Minimising the number of reference materials and avoiding the involvement of metals are two requirements for improving the accuracy of CT scanning (Bucur 2003). The scanning parameters will influence the results. Therefore, calibration needs to be conducted after adjusting the scanning setting (Freyburger, et al. 2009).
In this study, a Nikon XT H 225 CT scanner is utilised to quantify the density of the Moso Bamboo specimen. This equipment outputs greyscale images. The scanning parameters were fixed at a voltage of 106kV and current of 91 A. The resolution of the captured grayscale image is 1000 dots per inch (DPI). Under this condition, the linear relationship between the greyscale value and the density value of the specimen can be described by equation 1. The greyscale value is calibrated by scanning distilled water and Polypropylene (PP Homopolymer). The bulk densities of these materials are known. However, this linear relationship is only applicable to this scanning. Calibration needs to be conducted in every time by scanning reference materials with known bulk density. The Avizo image processing software is utilised to measure the greyscale of CT scanning image. The coefficient of multiple determination (R2) of this equation is 99.992%.
=39935.791.Gs - 1.193 (1)
: density (kg/m3)
Gs greyscale
Therefore, the density of the Moso bamboo can be calculated by the greyscale measurement of the greyscale images of specimens.
2.2 Specimen preparation
6
zone. The density measurement of the specimens was conducted in a radial direction, tangential direction and longitudinal direction. Scans were made according to the notation in Figure 4 and identified by the ten layer numbers and the radial angle in degrees.
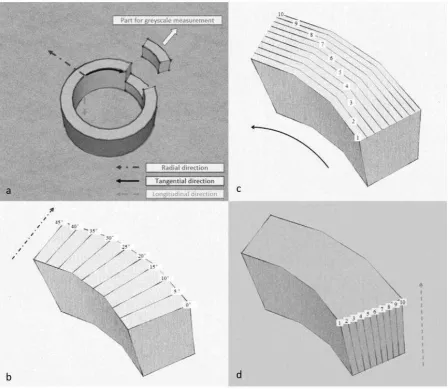
Figure 4 (a) Orientation of culm section showing a part cut for CT scanning. (b) Definition of radial elements in culm section. (c) Tangential elements in culm section. (d). Longitudinal elements in culm
section.
[image:7.595.74.523.126.516.2]7
3. Results and discussion
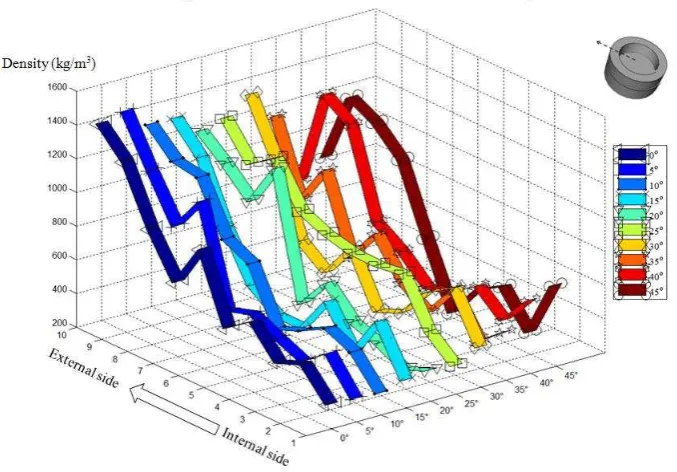
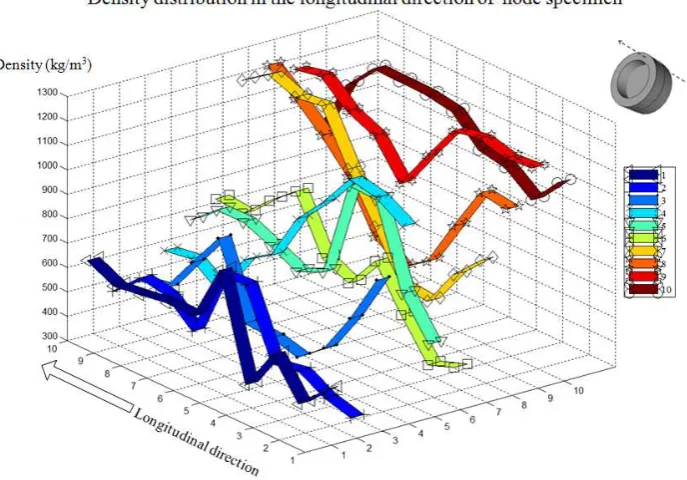
[image:8.595.125.462.204.435.2]The density variation of both internode and node parts were measured in this study by CT scanning. The results are illustrated by the waterfall charts. The left horizontal axis represents the sample points with measurement direction. The number is from 1 to 10. The right horizontal axis represents the serial number of different measurement lines. The vertical axis represents the density value. The unit of the density value is kilogram per cubic metre.
Figure 5 Density distribution in the radial direction of internode specimen
[image:8.595.122.461.489.725.2]8
In the radial direction (Figure 4c), the fluctuation in density of internode parts ranges from 336kg/m3 to 1283kg/m3 Figure 5). For node parts, the trend in density variation is similar to that of internode parts and the density fluctuation range of node parts is from 331kg/m3 to 1407kg/m3 (Figure 6). Node parts have higher density on the external side. The average density value of measurement lines ranges from 674 kg/m3 to 759kg/m3 at internode parts and 634kg/m3 to751kg/m3 at node parts.
The standard deviation of internode density ranges from 282kg/m3 to 336kg/m3. The standard deviation of node parts is from 240kg/m3 to 362kg/m3. The Coefficient of Variation (COV) ranges are 37.39% to 47.15% for internode parts and 33.51% to 49.46% for node parts, respectively.
In the radial direction, all density versus distance curves undulate and increase from the internal side to the external side of the bamboo culm wall (see Figures 5 and 6.). These undulations are caused by the anatomical characteristics of the Moso bamboo. Figure 2 indicates that a high density of vascular bundles and limited parenchyma ground tissue can be found at the periphery of the bamboo culm wall. From the external side to the internal side of the bamboo culm wall, the proportion of vascular bundles decreases, while more space is occupied by parenchyma ground tissue. The vascular bundle vessel is surrounded by lignified parenchyma cells. The lignified parenchyma cell size is smaller, but the cell is denser than the ground tissue cells. Therefore, the density of vascular bundle tissue is higher than the density of the ground tissue. A large proportion of vascular bundles signifies higher density. Most measurement lines show obvious fluctuation. However, the 25° measurement line at the node part should be noted. The density of this line tends to be steady in the middle zone because the line passes though a spoke-shaped radial, horizontal vascular bundle vessel. The hollow structure of the vessel is the main reason for the series of relatively uniform density values. At node parts, a remarkable feature is that vascular bundles deviate in different directions.
9
Figure 7 Density distribution in the longitudinal direction of internode specimen
Figure 8 Density distribution in the longitudinal direction of node specimen
[image:10.595.126.470.392.632.2]10
distribution of fibre bundles but is more stable on either side. There is also an underlying trend of increase in density passing from specimen 1 to specimen 10 in the radial direction.
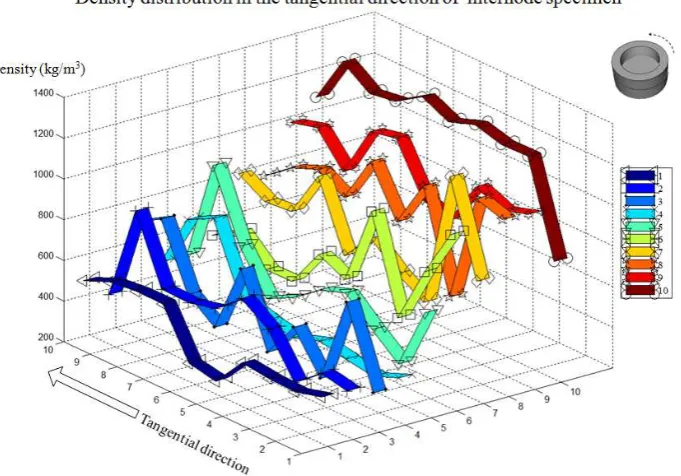
[image:11.595.129.470.266.504.2]In the tangential direction, the density ranges of internode parts are from 286kg/m3 to 1303kg/m3. The density of node parts ranges from 237kg/m3 to 1412kg/m3. The average density value of different measurement lines is from 442kg/m3 to 1192.1kg/m3 at internode parts and from 479kg/m3 to 1055kg/m3 at node parts. The standard deviation of each measurement line is from 89kg/m3 to 217kg/m3 at internode parts. The COV range is from 10.40% to 33.23%. At node parts, standard deviation is from 98kg/m3 to 290kg/m3. The COV is from 19.55% to 33.80%.
11
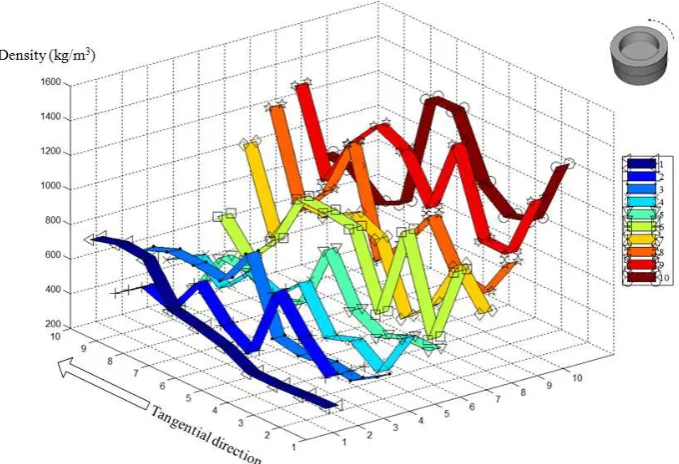
Figure 10 Density distribution in the tangential direction of node specimen
For internode parts, the standard deviation and COV data indicate that the density fluctuation range in a tangential direction (Figure 9) is more extreme than in the longitudinal direction (Figure 7), but steadier than the range of radial direction(Figure 5). The node parts’ standard deviation and COV changed very little compared with the longitudinal direction. The density variation of the tangential measurement lines of internode parts and node parts has a similar trend to the longitudinal direction. (see Figures 9 and 10). The fluctuation of density could be attributed to the distribution of the vascular bundles. The irregular interwoven vascular bundles are the cause of the unsteady density data.
The results of this study contributes to supplement the insufficient density data of Moso bamboo, albeit the data could be more universal and refined by considering the samples in different locations within the bamboo culm and higher resolution for CT Scanning.
4. Conclusions
Both anatomical observation and CT density quantification have indicated that:
The density of both the internode parts and node parts of the Moso bamboo decrease from the external surface to the internal surface of the culm wall in the radial direction. The different proportions of the vascular bundle tissues and the parenchyma ground tissues dominate the density variation of the Moso bamboo in the radial direction. A high proportion of the vascular bundles’ tissues are of higher density than the surrounding material, while a high proportion of parenchyma ground tissues is of low density.
In the longitudinal direction, internode parts of Moso bamboo retain relatively uniform density due to the straight vascular bundles. The density distribution for node parts is irregular.
12
Although the bulk density of the bamboo ranges from 601kg/m3 to 640kg/m3, Moso Bamboo has a relatively wide density distribution at different measurement points. The maximum and minimum densities are 237kg/m3 and 1412kg/m3 respectively. High density parts of Moso bamboo are concentrated on the external side of the bamboo culm wall for both internode and node parts. Low density parts of Moso bamboo appear on the internal side of the bamboo culm wall of internode parts.
The results of this study indicate that obvious variations exist in different orientations of the Moso bamboo culm. To enhance the reliability of the simulation models in thermal and mechanical fields, variation of the density must be considered.
Acknowledgements
13
References
Baron Fourier, J. B. J. 1878. The analytical theory of heat, The University Press.
Benson-Cooper, D. M. 1982. Computed tomographic scanning for the detection of defects within logs, Forest Service, Forest Research Institute.
Boden, S., Schinker, M. G., Duncker, P. and Spiecker, H. 2012. Resolution abilities and measuring depth of High-Frequency densitometry on wood samples. Measurement, 45 (7), pp.1913-1921.
Bribian, I.Z., Capilla, A.V. & Uson, A.A. 2011. Life cycle assessment of building materials: Comparative analysis of energy and environmental impacts and evaluation of the eco-efficiency improvement potential. Build. Environ., 46(5), pp.1133-1140.
Bucur, V. 2003. Techniques for high resolution imaging of wood structure: A review. Measurement Science and Technology, 14 (12), pp.R91-R98.
Davis, J. and Wells, P. 1992. Computed tomography measurements on wood. Industrial Metrology, 2 (3–4), pp.195-218.
Flander, K. D. and Rovers, R. 2009. One laminated bamboo-frame house per hectare per year. Construction and Building Materials, 23 (1), pp.210-218.
Freyburger, C., Longuetaud, F., Mothe, F., Constant, T. and Leban, J.-M. 2009. Measuring wood density by means of X-ray computer tomography. Annals of Forest Science, 66 (8), pp.804-804.
Grosser, D. and Liese, W. 1971. On the anatomy of Asian bamboos, with special reference to their vascular bundles. Wood Science and Technology, 5 (4), pp.290-312.
Grundberg, S., Grönlund, A. and Grönlund, U. 1995. The Swedish Stem Bank: A Database for Different Silvicultural and Wood Properties.
Huang, P., Chang, WS., Shea, A., Ansell, M. and Lawrence, M. 2014. Non-homogeneous Thermal Properties of Bamboo. In: Aicher, s., Reinhardt, H. W. and Garrecht, H. (eds.) Materials and Joints in Timber Structures. Springer Netherlands.
Huang, P., Chang, WS., Shea, A., Ansell, M. John Y.M.C., Shea, A., Zeidler, A. and Pickering, S. 2014. Heat transfer simulation and experimental studies of bamboo in radial direction. In: Forest Products Society (FPS) 68th International Convention, August 10-13, Quebec, Canada.
Johansson, J., Hagman, O. and Oja, J. 2003. Predicting moisture content and density of Scots pine by microwave scanning of sawn timber. Computers and Electronics in Agriculture, 41 (1–3), pp.85-90.
Liese, W., 1985. Anatomy and properties of bamboo. In: Proceedings of the International Bamboo Workshop Oct, 1985. 6-14.
Lindgren, L.O., 1991. The accuracy of medical CAT-scan images for non-destructive density measurements in small volume elements within solid wood. Wood Sci. Technol. 25: 425–432.
Lo, T. Y., Cui, H. Z. and Leung, H. C. 2004. The effect of fiber density on strength capacity of bamboo. Materials Letters, 58 (21), pp.2595-2598.
14
Mull, R. T. 1984. Mass estimates by computed tomography: physical density from CT numbers. American journal of roentgenology, 143 (5), pp.1101-1104.
Peng, G. Y., Jiang, Z. H., Qin, D. C., Ren, H. Q., Fei, B. H., and Shao, L. M. 2009. Study on density detection of bamboo with computed tomography. Wood Processing Machinery, 20(6), pp.16-19.
Reeves, T., Mah, P. and Mcdavid, W. 2012. Deriving Hounsfield units using grey levels in cone beam CT: a clinical application. Dentomaxillofacial Radiology, 41 (6), pp.500-508.
Incropera, F. P. 1981. Fundamentals of heat transfer, New York Chichester : Wiley.
Sanabria, S. J., Hilbers, U., Neuenschwander, J., Niemz, P., Sennhauser, U., Thömen, H. and Wenker, J. L. 2013. Modeling and prediction of density distribution and microstructure in particleboards from acoustic properties by correlation of non-contact high-resolution pulsed air-coupled ultrasound and X-ray images. Ultrasonics, 53 (1), pp.157-170.
Steppe, K., Cnudde, V., Girard, C., Lemeur, R., Cnudde, J.-P. and Jacobs, P. 2004. Use of X-ray computed microtomography for non-invasive determination of wood anatomical characteristics. Journal of Structural Biology, 148 (1), pp.11-21.
UNEP, 2014. Buildings and climate change, Greening the Buildings Supply Chain. Nairobi: UNEP. Zabalza Bribián, I., Valero Capilla, A. and Aranda Usón, A. 2011. Life cycle assessment of building materials: Comparative analysis of energy and environmental impacts and evaluation of the eco-efficiency improvement potential. Building and Environment, 46 (5), pp.1133-1140.