Contents lists available atScienceDirect
European Journal of Mechanics B/Fluids
journal homepage:www.elsevier.com/locate/ejmflu
Modal and non-modal stabilities of flow around a stack of plates
R. Theobald
a, Xuerui Mao
a,∗, A.J. Jaworski
b, A. Berson
aaSchool of Engineering and Computing Sciences, Durham University, Durham, DH1 3LE, UK bFaculty of Engineering, University of Leeds, Leeds, LS2 9JT, UK
a r t i c l e i n f o
Article history:
Received 23 October 2014 Received in revised form 3 February 2015 Accepted 14 April 2015 Available online 28 April 2015
Keywords: Laminar wake Flat plates Stability
a b s t r a c t
Modal and non-modal stabilities of flow around a stack of flat plates are investigated by means of asymp-totic stability and transient growth analyses respectively. It is observed that over the parameters con-sidered, both the base flow and the stabilities vary as a function ofReW2/(W−1)2, i.e. the product of the Reynolds number and the square of the expansion ratio of the stack. The most unstable modes are found to be located downstream of the recirculation bubble while the global optimal initial perturbations (resulting in maximum energy growth over the entire domain) and the weighted optimal initial pertur-bations (resulting in maximum energy growth in the close downstream region of the stack) concentrate around the stack end owing to the Orr mechanism. In direct numerical simulations (DNS) of the base flow initially perturbed by the modes, it is noticed that the weighted optimal initial perturbation induces peri-odic vortex shedding downstream of the stack much faster than the most unstable mode. This observation suggests that the widely reported vortex shedding in flow around a stack of plates, e.g. in thermoacoustic devices, is associated with perturbations around the stack end.
©2015 The Authors. Published by Elsevier Masson SAS. This is an open access article under the CC BY license (http://creativecommons.org/licenses/by/4.0/).
1. Introduction
Flow around a stack of plates has been widely encountered, e.g. in thermoacoustic devices applied in electricity generators, re-frigeration or heat recovery systems for conversion between ther-mal and acoustic energies. From the fluid dynamical point of view, the fluid flow past a stack of parallel flat plates exhibits many inter-esting flow features. Some of these have been studied experimen-tally in the past, revealing interesting patterns of both symmetric and asymmetric vortex shedding and loss of stability of elongated shear layers [1–5].
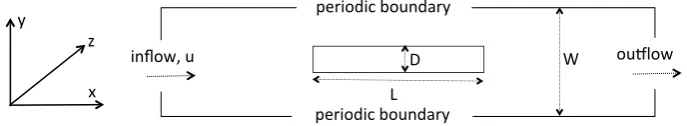
Parameter dependence of the vortex shedding in flow past a stack of parallel plates has been extensively studied, e.g. effects of stack positioning, blockage ratio, plate aspect ratio and Reynolds number [6–9]. To reduce the number of independent parameters, the flow past a stack can be simplified as flow past one flat plate confined by periodic (upper and lower) boundaries, as shown in
Fig. 1. Effects of confinement on flow stabilities have been well in-vestigated, e.g. in confined planar wake flow [10] and flow around arrays of rectangular cylinders [11] or circular cylinders [9], where the critical Reynolds number above which instabilities or vortex
∗Corresponding author.
E-mail address:[email protected](X. Mao).
shedding occur was calculated. For flow at Reynolds number well above the critical value, three-dimensional stability of the wake flow around a thin plate has been studied [12].
The literature about flow around a stack of plates (or more gen-eral bluff bodies) has focused on either the flow instabilities, which can be interpreted as the onset of vortex shedding, or the fully de-veloped vortex shedding state. The gap between the two states, i.e. the route from initial infinitesimal perturbations to periodic vortex shedding, is still an open question. The current study will target this gap and focus on identifying the origin of vortex shed-ding and how the infinitesimal perturbation to a steady base flow develops into vortex shedding in flow past a periodic plate array.
In the rest of this work, the methodology to calculate pertur-bations relevant to vortex shedding, e.g. modal stability (asymp-totic stability) theory to calculate the modal modes (most unstable modes) and nonmodal stability (non-normality, transient growth) theory to calculate the nonmodal modes (optimal initial pertur-bations) are presented, followed by the numerical setup, and then the modal and nonmodal modes as well as their nonlinear devel-opments to vortex shedding are discussed.
2. Methodology
Both modal and nonmodal studies performed in this work involve the linearization of the incompressible Navier–Stokes (NS)
http://dx.doi.org/10.1016/j.euromechflu.2015.04.005
Fig. 1. Simplified model of flow past a stack of plates adopted in this work.
equations:
∂t
u= −
(
u· ∇
)
u−
∇
p+
Re−1∇
2u,
with∇ ·
u=
0,
(1) whereuis the velocity vector,pis the modified pressure andReis the Reynolds number. The flow field can be decomposed into the summation of a steady base flow and a perturbation flow as(
u,
p)
=
(
U,
P)
+
(
u′,
p′).
(2) Substituting Eq.(2)into Eq.(1)and linearizing the convective term, the linearized NS equations are obtained:∂t
u′= −
(
U· ∇
)
u′−
(
u′· ∇
)
U−
∇
p′+
Re−1∇
2u′,
with∇ ·
u′=
0.
(3)In the Cartesian coordinates withx,yandzdenoting the stream-wise, vertical and spanwise directions respectively as illustrated in
Fig. 1, the base flow around a stack of plates is assumed to be homo-geneous in the spanwise directionz. Therefore any perturbation at timet
=
Tcan be further decomposed as the sum of modal modesu′
(
x,
y,
z,
T)
=
uˆ
ij(x,
y)
eσiT
eβjz
whereu
ˆ
ijdenotes the modal mode with spanwise wavenumberβj
,growth rate Re
(σi)
and frequency Im(σi)
. At each given spanwise wavenumber, the most unstable mode can be calculated as the modal mode with the largest growth rate. Clearly if all the growth rates are negative, all the modal modes decay in time and the flow is stable to perturbations, while if at least one growth rate is posi-tive, the flow is asymptotically unstable.To calculate the most unstable mode and its growth rate at a given
β
, define an operatorA, which evolves a perturbation fromt
=
0 tot=
T by integrating the linearized NS equations:u′
(
T)
=
A(
T)
u′(
0).
The growth rate of the most unstable mode can be obtained as
σ
max=
T−1lnλ
, whereλ
is the eigenvalue ofA. This (dominant) eigenvalue can be calculated by implementing an Arnoldi method to a Krylov sequence built by iterative calls of the linearized NS equations [13]. In a convergence test, it is observed that as ex-pected the growth rate is independent on the value ofT. However for larger values ofT, the growth rate converges over less iterative calls of the governing equations but each iteration costs more CPU hours. In this workT=
5 is adopted.While the modal stability analyses focus on asymptotic growth of perturbations over infinite time horizons, dynamics of pertur-bations over finite time, or transient energy growth, can be inves-tigated by nonmodal analyses. Transient growth is defined with respect to the energy growth of the perturbation over a given time interval [14] and can be quantitatively measured as the maximum ratio of the final perturbation energy and the initial energy across all possible initial perturbations [13]:
G
=
maxu′(0)(
u′
(τ),
u′(τ))
(
u′(
0),
u′(
0))
where
τ
is a final time and the scale product is defined as(
u′,
u′)
≡
Ωu′
·
u′dv
, withΩdenoting the computational domain.Defining A∗
(τ)
as the adjoint operator of A(τ)
, there is(
u′(τ),
u′(τ))
=
(
Au′(
0),
Au′(
0))
=
(
A∗(τ)
A(τ)
u′(
0),
u′(
0))
. Therefore the most significant transient energy growthGand thecorresponding optimal initial perturbation are the largest eigen-value and the corresponding eigenvector of the joint operator A∗
(τ)
A(τ)
. This eigenvalue can be calculated similarly as in themodal stability analyses through iterative calls of operatorA
(τ)
andA∗(τ)
to build a Krylov sequence. The action of the adjoint op-erator corresponds to the integration of the adjoint equations∂t
u∗= −
(
U·
∇
)
u∗+
(
∇
·
U)
Tu∗−
∇
p∗+
Re−1∇
2u∗∇
·
u∗=
0backwards fromt
=
τ
tot=
0 [13].To evaluate the energy growth in a particular area of the computational domain, e.g., the region around the exit of the stack where the perturbation has significant impacts on the efficiency of the thermoacoustic system, a weighted energy growth is defined:
GF
=
maxu′(0)(
Fu′
(τ),
Fu′(τ))
(
u′(
0),
u′(
0))
(4)whereFis a non-negative spatial weight function to filter the en-ergy growth in the ‘‘uninterested region’’, e.g. region far down-stream of the stack. This weighted maximum transient growth and the corresponding optimal initial perturbation are the largest eigenvalue and the corresponding eigenvector of the operator A∗
(τ)
F2A(τ)
. In the numerical calculation,F can be considered as a diagonal matrix with entries between 0 and 1. In the followingGandGF will be referred to as the global and weighted transient
energy growth, respectively.
3. Numerical setup
In this work, the stack is isolated and a constant inflow condition is implemented on the inflow boundary (seeFig. 1). The inflow velocity and the width of the plate are used to define the Reynolds number and therefore the non-dimensionalized plate width isD
=
1. The length of the plate is fixed atL=
10 to generate a thin plate and the domain widthWis a free parameter. Therefore the flow expands with a ratioW/(
W−
1)
when exiting the channel. In the numerical setup, the centre of the plate is located at the origin, the inflow and outflow boundaries are located atx=
−
30 andx=
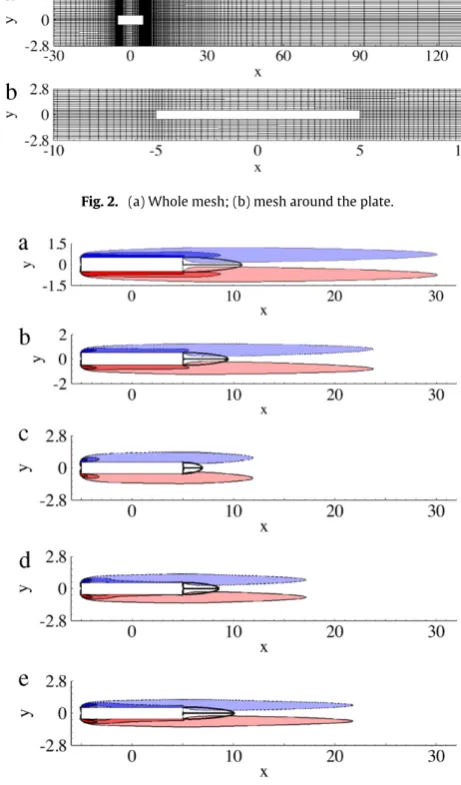
150, respectively. The domain is decomposed into 4522 spectral elements as shown inFig. 2and in each element Gauss–Lobatto polynomial expansions are employed. The conver-gence of the growth rate of the most unstable mode with respect to the polynomial order used in the elemental expansion, denoted asP, is presented inTable 1. It is seen that atP=
6 the growth rate has converged to five significant figures and this polynomial order will be used in all the following work.Table 1
Convergence of the growth rate of the most unstable mode with respect to the polynomial orderPat(Re,W)=(150,2.8).
P Real(σ )max
2 9.7562e−02
3 9.7604e−02
4 9.7616e−02
5 9.7620e−02
6 9.7622e−02
7 9.7622e−02
4. Results
In this section, the steady base flow is firstly calculated and then the modal and nonmodal studies are carried out to calculate the most unstable modes and optimal initial perturbations. Finally, the nonlinear developments of the modes are studied to identify their role in activating vortex shedding through DNS of the base flow initially perturbed by the modes.
4.1. Base flow
In stability studies, a steady base flow is required to solve the linearized NS equations and the adjoint equations. To obtain a steady solution of the base flow, DNS is conducted in combination with a frequency selective damping scheme, which suppresses the development of unsteadiness [16]. The simulation is run for a sufficiently long time interval until the solution converges.
Fig. 3shows the steady base flow at various Reynolds numbers and domain widths. It is seen that the wake features a recirculation bubble and a pair of elongated shear layers. This type of wake flow has been previously observed in flow around a stack of plates in thermoacoustic devices [17], as well as in other bluff body flows, e.g. flow around a cylinder cascade [18] and flow past square cylinders [19]. As the Reynolds number or the expansion ratio
W
/(
W−
1)
increases, both the bubble and the shear layers extend downstream, while the vertical extension of the bubble is almost constant, owing to the confinement effect of neighbouring plates. These observations suggest that the increases ofReandW/(
W−
1)
have similar effects on the base flow over the parameters studied. Considering that the boundary layer thickness inside the channel is a square root function of the Reynolds number and the boundary expands as a ratioW/(
W−
1)
when exiting the channel, it can be expected that base flow downstream of the stack varies as a function ofReW2/(
W−
1)
2. To verify this hypothesis, the length of the recirculation bubble, which is critical to the stability of the flow as will be presented later, is illustrated inFig. 4. It is observed that at a fixedW(or expansion ratio), the bubble lengthLincreases linearly with the Reynolds number. Furthermore, asW
varies, all the curves overlap, indicating thatLis a linear function of
ReW2
/(
W−
1)
2. Therefore the Reynolds number has similar effects on the bubble length as the square of the expansion ratio, e.g.Ldoubles when eitherReorW2
/(
W−
1)
2doubles.4.2. Modal stability analyses
The geometry withW
=
5.
6 matches the experimental setup used in [1] and is therefore adopted as an example to illustrate the instabilities at various spanwise wavenumbers and Reynolds num-bers, as presented inFig. 5. It is observed that the boundary of in-stability, featured by the contour line Re(σ
max)
=
0 expands to higher values of spanwise wavenumber as the Reynolds number increases. It is also noted that the two-dimensional mode (β
=
0) is always the most unstable one for a given Reynolds number and therefore the following studies focus on two-dimensional instabil-ities. [image:3.595.40.294.93.162.2]Fig. 2. (a) Whole mesh; (b) mesh around the plate.
Fig. 3. Contours of spanwise vorticity of the steady base flow at(Re,W) = (100,3), (100,4), (50,5.6), (100,5.6)and(150,5.6)for (a), (b), (c), (d) and (e), respectively. The contour levels are[−4,−2.4,−0.8,0.8,2.4,4]. Thick solid lines are border streamlines of the recirculation bubble, while the dashed and solid contour lines represent negative and positive contour levels respectively, as will be used in following contour plots.
Fig. 4. Bubble lengthLas a function ofReW2/(W−1)2.
[image:3.595.319.555.533.674.2]Fig. 5. Contours of the growth rate of three-dimensional most unstable modes, i.e. Re(σmax), atW=5.6.
flow becomes more unstable at larger Reynolds number or larger expansion ratios (smallerW) over the parameters considered. This observation suggests that over the cases studied, the confinement of the channel and the subsequent flow expansion destabilize the wake flow and the increase of expansion ratio has a similar effect as increasing the Reynolds number.
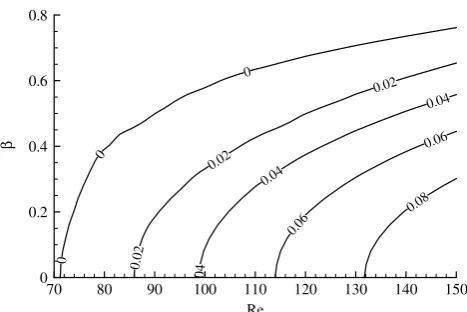
To quantitatively evaluate effects of Reynolds number and the expansion ratio, the critical Reynolds number, above which the flow becomes unstable, is plotted inFig. 6(b). It is observed that the critical Reynolds number increases linearly with
(
W−
1)
2/
W2andReCW2
/(
W−
1)
2≈
0.
00907 over the parameters considered.Distributions of the most unstable modes atRe
=
100 and vari-ous domain widths are shown inFig. 7. It is seen that all the modes are located far downstream of the plate trailing edge and are asso-ciated with the shear flow downstream of the bubble. These modes are roughly periodic in the streamwise direction, manifesting the local instabilities of the parallel shear layers downstream of the bubble. For increasingW, the shear layers in the base flow are less compressed and correspondingly the modes expand in the verti-cal direction. These most unstable modes exhibit in-phase oscilla-tions around the upper and lower boundaries and align with the odd–odd modes observed in flow past a cylinder cascade at low blockage ratios [9].4.3. Nonmodal stability analyses
The distributions of all the calculated unstable modes are concentrated far downstream of the stack, and would require a large time interval to reach the stack and activate vortex shedding. To reveal the most effective route from initial perturbations to vortex shedding, nonmodal stability analyses (or transient energy growth), which concentrate on the short time dynamics of perturbations, become an ideal tool. Nonmodal stabilities have been well investigated for asymptotically stable or weakly unstable flows, while in this case it will be shown that even for an asymptotically unstable flow, the nonmodal modes can be much more effective than the modal modes in perturbing the flow.
The perturbations near the stack end have the most impact on the efficiency of the thermoacoustic system. As a result, perturba-tion energy growth around the stack end deserves particular at-tention. To further concentrate on the energy growth around the stack end over short time intervals, the weighted transient growth is calculated by using a weight function (see Eq.(4)) to filter energy growth downstream of the bubble:
F
=
1 if 5
≤
x≤
10;
exp−(x−5)2 ifx
<
5;
exp−(x−10)2 ifx>
10.
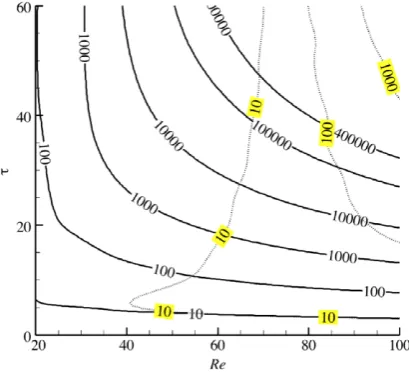
The global transient energy growthGas well as the weighted transient growthGFatW
=
5.
6 is shown inFig. 8. It is noticed thatthere is significant transient growth even in the asymptotically sta-ble condition (Re
<
74.
1 as shown inFig. 6). For the weakly unsta-ble cases, e.g.Re=
100, the transient growth is dominant over the time interval considered. For example, atτ
=
50, the energy growth of the most unstable mode is below 60 while the transient growth is over 1.
8×
107. However the weighted transient growthGFis significantly different withG, suggesting that the strong global
transient growth relies on the noise amplification downstream of the bubble. Nevertheless, the growth over the bubble region, eval-uated byGF, is still much higher than the energy growth of the most
unstable mode, manifesting a strong noise amplification over the bubble region.
Structures of the global and weighted optimal initial perturba-tions that result in the maximum transient energy growth are illus-trated inFig. 9. Comparing with the most unstable modes, which are far downstream of the stack as shown inFig. 7, the weighted optimal initial perturbations are located around the stack end, and therefore can be convected downstream and activate vortex shedding around the stack faster than the unstable modes. Physi-cally these perturbations could stem from wall roughness around the stack end. As
τ
increases, the perturbation moves upstream slightly so as to keep the bubble region disturbed over the range 0≤
t≤
τ
. Compared with the weighted optimal initial perturba-tion, the global optimal initial perturbation is located more down-stream and therefore relies less on the amplification in the bubble region.It is worth noting that the structures of the optimal initial per-turbations tilt backwards so as to take advantage of the Orr mech-anism when they are convected downstream and compressed by the base flow att
=
5, as shown inFig. 10(a) and observed in several other nonmodal stability analyses [20,13]. For further de-velopments of the perturbation untilt=
50 (seeFig. 10(b)), the amplification effect of the shear layer downstream of the bubble becomes dominant and the perturbation is amplified to resemble the periodic structure of the most unstable mode (seeFig. 7(c)). Therefore the transient growth is related to two mechanisms: the Orr mechanism around the bubble region and the shear-layer am-plification far downstream of the stack. To concentrate on the per-turbation growth over short time in the region around the stack end, the weighted optimal initial perturbation atτ
=
5 will be adopted in the following studies.4.4. Nonlinear development of the modes
Both the modal and nonmodal stability analyses performed above are based on linear assumptions and are only valid on the condition that the perturbation is small enough. Clearly, the vortex shedding is a dramatic change of the steady state and corresponds to large-scale perturbations. Therefore nonlinear developments of perturbations are critical in studying the route from initial perturbations to vortex shedding. In this subsection, the steady base flow is initially perturbed by either the most unstable modes or weighted optimal initial perturbations at
τ
=
5 and evolved in DNS over time long enough to identify the role of initial perturbations in vortex shedding [21].a
b
[image:5.595.58.283.247.394.2]Fig. 6. (a) Growth rate of the two-dimensional most unstable modes; (b) the critical Reynolds numberReCas a function of(W−1)2/W2, denoted by circles, and a straight (dotted) line with slope 0.00907.
Fig. 7. Contours of spanwise vorticity of the most unstable modes atRe=100 and (a)W=3, (b)W=4 and (c)W=5.6, respectively. Contour levels are chosen to highlight the structures.
Fig. 8. Contours of global (solid lines) and weighted (dotted lines and highlighted contour levels) transient energy growth atW=5.6.
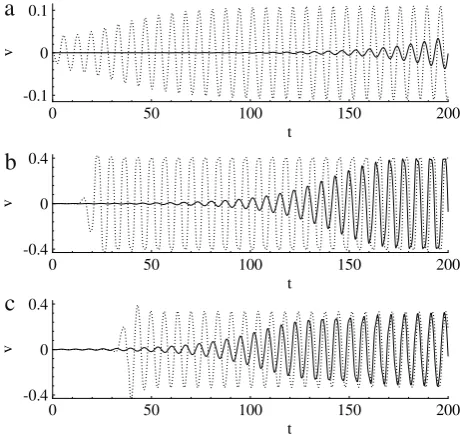
[image:5.595.328.545.249.417.2]For all the three points considered, it is seen that the optimal initial perturbation leads to periodic oscillations of the vertical ve-locity much faster than the most unstable mode. As the most un-stable mode travels upstream, it perturbs the region downstream of the bubble first (Fig. 11(b), (c)) and takes over 100 time units to reach the trailing edge region of the stack (Fig. 11(a)). In con-trast, the optimal initial perturbation is convected downstream by the base flow from the trailing edge of the stack and perturbs all the three points to oscillatory states beforet
=
50, which is theFig. 9. Contours of the spanwise vorticity of (a) weighted optimal initial perturbation atτ = 5, (b) weighted optimal initial perturbation atτ = 50 and (c) global optimal initial perturbation atτ=50. The Reynolds number and domain width are fixed atRe=100 andW=5.6, respectively.
Fig. 10. Contours of the spanwise vorticity in the development of the weighted optimal initial perturbation atW=5.6,Re=100,τ=5 and (a)t=5, (b)t=10 and (c)t=50. Contour levels are chosen to highlight the structures.
[image:5.595.65.270.439.626.2] [image:5.595.328.544.477.643.2]a
b
[image:6.595.42.274.67.284.2]c
Fig. 11. Development of the vertical velocityvin DNS of the steady base flow initially perturbed by the most unstable mode (solid lines) and weighted optimal initial perturbation atτ=5 (dotted lines) with relative energy (with respect to the base flow) 10−6atRe=100,W=5.6 and (a)(x,y)=(6,0), (b)(x,y)=(20,0)
and (c)(x,y)=(40,0).
5. Conclusion
A simplified model is established to investigate the stability of flow around a stack of flat plates. The steady base flow around an isolated plate with periodic boundary conditions on upper and lower boundaries is calculated through DNS. It is observed that the base flow varies as a function ofReW2
/(
W−
1)
2, which is the product of the Reynolds number and the square of the expansion ratio of the stack flow, over the parameters considered.Then the steady base flow is used in modal and nonmodal stability analyses to reveal the asymptotic and transient energy growth of perturbations, respectively. In modal stability studies, the growth rate of the most unstable mode is found to increase at increasing Reynolds number or the stack expansion ratio, indicat-ing a destabilization effect of the flow expansion or confinement. The critical Reynolds numberReCis observed to be a linear function
of
(
W−
1)
2/
W2and satisfiesReCW2
/(
W−
1)
2≈
0.
00907.There-fore the two free parameters, i.e. the Reynolds number and expan-sion ratio, can be merged into one parameter, i.e.ReW2
/(
W−
1)
2, in studies of both base flow and instabilities. The unstable modes, in the form of odd–odd modes as discussed in [9], are located in the region far downstream of the plates and are associated with the shear layers downstream of the recirculation bubble.In nonmodal stability analyses, it is seen that both the global optimal initial perturbations (resulting in maximum energy growth across all the domain) and the weighted optimal initial perturbation (resulting in maximum energy growth around the stack trailing edge) are located around the stack end. The transient energy growth relies on both the Orr mechanism around the stack end and the amplification effects of the parallel shear layers downstream of the recirculation bubble.
The route from initial perturbations to vortex shedding is investigated through DNS of the base flow initially perturbed by the modes calculated in stability analyses. It is observed that the
weighted optimal initial perturbations are convected downstream and trigger vortex shedding much faster than the most unstable modes, which travel upstream to activate vortex shedding. Overall the linear and nonlinear dynamics of the perturbations investigated in this work indicate that even when the steady flow is asymptotically unstable, the most unstable modes are ineffective in activating the bifurcation to vortex shedding since the upstream noise can be much faster in perturbing the flow.
Acknowledgements
This work made use of the facilities of N8 HPC provided and funded by the N8 consortium and EPSRC (Grant No. EP/K000225/1). The Centre is co-ordinated by the Universities of Leeds and Manchester. Artur J. Jaworski would like to gratefully acknowledge the support received for this work under EPSRC Advanced Research Fellowship (Grants GR/T04519/01 and GR/T04502/01) and Royal Society Industry Fellowship (2012–2015).
References
[1]X.A. Mao, A.J. Jaworski, Application of particle image velocimetry measure-ment techniques to study turbulence characteristics of oscillatory flows around parallel-plate structures in thermoacoustic devices, Meas. Sci. Tech-nol. 21 (2010) 035403.
[2]E. Besnoin, O.M. Knio, Numerical study of thermoacoustic heat exchangers, Acta Acust. United Acust. 90 (2004) 432–444.
[3]L. Zoontjens, C. Howard, A. Zander, B. Cazzolato, Numerical comparison of thermoacoustic couples with modified stack plate edges, Int. J. Heat Mass Transfer 51 (2008) 4829–4840.
[4]P. Aben, P. Bloemen, J. Zeegers, 2-D PIV measurements of oscillatory flow around parallel plates, Exp. Fluids 46 (2009) 631–641.
[5]X.A. Mao, A.J. Jaworski, Oscillatory flow at the end of parallel plate stacks: phe-nomenological and similarity analysis, Fluid Dynam. Res. 42 (2010) 055504. [6]L. Shi, Z. Yu, A.J. Jaworski, Investigation into the strouhal numbers associated
with vortex shedding from parallel-plate thermoacoustic stacks in oscillatory flow conditions, Eur. J. Mech. B Fluids 30 (2011) 206–217.
[7]A. Worlikar, O. Knio, Numerical simulation of a thermoacoustic refrigerator I. Unsteady adiabatic flow around the stack, J. Comput. Phys. 451 (1996) 424–451.
[8]A. Berson, M. Michard, P. Blanc-Benon, Measurement of acoustic velocity in the stack of a thermoacoustic refrigerator using particle image velocimetry, Heat Mass Transf. 44 (2008) 1015–1023.
[9]V. Boppana, J. Gajjar, Onset of global instability in the flow past a circular cylinder cascade, J. Fluid Mech. 668 (2011) 304–334.
[10]M. Juniper, O. Tammisola, F. Lundell, The local and global stability of confined planar wakes at intermediate Reynolds number, J. Fluid Mech. 686 (2011) 218–238.
[11]S. Balachandar, S. Parker, Onset of vortex shedding in an inline and staggered array of rectangular cylinders, Phys. Fluids 14 (2002) 3714–3732.
[12]S. Julien, J. Lasheras, J.-M. Chomaz, Three-dimensional instability and vorticity patterns in the wake of a flat plate, Phys. Fluids 479 (2002) 155–189. [13]D. Barkley, H.M. Blackburn, S.J. Sherwin, Direct optimal growth analysis for
timesteppers, Internat. J. Numer. Methods Fluids 57 (2008) 1435–1458. [14]P.J. Schmid, D.S. Henningson, Stability and Transition in Shear Flows, Springer,
2001.
[15]G.E. Karniadakis, M. Israeli, S.A. Orszag, High-order splitting methods for the incompressible Navier–Stokes equations, J. Comput. Phys. 97 (2) (1991) 414–443.
[16]E. Åkervik, L. Brandt, D. Henningson, J. Hoepffner, O. Marxen, P. Schlattera, Steady solutions of the Navier–Stokes equations by selective frequency damping, Phys. Fluids 18 (2006) 068102.
[17]A. Berson, P. Blanc-Benon, Nonperiodicity of the flow within the gap of a thermoacoustic couple at high amplitudes, J. Acoust. Soc. Am. 122 (2007) 122–127.
[18]J. Gajjar, N. Azzam, Numerical solution of the Navier–Stokes equations for the flow in a cylinder cascade, J. Fluid Mech. 520 (2004) 51–82.
[19]S. Sen, S. Mittal, G. Biswas, Flow past a square cylinder at low Reynolds numbers, Internat. J. Numer. Methods Fluids 67 (2011) 1160–1174. [20]H.M. Blackburn, D. Barkley, S.J. Sherwin, Convective instability and transient
growth in flow over a backward-facing step, J. Fluid Mech. 603 (2008) 271–304.