DOCDMEN7
THE CONTRIBUTION OF
INFRASTRUCTURE TO REGIONAL
DEVELOPMENT
Final report
LIBRARY
COMMISSION
This publication is also available in the following language:
FR. Parts 1-2: ISBN 92-825-5887-8
Cataloguing data can be found at the end of this publication
- i
Luxembourg: Office for Official Publications of the European Communities, 1986
Part 1 : ISBN 92-825-5882-7 Parts 1-2: ISBN 92-825-5886-X
Catalogue number: CB-45-85-001-EN-C
Articles and texts appearing in this document may be reproduced freely in whole or in part providing their source is mentioned.
Commission of the European Communities
THE CONTRIBUTION OF INFRASTRUCTURE TO REGIONAL DEVELOPMENT
Final Report
by
Dieter Biehl
INTRASTRUCTURE STUDY GROUP
FOREWORD AND ACKNOWLEDGEMENTS
With this Report the Study Group on the Contribution of Infrastructure to Regional Development presents the results of some years of both theoretical and empirical endeavours. The Group was faced with many expected and some unexpected difficulties, first in reaching agree-ment on a common research approach, and second, in defining common criteria for collecting data for an empirical analysis covering 141 regions of the actual 10 member countries of the European Community.
This research covers some new ground and brings toge-ther a wealth of information on regional infrastructure equipment and its link with regional development that has not been available before. By implication, both the theoretical approach and the empirical analysis repre-sent only the first steps into a field of research that need to be improved and to be continued.
The first version of the Final Report was produced already in June 1982. Since then, a number of controls revealed some data and aggregation errors so that all calculations have been completely redone for the pre-sent text.
Members of the Study Group:
Dieter Biehl, Technische Universitaet Berlin (up to 1982) and Johann Wolfgang
Goethe-Universitaet, Frankfurt <since 1982>, Federal Republic of Germany
(Coordinator of the Study Group) Sean Barret, Trinity College, Dublin, Ireland
Henry Van der Eycken, Universite Libre de Bruxelles, Belgium
Peter M. Jackson, University of Leicester, United Kingdom
George Markatatos, Agricultural Bank, Athens, Greece Peter Nijkamp, Vrije Universiteit, Amsterdam,
Netherlands
Maurizio Di Palma, Universita di Roma, Italy
Poul Ove Pedersen, Sydjysk Universitetscenter, Esbjerg, Denmark
Remy Prud'homme, Universite Paris XII, France
Collaborators:
I •
I .1 • I.2.
II.
I I .1 •
II.2.
II.3.
II.4.
II.5.
T A 8 L E 0 F C 0 N T E N T S
Foreword and Acknowledgements Table of Contents
Summary of the Report List of Tables
List of Figures and Maps
I N T R 0 D U C T I 0 N
AIM AND SCOPE OF THE STUDY
Assignment of the Study Group
Scope and Methodology of the Study
P A R T 0 N E
INFRASTRUCTURE AS AN INSTRUMENT FOR REGIONAL DEVELOPMENT
CONCEPT AND MAIN THEORETICAL ASPECTS
Regional Development, Regional Dispari-ties and the Role of Infrastructure in Regional Policy
Introductory Remarks
On the Notions of "Region" and "Development"
Extent and Structure of Regional Dispa-rities in the Member Countries of the European Community
(a) Income Disparities (b) Employment Disparities (c) A Final Remark
Analysis of the Causes of Regional Disparities
<a> The Neo-Classical Approach (b) The Export-Base Approach
(c) Theories Based on the Polarization Hypothesis
(d) The Social Overhead Capital Approach (e) The Meso-Structure Approach
Conclusions for a Regional Development Strategy and the Role of Infrastructure
Page
2 4 8 23 28
30
30 33
37
37
37
37
41 41 48 50
51
52
54
55 57 59
I I I.
III.1. III.2.
III.3.
III.4.
IV.
IV .1 •
IV.2.
IV.3.
v.
VI.
VI .1 •
VI.2.
VI. 3.
VI. 4.
Page The Regional Development Potential
Approach 62
Basic Hypothesis and Assumptions 62 Potentiality Resources as Bottleneck
Factors 71
Factors Determining Relative
Competitiveness 73
A Digression: Agglomeration Economies
and Minimum Capacities 75
Infrastructure as a Determinant of Regional Development Potential
("Potentiality Factor"> 87
Definition of Infrastructure and its
Characteristics 87
(a) The Dual Nature of Infrastructure:
Capitalness and Publicness 87 (b) Basic Public Services and Development
Infrastructure 89
(c) Development Infrastructure and
Private Capital Assets 91 (d) Band Infrastructure, Point
Infra-structure and InfraInfra-structure
Subsystems 93
(e) Public Human Capital as
Infra-structure 94
(f) A List of Regional Development
Infra-structure Categories 96
Infrastructure Services as a Combination
of Capital and Labour Inputs 97 Evaluation of the Relative Degree of
"Infrastructureness" and Ranking of
Infrastructure Categories 100
Summary Presentation of the Basic Characteristics of Infrastructure
(Infrastructureness> in Matrix Form 112
The Efficacy of Infrastructure as an
Instrument for Regional Development 114
The Suitability of Infrastructure as an
Instrument for Regional Development 114 The Conditions for a Successful
Infra-structure Policy 116
Consequences of Price- or Fee-Financing
of Infrastructure 120
A Possible Rejoinder: Infrastructure as a Consequence but not a Cause of Regional
P A R T T W 0
REGIONAL ENDOWMENT WITH INFRASTRUCTURE AND ITS CONTRIBUTION TO REGIONAL
DEVELOPMENT
Page
EMPIRICAL ANALYSIS 127
VII.
VIII.
VIII.1.
VIII.2. VIII.3.
IX.
I X .1 •
IX.2.
I X .3. IX.4.
X.
X .1 •
X.2.
X.3.
X.4.
Introductory Remarks
Definition and Calculation of Infra-structure and Development Indicators
Definition, Standardization and Normalization of Indicators
Regional Delimitation and Data Problems Infrastructure Categories Retained for the Analysis
Infrastructure Endowment of the EC-Regions
Infrastructure Analysis Based on the Maximum-Minimum-Ratios
The Infrastructure Indicators of the Community Analysis and their Regional Distribution
A Simple Cluster Analysis
Analysis of the Correlation between Infrastructure and Regional Development Indicators
Infrastructure as a Capital Input in a Regional Production Function
A Simple Infrastructure Production Function
Infrastructure as the Capital Element in a Modified Cobb-Douglas Production Function
Fully Specified Potentiality Factor Quasi-Production Functions
Infrastructure Bottlenecks and Excess Capacities
127
128
128 131
136
144
144
150 200
208
223
223
232
260
XI. Results and Conclusions of the National Reports on the Contribution of Infra-structure to Regional Development
X I. 1 •
XI. 2. X I. 3. XI. 4.
XI. 5. XI. 6. X I. 7. XI. 8. XI. 9. XI.10.
XII.
XII.1. XII.2.
Introduction
Summary of the Belgian Report Summary of the German Report Summary of the Danish Report Summary of the French Report Summary of the Greek Report Summary of the Irish Report Summary of the Italian Report Summary of the Dutch Report Summary of the British Report
Policy and Research Conclusions
Policy Conclusions
Conclusions for Future Research
A P P E N D I X
Summary of a Report on the Contribution Infrastructure to Regional Development. A Case Study on Spain and Portugal
A N N E X
Available as a Companion Volume
of Page
347
347 348 354 363 365 372 376. 379 385 395
398
398 406
S U M M A R Y 0 F T H E R E P 0 R T
I. AIM AND SCOPE OF THE STUDY
In October 1979, the Commission of the European Commu-nities established a Study Group in order to investiga-te the contribution of infrastructure to regional development. The Group presented a first version of its final Report in June 1982 and a revised version in June 1984. The study should help the Commission and the member countries in better assessing the role of infrastructure and in setting priorities for subsidi-zing infrastructure in the framework of Community regi-onal policy.
II. INFRASTRUCTURE AS A DETERMINANT OF REGIONAL DEVELOPMENT POTENTIAL
The first part of the Report starts with a brief analy-sis of regional disparities and their causes, and infrastructure is identified as being one of them. As a result of a rough summary of existing views, the deve-Lopment potential approach is chosen and extended in order to analyse the contribution of infrastructure to
regional development.
Infrastructure is seen as a part of the overall capital equipment of a region, namely that part characterized by relatively high degrees of "capitalness" and "publicness". The Latter terms refer to the properties of immobility, indivisibility, non-substitutability, and polyvalence. These properties, albeit in differing degrees, can be used in order to classify the different infrastructure categories.
its capacities are fully utilized or even In the long run, especially location and may become more important as determinants medium run if
overutilized. agglomeration of regional endowments can
development because infrastructure be changed by obsolescence and invest-ments.
Given the capitalness property of infrastructure, des-pite a high degree of non-substitutability in general, it is possible to use some infrastructure categories to a certain extent in order to compensate for unfavoura-ble endowments with the other potentiality factors. A.
"bad" regional Location can e.g. be improved by a bet-ter transportation infrastructure which reduces communication costs for peripheral regions. A spatial concentration of infrastructure can also help the growth of underagglomerated regions or regional
cen-ters.
Basically, actual income, productivity and employment can only reach their potential levels determined inter alia by the regional infrastructure endowment, if the potentiality factor capacities are optimally utilized by private capital and qualified labour, including entrepreneurial capabilities. This allows two important conclusions for regional policy measures: regions with a comparably low degree of infrastructure capacity utilization need more private capital and qualified labour in order to more fully exploit the existing development potential; regions showing a relative over-utilization or bottleneck of infrastructure need public investments to increase their infrastructure capacity.
of the level of regional development. These basic or sovereignty infrastructure facilities should, therefore, not be subsidized by regional policy and especially not by the Regional Fund of the Community.
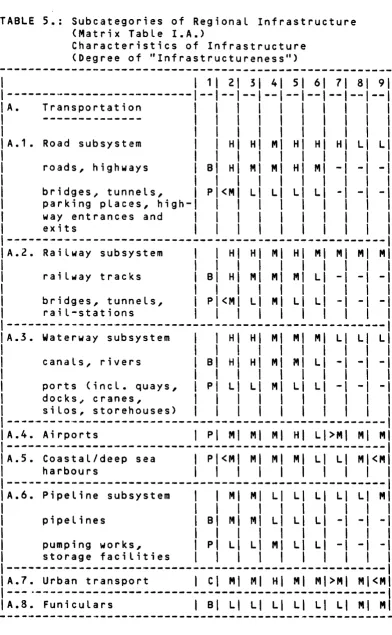
The List of infrastructure categories retained by the Group is presented as MATRIX TABLES I. A. and I. B. Ccf. TABLES 5 and 6J in the Report. Infrastructure categories are classified there on the basis of a ten-tative evaluation according to decreasing degrees of publicness and in combination with the additional criteria of price excludability <e.g. fee financing>,. their complementary relation with other infrastructure categories <system effects>, their degree of Labour intensity and the required degree of labour qualifications needed in order to use these capacities efficiently.
III. MAIN RESULTS OF THE EMPIRICAL ANALYSES
The statistical problems faced by the Group when trying to collect comparable data for all the infrastructure categories retained for the 141 regions of the Community have been much more serious than anticipated. The Group had, therefore, to invest much more time and effort than originally expected in data collection and in checking comparability. As a consequence, not all types of analysis which should have been done could be realized. In addition, non-available data and lack of comparable data may have affected the results especially of the econometric estimates which certainly could have been better if the statistical data base would have been more reliable. Despite these problems, the empirical results based on the methodology develo-ped in the first part of the study merit serious consi-deration.
In the present summary, only a small selection of the findings can be given which naturally cannot cover all the wealth of information and insight gained.
A first series of analyses is based on the values obtained for the total infrastructure indicator IGES. This indicator is derived as follows: First, the indicator value for each subcategory of infrastructure is standardized and normalized in order to obtain a figure of 100 for the best equipped region and to measure all other regions in percent of this best equipped one. Second, the algebraic mean of these subindicators per region is then used to calculate the indicator for each main infrastructure category A-L. Third, these main category indicators are aggregated in order to obtain the geometric mean for IGES. The geome-tric mean has been chosen because it implies limited substitutability of the main categories.
A first rough comparison of total infrastructure endow-ment measured by IGES according to the National Reports yields an interregional distribution of infrastructure which can be characterized by calculating the Maximum-Minimum-Ratio <MMR>. MMR varies between 1.3 and 3.5 in the two cross sections chosen, i.e. 1970 and 1978 Ccf. TABLE 9J. This simple distribution measure, though not capable in taking account of the distributi-on in-between the extreme values, nevertheless informs about the total span. MMR for the different main categories are larger; they increase upto infinity if one region really does not possess an equipment with the special infrastructure category retained for the analysis. In these cases ">100" is used. Very high MMR are obtained for Natural and Cultural infrastructure; relatively high values appear for Energy Supply, Urban infrastructure and Water Supply in some countries. Medium level disparities were observed for Health, Sports/Tourism, Social infrastructure and Transportati-on. If the values for the two cross section years are compared, disparities tend to decrease.
five in the second year for which the indicator values range from 0 to 100 as indicated by ">1000". Very low MMR are obtained for Health (3.9/4.0>. In general, again disparities tend to decrease from the beginning to the end of the seventies. If coefficients of varia-tion are used as a distribution measure, disparities become smaller, too. In addition, these coefficients indicate that the in-between distribution has improved.
Additional insights are gained if all regions are grou-ped into five classes whereby each class covers 20 percentage points Ccf. TABLE 15J. In general, the. highly agglomerated, urbanized and richer regions exhi-bit a better infrastructure endowment than other regi-ons, particularly when compared with rural, sparsely populated and peripheral poor regions. One country (Italy) shows the Largest spread since its regions are to be found in all five classes, whereas others (e.g. Belgium, United Kingdom and Greece> only cover two quintiles and Ireland even only one, the Lowest
quinti-Le.
As a result, overall disparities decrease both as far as the span of the distribution and the in-between changes of relative positions are concerned. But at the same time, a majority of regions improve considerably their relative positions, whereas a minority, unfortu-nately belonging to the Less well developed member countries, could not keep pace with the general deve-Lopment.
The quasi-production function concept is then applied to a restricted set of roughly comparable data covering as much regions as possible across the whole Community in order to explicitly test what infrastructure contri-butes to regional development measured in terms of
income per capita, per employed person or emplopyment. The results of a very large number of functions estimated for three different types of regional produc-tion funcproduc-tions (simple infrastructure quasi-production functions, modified Cobb-Douglas functions, fully specified quasi-production functions) can be roughly summarized as follows Ccf. TABLES 18 to 22J:
<1> With a few exceptions, infrastructure measured in form of indicators for main categories or for total infrastructure endowment (IGES) is a significant exogenous variable for explaining regional development in terms of income per capita, productivity per employed person and different employment indicators. In general, regional development is higher the better a region is endowed with infrastructure.
<2> The estimated contribution of infrastructure to regional development declines if the other potentiality factors, Location, agglomeration and sectoral structure are explicitly introdu-ced into the production functions. Infrastructure nevertheless remains significant in the large majority of cases. This supports the theoretically derived proposition that infrastructure is one of the main determinants of regional development, but that the other determinants exert significant influence, too. Regional development, therefore, cannot be based on infrastructure policy alone.
(3) Infrastructure endowment is a better explanator of regional income and productivity than of employment. This may be due to the fact that income per capita and productivity reflects both the contribution of infrastructure to absolute income and employment, and that the employment effect is not independent of the income effect. In addition, the awkward problem of defining 11active11 persons especially in case
(4) The existing interregional differences in infrastructure endowment are larger than disparities in actual and potential income per capita. If Berlin and Groningen due to their special economic situations and Irish regions due to some data problems are disregarded, infrastructure disparities e.g. in the first year are as large as 6.6 MMR (Noord-Holland 100:15.17 Thrace>, whereas actual income MMR is 5.8 (4030 ECU Hamburg: 693 ECU Thrace) and potential income MMR 4.1 (3274 ECU Koeln: 795 ECU Thrace>. Similar results are shown for productivity. That actual disparities in income and employment can be expected to be larger than potential ones is explained by the fact that highly developed regions normally also have higher rates of infrastructure utilization whereas Less developed regions generally show
lower utilization ratios.
The potential income and productivity estimates are obtained under the assumption that the explicitly mea-sured regional production capacities are combined with all the other "private" factors of production in the traditional meaning of e.g. entrepreneurial capabili-ties, private human and material capital, and qualified
labour. These estimates are implicitly based on a sort of "normal" or "average" rate of utilization of regional capacities. The difference between actually observed and estimated "potential" income can,
therefo-re, be interpreted to represent a rough indicator for relative capacity utilization. A region is said to underutilize its production potential if actual income is lower than potential income, and to overutilize it if the reverse is true.
The main findings of this analysis can be summarized as follows (cf. TABLES 23 to 35]:
(1) Richer regions tend to utilize their
infra-structure capacities more intensively than normal, whereas poorer regions in general show a relative underutilization. There are, howe-ver, notable exceptions.
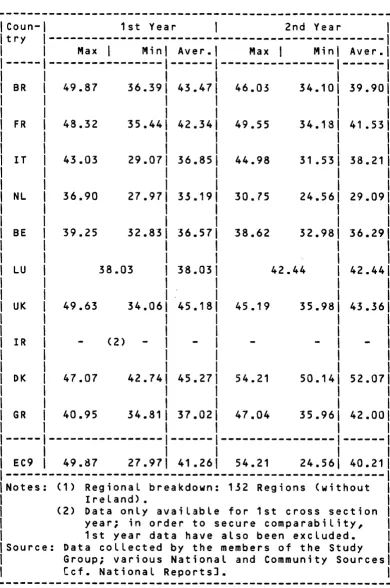
(2) Relative underutilization or overutilization ranges from -36% to +70% in the first year, Irish regions included, or from -24 % to +51% without them. The figures for the second year are -33% to +43%, Irish regions included that no longer represent extreme cases. The higher values of the first year may be partly caused by data problems. Potential productivity
figu-res are similar, although the difference bet-ween lowest and highest utilization rates is smaller <-23% to +59% in the first and -29% to +36% in the second year). This asymmetrical distribution of utilization ratios seems to be a special characteristic of infrastructure because it appears also if other production functions are used.
(3) The relative excess capacity or bottleneck situation of a region does not only seem to be determined by its level of development in rela-tion to say a Community average, but also in relation to the economic position of a region in the national context. This can be inferred from the fact that among the regions with relatively high rates of under- or overutiliza-tion, there are regions both from poorer and from richer member countries.
infrastructure investment in the better developed regi-ons.
However, this simple two-tier strategy has to be quali-fied in several respects:
First, the apparent underutilization of infrastructure can have its cause in a relatively inferior endowment with other potentiality factors so that infrastructure excess capacities have to compen-sate deficits in other resource endowments. ~ high equipment with transportation and communica-tion infrastructure can e.g. compensate for a peripheral location.
Second, there may be a certain "minimum capacity" which is required if a region should reach the stage of self-sustaining growth. Less developed regions may, therefore, have relatively higher infra-structure needs. than already more developed ones.
~~ .. • .. . : 0
Third, the parti~~[ar characteristics of each region must also be~taken into account. A mountain regi-on e • g • nee d·s more road k i lome t e r s per square
k i l om e t e r i· n~ ·. o r de r to s e c u r e m i n i mum a c c e s s to all of its c~h,ers compared with a region situa-ted in the pl.afn or profiting from a good coastal position with!m~ny natural harbours.
Whereas the second ·and the third argument could not be analysed in more detail by the Study Group, the first one has been put to test. The basic idea is as follows:
Infrastructure bottlenecks may exist side by side with bottlenecks or with excess capacities of other factors, and the same applies for infrastructure excess capacities compared with bottlenecks of other resour-ces. Whether or not a region can be allocated to one of these four cases, can be checked by comparing relative rates of under- or overutilization estimated with the aid of a singular infrastructure production function on the one hand and a fully specified potentiality functi-on functi-on the other.
The main results and the conclusions that can be drawn from these results for income per capita CBEPO> can be summarized as follows Ccf. TABLES 29 and 36 to 38J:
(1) The results obtained with the aid of the fully specified potentiality factor function are in general compatible with the results obtained with the singular infrastructure function. Rates of relative under- or overutilization range between -23% and +42% in the first and -27% and +43% in the second year. The asymmetrical distribution appa-rently still exists, although, it is less pronounced, especially in the first year, compared with the singular functions.
(2) Regions showing relative underutilization or overu-tilization both of infrastructure and of total development potential most frequently remain in their category from the first to the second year.
(3) Regions showing utilization rates inside a band of
(4) In a Large number of cases, the degree of relative over- or underutilization is reduced if the full set of potentiality factors is explicitly taken into account. This supports the hypothesis that infrastructure partly compensates for a bad endow-ment with other resources. On the other hand, an
infrastructure deficit in a better developed region can be compensated by a relative better endowment with those other factors.
In summing up, the experiment to interprete differences between actual and estimated "potential" incomes as.
indicators of relative under- or overutilization of existing infrastructure and total resource endowments offer plausible results. A much more differentiated picture as to types of regional problems can be obtained if this method is adopted. Despite the many statistical problems, the results in general seem to be reliable.
IV. POLICY AND RESEARCH CONCLUSIONS
The results presented in the Study are to be evaluated from its special context. The task assigned to the Study Group was both a difficult one and a restricted one at the same time as far as the analysis of only one instrument of regional policy, namely infrastructure is concerned. The difficulty also arises from the fact that we do not possess a general theory of infrastruc-ture or of determinants of regional development poten-tial in general. The statistical and data collection problems have been much greater than anticipated and the Group had to devote much more of its scarce rese-arch time for solving these problems. As a consequence, the results and the conclusions of this Study only represent a first step towards the analysis of the contribution of infrastructure to regional development. It is, nevertheless, the first time that both a theoretical approach intended to define and measure infrastructure in its effects, and an empirical inve-stigation as to the possibilities of quantifying these concepts for all European regions has been undertaken.
(1) In general, infrastructure does contribute to regional development. Even if the problems of demand versus supply influences could not be fully dealt with, it follows from the infra-structure properties of capitalness and publicness that there exists a significant supply-side effect.
As has been demonstrated, the better the infra-structure endowment, the higher is regional development measured in terms of income, pro-ductivity and employment. An infrastructure policy, therefore, remains an important element of regional policy, be it on a local, regional, national or a Community level.
<2> There is no similarly clear-cut answer to the question of whether or not different infrastructure categories exercise different influences on regional development. On the one hand, the statistical problems prevented a more detailed analysis in this respect and on the other hand, more hypotheses need to be developed in order to better understand the role of individual infrastructure categories in regional development.
(3) Infrastructure is one of the four main determi-nants of regional development potential, the other three being location, agglomeration, and sectoral structure. This supports the position of the Commission of the European Communities that comprehensive regional development
pro-gr~ms are needed in order to guide investment decisions and decisions on subsidizing them.
On the basis of these findings, a first policy conclusion would be to subsidize private factors of production in regions with excess capacities of infrastructure and infrastructure investments in bottleneck regions. There is, however, a number of qualifications to be con-sidered:
First, an infrastructure surplus region can need an infrastructure subsidization as well. An example are those regions that have an over-all resource deficit except in infrastructure and where infrastructure partly compensates this deficit. A second case covers all least developed regions possibly needing a m1n1mum capacity to be able to develop at all and where the existing capacity is below the minimum.
Second, the aggregate infrastructure indicator used may hide serious bottlenecks in individual infrastructure categories. Those are due to the possibility that substitutability between the individual categories of infrastructure is lower than implied by the aggregation procedure of the geometric mean.
Yet, there are also qualifications as to highly developed regions. They do not necessarily need an infrastructure expansion if only infrastruc-ture is in deficit, but compensated by a better endowment with e.g. location or agglomeration. Another reason for not automatically enlarging infrastructure bottlenecks is the relationship between high development and overagglomeration or congestion. Given the importance of a policy intended to protect the environment and to reduce the deleterious effects of pollution and congestion in densely populated areas, the policy conclusion as to infrastructure expansion should not only be taken on the basis of the relative rate of overutilization.
households in cases where the costs of creating new infrastructure facilities providing the same economic advantages would be higher compa-red with the direct aids to be paid.
A special case for subsidization can be made in the context of innovation policy. If a region is disadvantaged because it has too many old and declining industries, it may be an effi-cient policy to subsidize a transfer of know-how concerning business management, explo-itation of new markets, adoption of new technologies and the use of patents. This does not imply that new bureaucratic institutions have to be created. On the contrary, this would justify a subsidization also of certain kinds of privately marketable services e.g. for small and medium size enterprises. In some cases, e. g. in mass transportation services, competition is distorted at the disadvantage of less developed regions by massive subsidization of the integrated railway, bus and underground transportation systems in highly urbanized and agglomerated regions.
(6) Finally, it must be stressed that infrastructu-re is but one category of the whole range of instruments which can be used to aid regional development. This implies that infrastructure should not be used as an isolated instrument, but always as an integrated part of a compre-hensive development strategy.
TABLE 1:
TABLE 2:
TABLE 3:
TABLE 4:
TABLE 5:
TABLE 6:
TABLE 7:
TABLE 8:
TABLE 9:
TABLE 10:
TABLE 11 :
TABLE 12:
L I S T 0 F T A B L E S
Page
Regional Domestic Product at Market 45 Prices per Inhabitant, (EC-Average
=100>, Conversion with European Units of Accounts
Regional Domestic Product at Market 46 Prices per Inhabitant, (EC-Average
=100>, Conversion with Purchasing Power Parities
Regional Labour Force Participation 49 Rates, in Per Cent
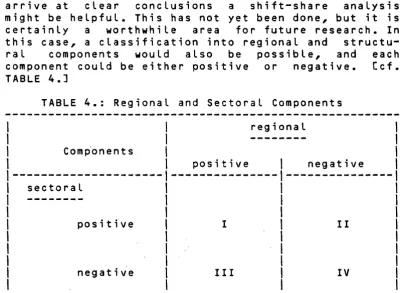
Regional and Sectoral Components 85
Subcategories of Regional Infra- 102 structure (Matrix Table I.A.>,
Characteristics of Infrastructure (Degree of "Infrastructureness")
Main Categories of Regional Infra- 109 structure <Matrix Table I. B.>,
Characteristics of Infrastructure (Degree of "Infrastructureness")
Comparison of Indicators Used in 138 National Reports and Community
Analysis
Correlation Between the Aggregate 143 National and Community Infrastructure
Indicator IGES
Maximum-Minimum Ratios <MMR> for 145 Infrastructure and Selected
Development Indicators according to National Reports
Infrastructure Indicators for 139 EC- 151 Regions, 1st and 2nd Cross Section
Years
Infrastructure Equipment of 139
EC-Regions, Best Equipped Regions 192
Infrastructure Equipment of 139
TABLE 13:
TABLE 14:
TABLE 15:
TABLE 16:
TABLE 17:
TABLE 18:
TABLE 19:
TABLE 20:
TABLE 21:
Page
Maximum-Minimum-Ratios (MMR> and 194 Coefficients of Variation (VC> for
Main Infrastructure Category
Indicators for up to 139 EC-Regions
Ranking of 139 EC-Regions According 195 to Infrastructure Indicator IGES, 1st
and 2nd Cross Section Years
Clustering of 139 EC-Regions According 201 to Aggregate:Infrastructure Indicator IGES for 1st and 2nd Cross Section Years
Correlation Coefficients for Linear 211 Relationships Between Income per
Capita and Infrastructure Categories for Both Cross Section Years According to National Reports
Adjusted coefficients of Determination 224 (RSQA) and Significance of Regression
Coefficients for Singular Infrastruc-ture Quasi-Production Functions with Selected Development Indicators, 1st and 2nd Cross Section Years
Modified Cobb-Douglas Production 234 Functions with Labour and
Infrastructure Capital for EC-Regions, 1st Cross Section Year
Modified Cobb-Douglas Production 235 Functions with Labour and
Infrastructure Capital for EC-Regions, 2nd Cross Section Year
Modified Cobb-Douglas Production 238 Functions with Labour, Infrastructure
Capital and Dummies for EC-Regions, both Cross Section Years
Selected Fully Specified Potentiality 266 Factors Quasi-Production Functions
TABLE 22:
TABLE 23:
TABLE 24:
TABLE 25:
TABLE 26:
TABLE 27:
TABLE 28:
TABLE 29:
Page
Selected Fully Specified Potentiality 268 Factors Quasi-Production Functions
(QPF> (Income Density, Sectoral Income per Employed Person>, 1st and 2nd
Cross Section Years
Infrastructure Bottlenecks and Excess 273 Capacities Estimated for BEPO with the Aid of Singular QPF for Infrastructure (IGES> and Country Dummies, 1st Cross Section Year
Infrastructure Bottlenecks and Excess 277 Capacities Estimated for BEPO with the Aid of Singular QPF for Infrastructure (IGES) and Country Dummies, 2nd Cross Section Year
Ranking List of Regions with Relative 282 Underutilization and Overutilization
of Infrastructure (Singular
BEPO-Functions>, ·.1st and 2nd Cross Sect-ion Years
Infrastructure Bottlenecks and Excess 289 -Ca~acities Estimated for BEEM with the
Aid of Singular QPF for Infrastructure (IGES) and Country Dummies, 1st Cross Section Year
Infrastructure Bottlenecks and Excess 293 Capacities Estimated for BEEM with the Aid of Singular QPF for Infrastructure (IGES) and Country Dummies, 2nd Cross Section Year
Ranking List of Regions with Relative 298 Underutilization and Overutilization
of Infrastructure (Singular SEEM-Functions>, 1st and 2nd Cross Section Years
Infrastructure Over- or Underutili- 304 zation and Potentiality Factor
TABLE 30:
TABLE 31:
TABLE 32:
TABLE 33:
TABLE 34:
TABLE 35:
TABLE 36:
TABLE 37:
Page
Infrastructure Bottlenecks and Excess 306 Capacities Estimated for BEPO with the Aid of Fully Specified Potentiality
Factors QPF Including Infrastructure CIGES> and Country Dummies, 1st Cross Section Year
Infrastructure Bottlenecks and Excess 310 Capacities Estimated for BEPO with the Aid of Fully Specified Potentiality Factors QPF Including Infrastructure CIGES) and Country Dummies, 2nd Cross Section Year
Ranking List of Regions with Relative 315 Underutilization and Overutilization
of Regional Development Potential
(Multiple BEPQ-Functions>, 1st and 2nd Cross Section Years
Infrastructure Bottlenecks and Excess 319 Capacities Estimated with the Aid of
Fully Specified Potentiality Factors QPF for BEEM Including Infrastructure
CIGES> and Country Dummies, 1st Cross Section Year ·
Infrastructure Bottlenecks and Excess 323 Capacities Estimated with the Aid of
Fully Specified Potentiality Factors QPF for SEEM Including Infrastructure
CIGES> and Country Dummies, 2nd Cross Section Year
Ranking List of Regions with Relative 328 Underutilization and Overutilization
of Regional Development Potential
(Multiple SEEM-Functions>, 1st and 2nd Cross Section Years
Frequency Distribution of Utilization 334 Rates of 118 EC-Regions
Comparison Between Regional Rates of 337 Utilization on the Basis of Singular
[image:29.552.84.481.73.734.2]TABLE 38:
TABLE 39:
TABLE 40:
TABLE 41:
TABLE 42:
TABLE 43:
TABLE 44:
TABLE 45:
TABLE 46:
TABLE 47:
TABLE 48:
TABLE 49:
Page
Comparison Between Regional Rates of 341 Utilization on the Basis of Singular
Infrastructure QPF (BPR012> and on the Basis of Fully Specified Potentiality Factors QPF (BPR022> 2nd Cross Section Year
Minimax-Ratios par categorie d'infra- 349 structure en Belgique, 1970 et 1979
Modifications dans les dotations 352 infrastructurelles entre 1970 et
1979 en Belgique
Ameliorations et deteriorations dans 353 les dotations infrastructurelles en
Belgique 1970 ~ 1979
Maximum-Minimum-Ratios (MMR> of 356 Main Infrastructure Category
Indi-cators for 37 German Regions <with-out Berlin), 1970 and 1978
Maximum-Minimum Ratios (MMR) of 360 Development and Potentiality Factor
Indicators for 37 German Regions (without Berlin>, 1970 and 1978
Maximum-Minimum Ratios of Infra- 366 structure Endowment, France 1970-75
and 1975-80
Maximum-Minimum-Ratios of Main 380 Infrastructure Categories and
Development Indicators in Italy
Results of the Estimation of Quasi- 381 Production Functions
1970-74 and 1975-79 in Italy
Results of Factor Analysis of Infra-structure Endowment in Italy
Regression of Development Indicators on Rotated Factors (1970-1974>
in Italy
Classification of Dutch Provinces According to Weak and Strong
Infrastructure Endowment
383
384
L I S T
0 F F I G U R E S A N D M A P SPage
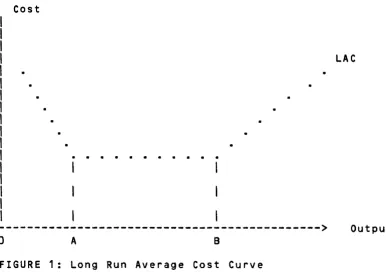
FIGURE 1: Long Run Average Cost Curve 77
FIGURE 2: Influence of Agglomeration on the 78 Efficiency of Other (Potentiality>
Factors
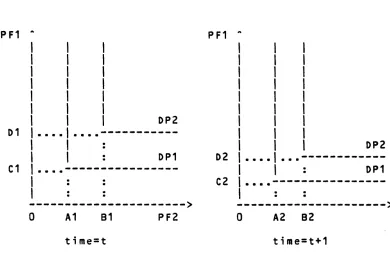
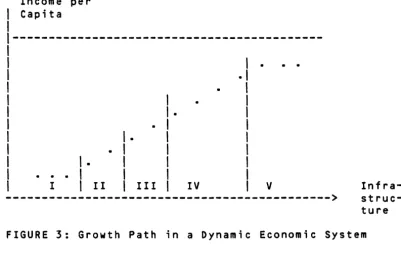
FIGURE 3: Growth Path in a Dynamic Economic 84 System
FIGURE 4: Frequency Distribution of Infrastruc- 203 ture Indicators IGES, 1st and 2nd Cross Section Years for 139 EC-Regions
MAP 1: Infrastructure Equipment in 139 EC- 204 Regions, 1st Cross Section Year
MAP 2: Infrastructure Equipment in 139 EC- 205 Regions, 2nd Cross Section Year
FIGURE 5: Scattergram of Correlation for Income 215 per Capita (BEP001> and Transportation Infrastructure CINDA01)
FIGURE 6: Scattergram of Correlation for Income 216 per Capita (BEP001> and Communication
Infrastructure CINDB01>
FIGURE 7: Scattergram of Correlation for Income 217 per Capita (BEP001> and Environmental
Infrastructure (INDE01>
FIGURE 8: Scattergram of Correlation for Income 218 per Capita (BEP001> and Social
Infrastructure (INDJ01>
FIGURE 9: Scattergram of Correlation for Income 219 per Capita (BEP002> and Communication
Infrastructure <INDB02>
FIGURE 10: Scattergram of Correlation for Income 220 per Capita (BEP002> and Natural
Infrastructure (INDL02>
FIGURE 11: Scattergram of Correlation for Income 221 per Capita (BEP001> and Aggregated
Page
FIGURE 12: Scattergram of Correlation for Income 222 per Capita (8EP002) and Aggregated
Infrastructure Indicator (IGES02)
FIGURE 13; Scattergram of Correlation for Income 263 per Capita (BEPO) and Distance (fNTGKM>
MAP 3: Distribution of Total Aggregate 358 Infrastructure Indicator INGE for 1978
in Germany
MAP 4: Distribution of Total Aggregate 359 Infrastructure Indicator XNGE for 1978
in Germany
FIGURE 14: Infrastructure Endowment and Deve- 367 lopment in France
FIGURE 15; Infrastructure Stock and Development 369 on a Per Capita Basis in France
I N T R 0 D U C T I 0 N
I. AIM AND SCOPE OF THE STUDY
I.1. ASSIGNMENT OF THE STUDY GROUP
In November 1979, the Directorate General for Regional Policy established a group of experts and asked them to study the contribution of infrastructure to regional development. This decision must be seen within the context of the regional policy of the Community. Accor-ding to the regulation of the Council of the European Economic Community No. 274/75 of 18th March 1975, which established the European Regional Development Fund CERDF>, subsidies for infrastructure investments were limited to those infrastructures which were directly linked·with the development of industrial, handicraft and service activities. This regulation has been amen-ded by the Council Regulation No. 214/79 of 6th February 1979 to include a wider range of infrastructu-re categories which ainfrastructu-re eligible for Regional Fund aid. According to the amended Regulation, the ERDF can sub-sidize infrastructures which "contribute to the development of the region or area in which they are situated", provided that they are justified by a regio-nal development program. In cases where these projects are of "particular importance" to the development of the region or area concerned, the matching ratio could also be 40% instead of 30% of the investment expenditure, which was fixed as a maximum at that time.
It is in this context that the Study Group has been asked to give its advice to develop a general methodo-logy which can be used to identify the contribution of infrastructure to regional development and to present a first quantitative evaluation of this contribution to productivity, income and employment. The Study should also enable the Commission to facilitate the setting of priorities for infrastructural intervention, not only for the ERDF, but also for the other financial instru-ments of the Community such as the New Community Instrument for Investment Financing CNIC>, the European Investment Bank CEIB> and the European Monetary System (EMS> interest rebates which may also participate in favour of infrastructure investments in the less deve-loped regions.
The assigned task of the Study Group, therefore, is to develop a methodology which can be applied to identify those types of infrastructure which contribute to regional development, and in which . the Regional Fund and other financial instruments of the Community may participate. This includes an attempt to develop an inventory of the actual infrastructure endowment of European regions in order to show the differences be-tween them and the deficiencies in the endowment of the less favoured ones. Finally, the analysis should help to quantify the impact of differences in infrastructure equipment on regional productivity, income and employ-ment, and to draw meaningful conclusions as to the design of a Community infrastructure policy.
Since the establishment of the Study Group signifiant progress has been made in the field of regional policy. In the Communication of the Commission to the Council of 24th July 1981 new regional policy guidelines were formulated. According to these, "the best way to solve regional problems is to improve competitiveness and productivity throughout the entire European economy." First priority will have to be given to the creation of new productive jobs and to raising productivity gene-rally by realizing more fully the indigenous regional development potential of the European regions.
Communi-ty regional policy and other instruments on the one hand and Community and national regional policy on the other. The regional development programs to be submit-ted to the ERDF by the member states are to be extended in order to explain more clearly, and in a more opera-tional manner, the Link between Community and national measures and their contribution to the development goals. The infrastructure and investment programs will form a part of these regional development programs. In summarizing, the Commission states that its regional activities will have to change from "the functioning of a financing body to those more clearly identified with a development agency ...
In order to give substance to these guidelines the Commission proposed to the Council on 26th October 1981 another amendment to the ERDF regulation of 1975. As far as infrastructure is concerned the Commission expressed its intention of gradually replacing the system of financing individual projects by a system of financing programs. According to Article 7 of the new regulation, infrastructures to be financed under investment programs will have to contribute to the development of the region or the area in which they are located. In the application for Fund assistance submit-ted the member states will have to state what the infrastructure investment contributes to the development of a region in question (Article 14, pre-viously Article 7>. The ERD~ financial participation will be equal to 30 per cent of the total investment costs if there are less than 5 million ECU, or between 10 per cent and 30 per cent if the project is more expensive (Article 12 modifying former Article 4/2).
I.2. SCOPE AND METHODOLOGY OF THE STUDY
Whilst it would have been an extremely interesting task to formulate the framework for a broad based regional policy which would contribute to convergence inside the Community, the Group has been asked to deal with only one important instrument of such a policy, infrastruc-ture or social overhead capital. Nevertheless, this task requires a comprehensive approach such that the contribution both of infrastructure as one instrument of regional policy and of regional policy as one of many policies available at the Community and national levels, may be adequately evaluated. The Group, there-fore, adopted the following terms of reference for its work:
(1) The Group took as given the explicit and implicit policy goals contained in the Community documents discussed above. These can all be subsumed under the general heading of convergence, as has already been formulated in the 1977 and 1981 regional policy guidelines of the Commission. Accordingly, the contribution of infrastructure to regional development is taken as meaning a contribution to more convergence between European regions. More convergence is equivalent to Less regional dispari-ty. It appeared useful, therefore, for the Group to commence its work with a brief description of the existing disparities between regions.
<2> If infrastructure is to be used as an instrument for the promotion of convergence or the reduction of disparities, then the particular role of infrastructure as a determinant of regional deve-lopment must be analysed. Since the Group was asked to make an operational cqntribution, it had to develop a theoretical concept which would facilita-te the identification of infrastructure and its contribution to the accepted goals. In addition, a simplified measurement system was required which, even though it cannot reflect all the facets of the theoretical construct, does permit a first approxi-mate quantitative evaluation.
contribution of the quantities and qualities of the "serv;ces" inherent in the different types of infrastructure. On the one hand, these infrastruc-ture services require complementary labour inputs, and on the other they also depend on the existing demand for those services. A fully articulated theoretical approach would have required the con-struction of a highly differentiated model to be used for assessing the contribution of infrastructure. However, given the financial and time constraints, the Group was not able to undertake this task. It decided, therefore, to concentrate on the infrastructure capacity or supp-ly aspects. They are of particular importance if we wish to examine areas such as the contribution of infrastructure to productivity and employment.
(4) The results which can be obtained with the aid of an appropriate measurement system always depend on the quality and comparability of the statistical data available. It has to be admitted that, when commencing its work, the Group underestimated the inherent difficulties in the statistical field. Much more time than anticipated had to be devoted to the selection and collection both of appropriate infrastructure indicators and of data which can be used as development indicators with a view to esta-blish a link between the two data sets. In consequence, it did not prove possible to undertake the full range of analyses originally intended, and the poor quality of many data also prevented a more detailed analysis. This also implies, as will be shown in the second part of this Report, that the results differ strongly between member countries and that it is difficult to reconcile some of the findings from a purely theoretical point of view. To a large extent data difficulties can explain these otherwise rather surpr1s1ng results. But there remains much which can be demonstrated with the aid of an imperfect data base. This is the first time that such a large data set has been constructed for all European regions, and it is now awaiting further refinement and additional analy-sis.
<S> In order to accomplish the defined tasks, the Study has been broadly divided into a theoretical and an empirical part. These are some of the theoretical issues to be dealt within the first part:
What criteria can be used to separate develop-ment infrastructure from non-development
infrastructure and from other types of 11public11
facilities and what infrastructure categories are involved?
What is the role of infrastructure as an instrument of regional policy and which regio-nal development goals can be and/or should be pursued with this type of instrument?
To what extent can infrastructure types be considered as potential or actual bottleneck factors which, if they are lacking or crowded, limit the possibilities for regional develop-ment?
What is the relative contribution of various infrastructure categories to regional develop-ment?
What is understood at the conceptual level by "infrastructure of particular importance to the development of a regiojl"? ..,.
In the second part of the Report, an operational measu-rement system on the basis of the preceding theoretical approach is de~eloped. To apply this approach, the members of the Study Group had to engage in defining and collecting statistical data for the regions of their respective countries. These data will be used to construct infrastructure capacity indicators in order to describe relative infrastructure equipment of all regions in the European Community. The same indicators will then be entered as exogenous variables in quasi-production functions to obtain estimates for potential income, productivity and employment. Further-more, a special analysis will be undertaken to measure
relative infrastructure bottlenecks and excess capaci-ties.
The following tasks will form a section of the empiri-cal part of the Study:
Definition and calculation of infrastructure equipment indicators,
Identification and measurement of infrastructu~ re bottlenecks and excess capacities,
Evaluation of the results.
The final two chapters of the Report present summaries of the National Reports by the members of the Study Group and some policy and research conclusions.
Finally, this Report includes as an Appendix a summary of a special study on the contribution of infrastruc-ture to regional development in Portugal and Spain. This study was carried through by Dieter Biehl and Urban A. Muenzer with the assistance of Alfred Boltz and Peter Ungar after the Study Group had finished its work.
P A R T 0 N E
INFRASTRUCTURE AS AN INSTRUMENT FOR REGIONAL DEVELOPMENT
CONCEPT AND MAIN THEORETICAL ASPECTS
II. REGIONAL DEVELOPMENT, REGIONAL DISPARITIES AND THE ROLE OF INFRASTRUCTURE IN REGIONAL POLICY
II.1. INTRODUCTORY REMARKS
In this chapter of the Report, we want to discuss the following questions:
What is meant by "regional development"?
What are "regional disparities" and what is the extent and the structure of regional disparities according to the various theories of regional development?
What conclusions can be drawn from this analy-sis as to successful regional development strategies and as to the role of infrastructure within such a strategy?
Guided by these questions, first the notion of regional development is briefly discussed and some figures de-scribing regional disparities are presented. Then the
literature on the causes of regional disparities is roughly summarized and finally, some conclusions as to the role of infrastructure are drawn.
II.2. ON THE NOTIONS OF "REGION" AND "DEVELOPMENT"
We are accustomed to speaking about a "region" in rela-tion to geographical, political, cultural or economic characteristics. In principle then, 11region11 normally
means a set of spatial 11points" representing Locations
From the point of view of the present Study, it would seem desirable at first sight to delimit regions on the basis of infrastructure serv1c1ng areas, as the question to be answered is whether and to what extent differences in regional development are caused by dif-ferences in regional infrastructure investment or equipment. However, infrastructure is an abstract con-cept; there are roads, railways, electri·city supply networks, hospitals, schools and so on, which may or may not be considered to be a part of infrastructure. As the service areas of the different infrastructure categories differ (e.g. a road subsystem has a Larger service area than a primary school>, it seems to be difficult to define "the" infrastructure region. In addition, infrastructure is not the only factor influ-encing regional development.
It seems, therefore, preferable to start from the con-cept of "development" as a policy goal in order to define both notions simultaneously. In genera~ terms, development, whether it is on a local, a regional, a national or a Community-wide level, refers to changes in the Level and the composition of welfare over time. Such "growth" in the widest meaning of the term inclu-des all components of the welfare of the members of a society -goods and services (private and public), leisure, environmental quality, health, human relations, freedom and justice and anything else which conveys satisfaction to individuals, families or groups of people. However, such an all-embracing concept of welfare is not unambigously measurable for an indivi-dual, and aggregation over individuals is impossible. Even if we would replace the notion of welfare by a number of well-defined and measurable indicators, we could end up with an unnecessarily Large list. The reason is that a number of those indicators may simply represent.subissues and are taken up in a higher level indicator. As a consequence, it is possible to look for a restricted number of main indicators under which numerous subindicators can be subsumed.
have not yet been successful.
The next question to be asked then is what consequences this understanding of development has for the choice of the concept of "region11
• The answer is that a region is
to be defined to mean a spatial unit that can be considered to represent a bundle of resources with the aid of which income and employment can be produced. As employment represents the productive capabilities of the inhabitants of a region and as unemployment is considered to be a socially and politically undesirable wastage of human resources, the concept of a "travel-to-work" or "Labour market" region represents an appropriate definition of a region.
A Labour market region is based on the idea that a "central place" such as a Large city normally offers more jobs than its own inhabitants will be able to fill. Hence, a job surplus exists which attracts people interested in finding work but residing in smaller Local communities of the city's hinterland. If these daily commuter flows are used as indicators of functional Links between Local communities, an identity of resident and working population results. A similar idea underlies the socalled central place concept of Christaller and Loesch. They considered the intensity of using the particular services of a city or the spe-cial market Linkages between such a city and its hin-terland, as constituent elements in determining a regi-on as a hierarchical system of settlements.
Labour market regions may be Large for highly qualified Labour and they may be smaller for Less qualified wor-kers. As a result, the size of a Labour market region may differ according to Labour qualifications
conside-red, such that a sort of hierarchy again arises. A person may at the same time be a member of a smaller, a medium-sized and a Larger Labour market unit. Although this particular factor does not make the delineation of an appropriate region an easy task, the coincidence of Labour and income interests appears to be a good precondition for defining a region. Regional develop-ment would then relate to the growth of income and employment in so-defined Labour market regions.
infra-structure. Furthermore, the accessibility of most of the other infrastructure categories will also depend on transportation and communication facilities. Finally, the smaller a servicing area and the Larger a Labour market region, the more congruence will be achieved because a labour market region will then embrace a Large number of such infrastructure facilities. There is, therefore, no significant problem as to kindergartens, schools, general hospitals. The diffi-culty exists, however, e.g. for Large international airports and harbours or universities that are Located in one region but serve also other regions. But this does not generally invalidate the proposition that Labour market regions do represent reasonable proxies for infrastructure service areas.
Unfortunately, some of the difficulties reemerge if the statistical data problem is considered. Most frequent-Ly, available data refer to administrative units that are not necessarily congruent with Labour market regi-ons. As a consequence, administrative regions will have to be checked as to whether they seriously deviate from a functional region concept. If incongruence exists, it is possible to collect data at a Lower regional Level (e.g. a county Level> and to combine several of these Lower Level administrative units in order to obtain a higher Level functional unit. To give an example: The French and the Italian "program regions" are composed of a number of "Departements" respectively provinces for which data are available, and German planning pro-gram regions are each composed of a number of "Kreise".
If significant incongruence remains, infrastructure service areas may still be "cut through" by the borders of certain administrative units. As a consequence, the full capacity of an infrastructure facility will possi-bly be allocated to a region that is smaller or Larger than the true servicing area. If the region is smaller, a part of the infrastructure services are exported, if it is larger, the region will import some of those services from another area. This could weaken e. g. the correlation between infrastructure equipment and regio-nal income or employment, but will not invalidate the approach as such.
tar-gets. This is already difficult in a national context and even more difficult in a European context. For the present Study, it was agreed to simply measure the differences in regional income and regional employment and qualify these differences as "disparities". Stating that there are disparities among European regions does not imply that these disparities should be reduced to zero, but only that they should be reduced. This is in line with the spirit and the letter of the Treaties on which the European Communities are based.
II.3. EXTENT AND STRUCTURE OF REGIONAL DISPARITIES IN THE MEMBER COUNTRIES OF THE EUROPEAN COMMUNITY
<a> Income Disparities
Income, should conceptionally refer to total real inco-me, i.e. both pecuniary and non-pecuniary ("psychic")
income derived from net positive externalities such as climate, clean air and water, natural beauty of the Landscape, a good neighbourhood, and public goods. Unfortunately, such a comprehensive income concept is not operational. Normally, only the pecuniary part is measurable, and even pecuniary income figures are not always available in every country for all types of regions and for all periods. Many proposals have been put forward to fill this gap, either in form of a revi-sion of the existing system of social accounting or in developing a separate and independent system of "social indicators". However, as Long as these improved indica-tors are not yet available, we are obliged to measure with the aid of the present data sources, such as regional product per capita figures, as surrogates for the unavailable, all-embracing ideal indicators. In any case, real income figures would be preferable to money income figures even if they do not cover non-pecuniary income elements.
because of being important import harbours>, appear to have higher gross incomes per capita. But such net figures are not yet available. As far as the gross domestic product figures are concerned, they could have been replaced by more recent data for gross value added, calculated on a consistent basis for all regions of the Community by the European Statistical Office. These figures could first not be used, because they would have required a recalculation of all the indicators on which this Report is based and of all the regression functions estimated on the basis of the data collected by each member of the Study Group for the regions of his country. Second, the data collected by the experts do not always refer to the same regional breakdown as used by the European Statistical Office.
As far as the regional breakdown is concerned, it would have been desirable to use figures for "functional" regions which represent resonable socio-economic entities. Again however, data are not always available for such a type of region. The figures on which this Report is based refer mainly to the socalled Level-II regions of the Community. They are basically admini-strative regions, sometimes also combinations of admi-nistrative regions which form approximately a functional region as it is the case in the Italian and French "program regions". In the case of Denmark, Ger-many and Ireland, not the Level-II regions, but other
regions have been used. For Denmark, the 14 counties which have significant regional policy competences, have been used instead of the three regions contained in the level-II list. Since two of these counties together with the city of Copenhagen form the Copenha-gen region, a total of 12 Danish regions was obtained.