Cite this:Mol. BioSyst.,2015, 11, 2738
Exploration of the HIF-1
a
/p300 interface using
peptide and Adhiron phage display technologies
†
Hannah F. Kyle,abcKate F. Wickson,dJonathan Stott,dGeorge M. Burslem,ab
Alexander L. Breeze,acChristian Tiede,cDarren C. Tomlinson,acStuart L. Warriner,ab
Adam Nelson,abAndrew J. Wilsonaband Thomas A. Edwards*ac
The HIF-1a/p300 protein–protein interaction plays a key role in tumor metabolism and thus represents a high value target for anticancer drug-development. Although several studies have identified inhibitor candidates using rationale design, more detailed understanding of the interaction and binding interface is necessary to inform development of superior inhibitors. In this work, we report a detailed biophysical analysis of the native interaction with both peptide and Adhiron phage display experiments to identify novel binding motifs and binding regions of the surface of p300 to inform future inhibitor design.
Introduction
An emerging opportunity for anticancer therapy is to identify ligands which affect metabolic and cellular processes enabling the survival and growth of tumours.1Hypoxia is a hallmark of many solid tumours; the ability to adapt to hypoxic conditions is crucial to their growth and survival2,3and occursviaa coordi-nated homeostatic response domicoordi-nated by the transcription factor hypoxia-inducible factor 1 (HIF-1). Overexpression of HIF-1 in cancer patients has been associated with resistance to some therapies, increased risk of invasion and metastasis, and poor prognosis.4Inhibition of the HIF-1 pathway may therefore have
anticancer therapeutic utility.5
HIF-1 is a heterodimer made up of two subunits: HIF-1aand HIF-1b (also known as the aryl hydrocarbon receptor nuclear translocator, ARNT). With oxygen at normal physiological concentrations, HIF-1ais rapidly degraded mostlyviathe von Hippel–Lindau pathway (an oxygen-dependent process).6 Under hypoxic conditions, however, the stability and thus transcriptional activity of HIF-1a increases. HIF-1a can then translocate to the nucleus, where it forms heterodimers with HIF-1b and recruits transcriptional coactivator proteins; one of which is p300.7,8 Transcriptional activation by the HIF-1a/p300 complex leads to the hypoxic response cascade, resulting in expression of multiple genes (e.g., VEGF) that mediate angiogenesis, various metabolic
processes and cell proliferation and survival. In rapidly developing solid tumours, hypoxic conditions are generated; cancerous cells exploit this HIF-1 activated pathway to develop new vasculature which initiates the resupply of the tumour with oxygen.5
There has been considerable focus on inhibiting the hypoxic response, but this has been challenging because HIF’s function as a transcription factor is exerted predominantly through protein–protein interactions (PPIs), such as the HIF-1a/p300 interaction. Designing small molecule inhibitors of PPIs is challenging because the interfaces are generally large, and can lack well-defined pockets in comparison to enzyme active sites.9–12Using mutational studies, Clackson and Wells
demon-strated that a small subset of residues – termed ‘‘hot-spots’’ – tend to contribute much of the free energy of binding to many PPIs.13–16By focusing only on the hot-spots and not the full interface, the challenge of designing small molecule PPI inhi-bitors becomes less daunting. Consequently identification and characterization of PPI hot-spots represents a precursor to effective small molecule design.17
Several approaches to inhibit the HIF-1 hypoxic response pathway have been described, which can broadly be classified in to five categories:18(1) HIF-1amRNA expression,19(2) HIF-1a
protein translation,20–27(3) HIF-1aprotein degradation,28(4) HIF-1a
DNA binding29and (5) HIF-1atranscriptional activity; which fall in to two main groups, disruptors of HIF-1 dimerization30,31 and disruption of binding of co-activator proteins.30,32–37One approach
for inhibition of the HIF-1 pathway, which falls into the category of transcriptional activity inhibition, is to target the interaction between HIF-1aand the co-activator protein p300.5We and others have had some success in targeting this interaction using protein domain36anda-helix mimetics35,37as well as natural products,33 designed protein ligands (optimised from natural products)38and small molecule arylsulfonamides.39,40
aAstbury Centre for Structural Molecular Biology, University of Leeds, Woodhouse Lane, Leeds, LS2 9JT, UK. E-mail: [email protected] bSchool of Chemistry, University of Leeds, Woodhouse Lane, Leeds, LS2 9JT, UK cSchool of Molecular and Cellular Biology, Faculty of Biological Sciences,
University of Leeds, Woodhouse Lane, Leeds, LS2 9JT, UK
dAstraZeneca Discovery Sciences, Structure & Biophysics, AstraZeneca Darwin Building, Cambridge, Science Park, Milton Road, Cambridge, CB4 0WG, UK †Electronic supplementary information (ESI) available. See DOI: 10.1039/c5mb00284b Received 22nd April 2015,
Accepted 8th June 2015
DOI: 10.1039/c5mb00284b
www.rsc.org/molecularbiosystems
BioSystems
PAPER
Open Access Article. Published on 10 June 2015. Downloaded on 14/10/2015 16:08:37.
This article is licensed under a
Creative Commons Attribution 3.0 Unported Licence.
View Article Online
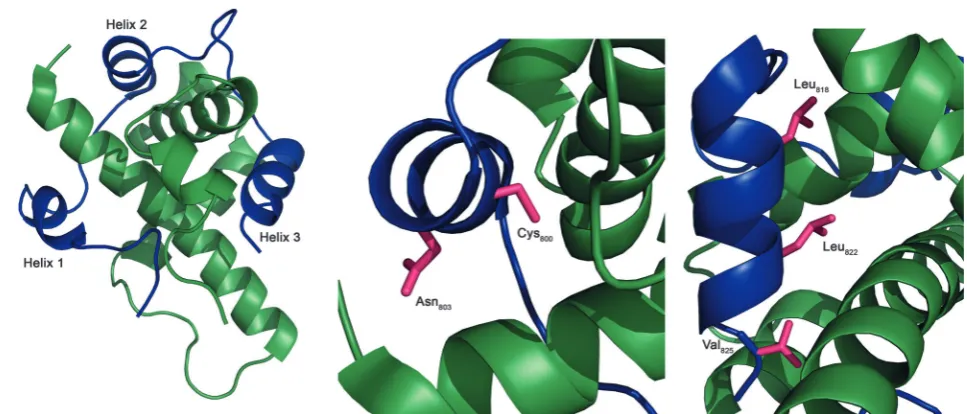
The structure of the complex of the CH1 domain of p300 bound to the C-TAD of HIF-1awas solved using multidimen-sional NMR methods (PDB IDs: 1L8C and 1L3E).7,8The NMR structure (Fig. 1) suggests that the interaction is complex: when bound, HIF-1aC-TAD consists of three distinct helical regions and wraps around the p300 CH1 domain.8A conventional small molecule41 could not cover the whole interacting interface; consequently a detailed understanding of the interface is necessary to inform inhibitor design. Mutational studies have proposed key binding residues of HIF-1a.42Helices 2 and 3 of the HIF-1aC-TAD have been shown to be required for binding; helix 2 contains two key residues: Cys800and Asn803,34,43,44and
helix 3 contains 3 key binding residues, Leu818, Leu822 and
Val825.42Additionally, other helix 3 residues have been suggested
to be important in the interaction (Asp823and Gln824).36,37Beyond
these mutational analyses, a number of studies provide contra-dictory conclusions as to the relative importance of various regions and residues on the HIF-1aC-TAD.36,37,42,45The binding potency of sequences derived from HIF-1aC-TAD (HIF-1a776–826,
HIF-1a786–826 HIF-1a788–8222 HIF-1a776–813) with p300 CH1 was
compared using fluorescence polarization.45 From this experi-ment it was concluded that the C-terminus of HIF-1a C-TAD is important for binding, in agreement with the mutagenesis studies.7,42However these data do not narrow down the inter-action area to one of the individual helices and the interinter-action area is still a relatively large surface area; therefore a single cluster of residues (hot-spots) that could be targeted for disruption has yet to be identified and small molecule design is still challenging. In this study we exploited two approaches to probe the HIF-1a
binding surface on p300, to refine our understanding of the most productive regions to target using designed small-molecules: first, by analysis of the binding of shorter HIF-1a
peptide fragments; and second, by phage display experiments.
Binding analysis of fragments of the native peptide allow identification of the highest affinity region of the HIF-1a
peptide, whereas phage display permits the unbiased explora-tion of the p300 CH1 protein surface to discover high affinity binders. Two phage display technologies were used:46a peptide phage library (NEB47–49) and an Adhiron50(commercially known as Affimers51,52) phage library. The location and binding mode of phage display derived ligands provides new information on suitable chemotypes for orthosteric small-molecule inhibitor development.
Results and discussion
The CH1 domain of p300 (amino acids 330–420) was cloned and expressed as a GST fusion protein; p300 was subsequently cleaved from GST. The C-TAD of HIF-1a786–826was purchased
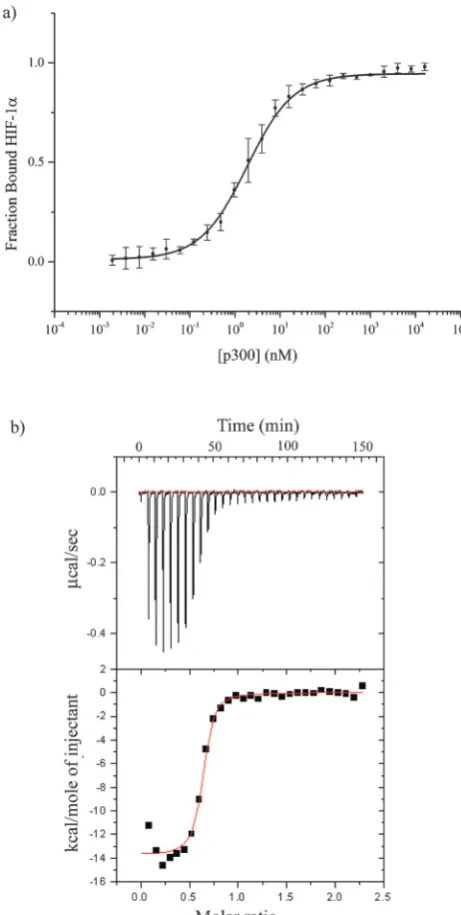
from ProteoGenix. The binding of p300 to HIF-1a786–826 was
measured by fluorescence anisotropy (using FITC-HIF-1a786–826)
and orthogonally by isothermal titration calorimetry. TheKdwas
determined to be 16.11 0.06 nM by fluorescence anisotropy and 4510 nM by ITC (Fig. 2 and Table S1, ESI†).
To investigate whether the binding interface could be restricted, smaller sections of the HIF-1aC-TAD were selected. The truncated peptides tested are summarised in Fig. 3. Whilst it is likely there will be contributions to binding along the length of the 41 amino acid HIF-1a peptide, each of these peptides was assessed for either direct binding to p300 CH1, or competitive inhibition of the HIF1a/p300 complex, to ascertain which regions are most important for binding.
a-helices have been highlighted as major binding hot-spots of PPIs,53–55so initial assessment centered on identification of the highest affinity helix. The affinity of helices 2 and 3 was
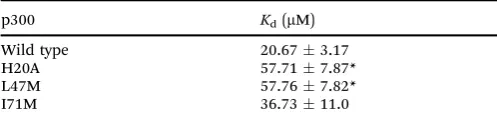
Fig. 1 NMR structure of the HIF-1a/p300 interaction (Pymol). (a) Cartoon overview of the interaction illustrating the three helices of HIF-1aC-TAD (blue) wrapping around the CH1 p300 (green). (b) Key binding residues of helix 2: Cys800and Asn803(magenta). (c) Key binding residue of helix 3: Leu818, Leu822
and Val825(magenta).
Paper Molecular BioSystems
Open Access Article. Published on 10 June 2015. Downloaded on 14/10/2015 16:08:37.
This article is licensed under a
Creative Commons Attribution 3.0 Unported Licence.
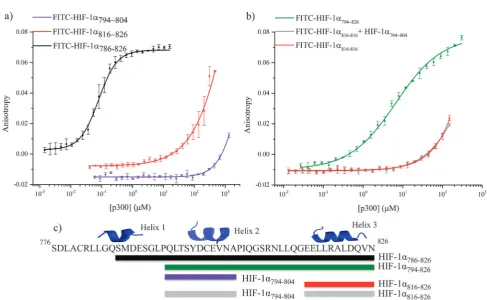
[image:2.595.58.542.59.266.2]investigated by fluorescence anisotropy using FITC-HIF-1a794–804
and FITC-HIF-1a816–826 (Fig. 4a). Both peptides showed weak
binding to p300 (compared to 160.06 nM for HIF-1a786–826):
FITC-HIF-1a816–826 Kd approximately 200 mM and
FITC-HIF-1a794–804Kd41 mM. Notably, FITC-HIF-1a816–826had a higher
affinity than FITC-HIF-1a794–804, indicating that helix 3 has a higher affinity than helix 2; therefore helix 3 may be important for high affinity binding of the native complex.
To examine further the binding energy contributions of the individual helices to the interaction and the effect of linking, peptide FITC-HIF-1a794–826, comprising helices 2 and 3 with the
intervening linker region, was also tested in the fluorescence anisotropy assay. A Kd of 6.74 0.54 mM was measured,
showing that linking helices 2 and 3 together results in an increase in affinity for p300 compared with either individual helix. Linking can increase binding affinity either through enhanced local concentration of each binding entity (avidity or chelate effect), or through co-operative interaction between them mediated through allosteric conformational change in the binding site. To distinguish between chelate and allosteric co-operativity, the fluorescence anisotropy assay was used to test the binding of FITC-HIF-1a816–826 in the presence of HIF-1a794–804(unlabeled). This demonstrated that the presence
of HIF-1a794–804had no effect on the affinity of FITC-HIF-1a816–826,
suggesting either an avidity (chelate) effect or a direct contribu-tion from the linker, rather than allosteric co-operativity between helix 3 and helix 2 (Fig. 4b). The avidity effect is modest, however, as the affinity measured for FITC-HIF-1a794–826
implies less than additive contributions from the individual binding energies of helices 2 and 3. This is consistent with the linker sequence having a considerable degree of flexibility when not bound to p300.
The reduced affinity of the FITC-HIF-1a794–826(Kd= 6.74
0.54 mM), compared to FITC-HIF-1a786–826 (Kd = 16.11
0.06 nM), indicates that the additional N-terminal residues have some role in binding, although this may be a consequence of enhanced stability of helix 2 in addition to any contribution from interaction of the N-terminal residues themselves. The importance of the N-terminal residues, which include helix 1, was explored by measuring the difference in inhibitor capabilities of fragments of HIF-1ato disrupt the HIF-1a786–826/p300 interaction.
All of the peptides illustrated in Fig. 3 were tested in a fluorescence anisotropy competition assay (Table S2, ESI†); however only peptides that contained more than one helix were able to disrupt the HIF-1a786–826/p300 interaction (Fig. 5).
HIF-1a782–826 inhibited the interaction with an IC50 = 0.59
0.05mM; this is superior to HIF-1a794–826(IC50= 89.2628mM)
and HIF-1a782–804 (IC50 4 1 mM). HIF-1a794–826 showed a
greater capability to disrupt the complex than HIF-1a782–804
demonstrating the importance of the C-terminus of HIF-1aand reinforcing the importance of the helix 3 region.
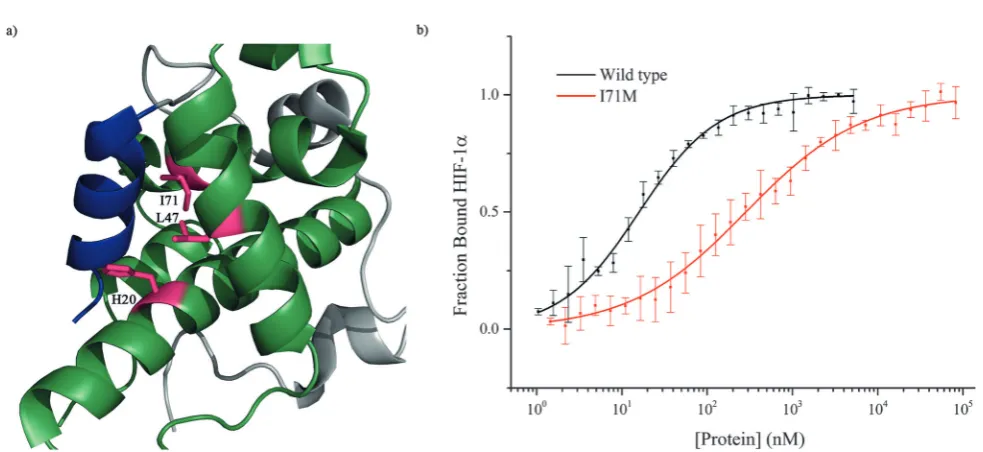
To further investigate the importance of helix 3, mutants of p300 (H20A, L47M, I71M, Fig. 6a) in the HIF-1ahelix 3 binding pocket (as shown in the NMR structure7,8Fig. 1) were generated and their fold and stability confirmed by Circular Dichroism (CD) (Fig. S1, ESI†). H20A was selected, as the NMR structure shows this residue makes a contact to HIF-1a, and mutation to alanine would remove this contact. Both L47M and I71M were selected as we hypothesised they would introduce steric clashes. Each of the three mutants caused a reduction in the binding affinity of to FITC-HIF-1a786–826, with the greatest effect observed for I71M, which caused a 18-fold reduction in binding affinity (Table 1) confirming that helix 3 has a critical role in driving p300 binding.
Taken together, these data demonstrated that helix 3 appears to be the most important of the helical regions of HIF-1ain terms of affinity. However, the absence of a dominant high affinity fragment of the HIF-1a C-TAD sequence encour-aged us to perform phage display studies to identify short but
Fig. 2 Direct binding of HIF-1a786–826C-TAD to CH1 p300. (a)
Fluores-cence anisotropy using the FITC-HIF-1a786–826. (b) ITC measurement of
unlabelled HIF-1a786–826c-TAD peptide titrated in to p300 CH1.
Open Access Article. Published on 10 June 2015. Downloaded on 14/10/2015 16:08:37.
This article is licensed under a
[image:3.595.49.280.48.506.2]high potency peptide sequences that may serve as better starting points for small-molecule elaboration.
Phage display technologies can be used to present many different forms of binder; in this study 7mer and 12mer peptides libraries (NEB47–49) and Adhiron libraries50were tested. For the
peptide libraries, both the 7mer and 12mer libraries were chosen. The 7mer library should have full coverage (all amino acids represented in all positions47–49), however due to the length of the 7mer the generation of high affinity binding peptides was anticipated to be less likely. The 12mer library does not have full
Fig. 3 Schematic of peptide fragments to be investigated to highlight key binding regions of HIF-1a.
Fig. 4 Fluorescence anisotropy investigation of native HIF-1afragments binding. (a) Binding of the fluorescence labeled helical regions of HIF-1a
C-TAD, FITC-HIF-1a794–804(violet) FITC-HIF-1a816–826(red) to p300 CH1 compared to FITC-HIF-1a786–826(black). (b) Assessment of the co-operatively
the helical regions of HIF-1a. FITC-HIF-1a781–816(green), FITC-HIF-1a816–826(red) and FITC-HIF-1a816–826in the presence of unlabeled HIF-1a794–804
(grey). Note the overlap of the red and grey data sets. (c) Schematic of the peptide fragments using in this experiment.
Paper Molecular BioSystems
Open Access Article. Published on 10 June 2015. Downloaded on 14/10/2015 16:08:37.
This article is licensed under a
Creative Commons Attribution 3.0 Unported Licence.
[image:4.595.73.534.48.262.2] [image:4.595.53.541.290.590.2]coverage, but the longer peptide may yield higher affinity peptide binders. As well as the two phage libraries, two different buffer conditions were used in the wash step: a high sodium chloride (1.5 M) and low sodium chloride (0.5 M) buffer (TBS + 0.1% tween) were used to eliminate any nonspecific electrostatic contributions. Elution using native HIF-1a786–826(500mM) was performed to ensure elution of specific binders. The experiment was also performed with a different protein (eIF4E); this parallel experiment acted as a selectivity control.
p300 was selectively N-terminally labelled with biotin using a biotin-depsipeptide and sortase A56to enable immobilisation on to streptavidin plates. Three panning rounds were com-pleted. Each round of panning led to enrichment of binders in the phage pool (Fig. S2, ESI†for the ELISA for each condition). The eluents for the unpanned libraries, round 1 and round 3 were sent for next generation sequencing using the Illumina platform.57 The top 5 clones from each condition and their frequency in the pool are summarized in the ESI†(Table S3). Three peptides were selected for synthesis: VHWDFRQWWQPS, (phage display derived peptide 1; PDDP1) SGVYKVAYDWQH (PDDP2) and ATNLFKS (PDDP3). The next generation sequencing showed an increase in enrichment of these peptides through the panning rounds. Initially the FITC-labelled peptides were tested for binding to p300 using a fluorescence anisotropy assay. The highest affinity peptide was PDDP1 with an affinity of 20.673.17mM. PDDP1 is predicted be 35% helical in isolation (as assessed by Agadir58), indicating that a helical bound conformation is plausible. Although this is a relatively low affinity for phage display-derived peptides, where low nM and pM binders are often generated,59,60the phage display-derived peptide had a higher affinity for p300 than any of the HIF-1a C-TAD peptide fragments discussed above. PDDP1 showed selectivity for p300 over eIF4e (Fig. S3, ESI†).
Fig. 5 Fluorescence anisotropy competition assay to test the disruption of the HIF-1a C-TAD/p300 CH1 complex by HIF-1a CTAD fragments. HIF-1a782–826(black) HIF-1a794–826(red) and HIF-1a782–804(violet).
Fig. 6 Investigation of the HIF-1ahelix 3 binding pocket on p300. (a) Schematic highlighting the three residues of the helix p300 binding pocket of p300 which were mutated. (b) Fluorescence anisotropy comparison of the binding of FITC-HIF-1a786–826 to wild-type p300 (black) and mutant
[image:5.595.52.286.47.279.2]p300 I71M (red).
Table 1 Binding study of p300 helix 3 binding pocket mutant proteins binding to FITC-HIF-1a786–826as measured by fluorescence anisotropy
p300 Kd(nM)
Wild type 16.110.06
H20A 250.35
L47M 29.555.58
I71M 2855.06
Open Access Article. Published on 10 June 2015. Downloaded on 14/10/2015 16:08:37.
This article is licensed under a
[image:5.595.301.553.72.135.2] [image:5.595.52.544.457.683.2]To locate the binding site of the phage display derived peptide on p300 15N–1H HSQC experiments were performed;
the PDDP1 peptide was titrated (300–750mM) into a solution of
15N-labelled p300 (230mM). Peak shifts were observed confirming
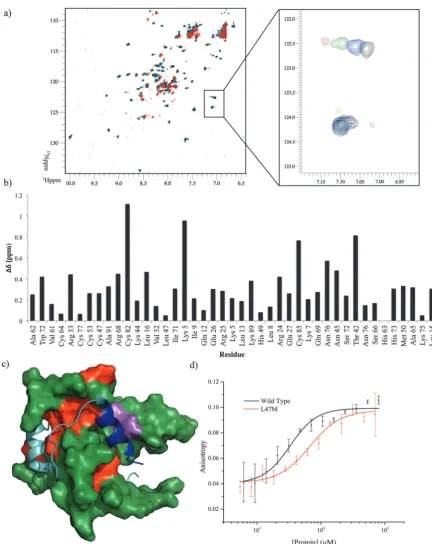
Fig. 7 Analysis of the binding site of PDDP1. (A) p30015N–1H HSQC experiment, apo_p300 (black) upon titration of PDDP1 at increasing concentrations, 300mM (blue), 545mM (green) and 750mM (red). Insert shows a concentration-dependent shift in one peak and no effect on another peak upon titration of peptide. (B) Bar chart showing the size of the shift of all the assigned peaks (BMRB-6268) of p300 after titration of 750mM PDDP1. (C) Mapping of the largest shifts (red) in or around the helix 3 binding site of p300 (green), the helix 3 of HIF-1ais shown in blue with the rest of the peptide shown in teal. The two mutations which cause a statistically significant decrease in affinity (L47M and I71M) are highlighted in magenta. (D) Fluorescence anisotropy direct binding measurement of FITC-PDDP1 binding to mutant p300 L71M, theKdof the mutant is significantly higher then that of wild-type (po0.05).
Paper Molecular BioSystems
Open Access Article. Published on 10 June 2015. Downloaded on 14/10/2015 16:08:37.
This article is licensed under a
Creative Commons Attribution 3.0 Unported Licence.
[image:6.595.78.511.55.600.2]binding (Fig. 7a). The size of the shift for each peak (Fig. 7b) was measured and those with the largest shift were mapped on to p300 (assignments from BMRM: 626861). The location of the shifts
indicates that PDDP1 may bind towards the top of the helix 3 binding pocket; the red area highlighted in Fig. 7c highlights a potential groove for interaction. In addition a shift was observed in the Trp indole peak; a change in the Trp environment has previously been used as an indicator of ligand binding to the helix 3 binding pocket.37
To further corroborate the binding of the phage display derived peptide in the helix 3 binding site, the binding of PDDP1 to both the wild type p300 and p300 with mutations in the helix 3 binding pocket (H20A, L47M, I71M) was investigated using fluorescence anisotropy (Table 2). The mutants L47M and I71M bound to PDDP1 with a statistically significant reduced affinity (po 0.05) (Table 2). The reduction in binding affinity complements the NMR data, as the decrease in binding affinity of the mutant indicates that PDDP1 binds towards the top of the helix 3 binding pocket. The location of L47M and I71M is highlighted in Fig. 7c (magenta). This additionally highlights the HIF-1ahelix 3 binding pocket as a key binding area.
The second phage display experiment used non-antibody binding proteins presented on the surface of the phage as opposed to short peptides; such scaffolds are designed to constrain and present variable peptide sequences for protein recognition.62 There are many different types of scaffold;63–69 the scaffold used in this study was the Adhiron scaffold (commercially named Affimer51,52). Adhirons are engineered non-antibody binding proteins which mimic the molecular recognition properties of antibodies but with improved proper-ties (small, monomeric, thermostable, soluble and easy to express in E. coli and mammalian cells giving high protein yield).50 The Adhiron library has two randomised loops of 9 residues which are suitable for molecular recognition and are expected to adapt to form appropriate molecular contacts with a wide range of targets including protein pockets, protein surfaces, peptides and small molecules.50
Four panning rounds were carried out, and an ELISA was used to select those clones to be sequenced (Fig. S4, ESI†). Nine clones were sent for sequencing (5, 11, 12, 24, 34, 36, 37, 41 and 43; Fig. S4, ESI†) with four independent sequences present (Fig. S4 and Table S4, ESI†). Three Adhirons were taken forward: Ad24, Ad34 and Ad41 (note that the sequence of Ad41 is represented 6 times out of 9). These were initially tested using BLitzt(ForteBio) to give an indication of affinity; BLitztis a dip and read system which enables the real
time (kinetic) quantification of molecular interactions in solution.
The highest affinity Adhiron was Ad34 with an estimatedKd
of 89 nM (Table 3). Therefore this Adhiron was taken forward to confirm binding by SPR, where an affinity of 157 nM (Chi2 0.114) was measured (Fig. S5, ESI†). The affinity of the phage display-derived Adhiron, Ad34, for p300 is higher than the phage display-derived peptides and the shorter native peptide sequences and is in the same range as HIF-1a786–826,
which has an affinity of 16.11 0.06 nM by fluorescence anisotropy and 4510 nM by ITC. However, Ad34 might be anticipated to bind at a more localised site than HIF-1a786–826.
Each of the Adhirons was assessed for their ability to inhibit the HIF-1a/p300 interaction using the fluorescence anisotropy competition assay. All 3 Adhirons had an IC50 of 1–5 mM
(Table 3, Fig. S6, ESI†). This is significantly better than frag-ments of native HIF-1a, or the phage peptides described above (which were unable to disrupt the interaction). However, the binding site of the Adhiron on p300 is not yet defined, and unfortunately excessive peak broadening in HSQC spectra on addition of Adhirons precludes interpretation of the resulting NMR shifts. These Adhiron sequences do not appear in a selection of Adhirons raised against a variety of other PPI targets, suggesting selectivity.
To further characterise Ad34 it was crystallised from 0.8 M di-sodium succinate pH 7; crystals were then supplemented with 20% glycerol for cryo-cooling and X-ray diffraction data collection. Data were phased to 2.8 Å (Fig. 8a).‡Crystallographic data is summarised Table S5 (ESI†).
The binding mode of the Adhiron was then investigated by
in silicodocking. Ad34 was docked against the NMR structure of p300 (PDB 1L8C)8 using HADDOCK (High Ambiguity Driven protein–protein Docking).70The docking results for the highest
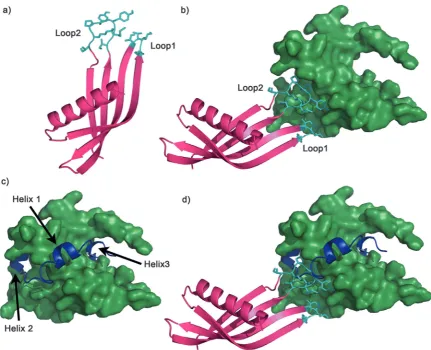
scored and most frequently predicted complex suggested that both variable loops are involved in binding, with both of the loops buried in hydrophobic areas of p300 (Fig. 8). Neither loop docked in the HIF-1ahelix 3 region, suggesting that Ad34 may bind to a different region from the highest affinity phage display derived peptide (PDDP1) and the highest affinity native helix (HIF-1a816–826) (Fig. 8). The modelling suggests the
[image:7.595.303.554.73.124.2]two Adhiron loops bind in different crevices on p300; these pocket-like structures are in mutual proximity to each over. Given the proximity of the two sites identified, fragment-based approaches may be appropriate to link small molecules that target each site, although further experimental work is required to validate the binding site.
Table 2 Binding study of p300 helix 3 binding pocket mutant proteins binding to FITC-PDDP1 as measured by fluorescence anisotropy
p300 Kd(mM)
Wild type 20.673.17
H20A 57.717.87*
L47M 57.767.82*
I71M 36.7311.0
[image:7.595.42.291.644.709.2]*po0.05.
Table 3 Phage display derived Adhiron binding data,Kdmeasured by
BLITZ and IC50measured by fluorescence anisotropy competition assay
Adhiron Kd(nM) IC50(mM)
Ad41 105 1.980.32
Ad34 89 4.782.12
Ad24 140 2.960.46
‡Adhiron crystal structure PDB accession code: 5a0o.
Open Access Article. Published on 10 June 2015. Downloaded on 14/10/2015 16:08:37.
This article is licensed under a
Conclusion
The purpose of this study was to understand the details of what drives the interaction between p300 and HIF-1a. Which may yield important information for inhibitor discovery and development. Characterisation of the native binding interface has demonstrated that the HIF-1ahelix 3 region has the highest affinity for p300; we did not identify a short sequence of the native HIF-1a C-TAD peptide which has high affinity for p300 CH1 in isolation. We, and others, have targeted the helix 3 region using a-helix35,37 and protein domain mimetics36allowing identification of HIF1a/p300 inhibitors with low micromolar affinity. Peptide phage display generated a 12mer peptide that had a higher affinity for p300 than any native HIF-1afragment of the same length, providing a new template for small molecule development. Phage display gener-ated competitive Adhirons of around 100 nM affinity which is in the same range as the binding affinity of the HIF-1a786–826to p300. If binding occurs as predicted, mediated through the two 9mer loops, the Adhiron exploits a smaller binding interface than the HIF-1a786–826 peptide. The Adhirons themselves inhibit the
HIF-1a/p300 interaction with a low micromolar IC50; therefore,
mimicking the pharmacophore of the loops in a small molecule has the potential to generate novel high affinity inhibitors.
Adhirons provide a simple and non-biased way to produce binders with high affinity and selectivity to blockade protein– protein interactions. Adhirons can be used as tool reagents for assay development work, as model interactions that can be used to direct pharmacophore development, and also have great potential as therapeutics in their own right.
The combination of a detailed biophysical analysis of the interaction between HIF-1aand p300, along with two orthogonal phage display techniques, has provided detailed information that can be used to inform design of highly potent compounds to disrupt an extremely challenging but pharmaceutically important protein–protein interaction.
Experimental
p300 protein purification
p300 CH1 was cloned into the pGex-6P-2 (GE Healthcare) plasmid and expressed as a GST fusion from which it was
Fig. 8 Adhiron structure and potential binding model to p300. (a) Crystal structure of Ad34, variable loops shown in cyan. (b) Adhiron Ad34 (magenta) docked to the NMR structure of p300 (green) using HADDOCK; key binding residues are shown in cyan. (c) NMR structure of HIF-1a(blue) bound to p300 (green) in the same orientation as the docked Adhiron (shown in b). (d) Overlay of the docked Ad34 (magenta) and HIF-1a(blue) bound p300 (green), highlighting Ad34 does not dock in a helix binding pocket.
Paper Molecular BioSystems
Open Access Article. Published on 10 June 2015. Downloaded on 14/10/2015 16:08:37.
This article is licensed under a
Creative Commons Attribution 3.0 Unported Licence.
[image:8.595.81.513.46.396.2]subsequently cleaved. GST-p300 containing BL21 Gold cells were grown to O.D6000.6–0.8 and induced with 0.1 mM IPTG
supplemented with 50 mM zinc sulphate and incubated for 18 hours at 181C. Cells were harvested and disrupted by sonication, then the soluble protein was separated from insoluble protein by centrifugation. GST-p300 was purified by affinity chromatography on glutathione beads (GE Healthcare); the GST was cleaved by PreScission protease and separated from p300 by size exclusion chromatography.
p300 was biotin labeled by the chemoselective attachment of a biotin-depsipeptide to the N-terminal glycine of p300 cata-lysed by sortase A.56 The reaction consisted of 100 mM p300 (50 mM HEPES pH 7.5, 150 mM sodium phosphate and 5 mM calcium chloride), 300 mM biotin-depsipeptide and 20 mM sortase, the reaction was incubated at 371C with agitation for 3.5 hours. The biotin-p300 was separated from the unreacted biotin-depsipeptide by dialysis and from the sortase A by nickel affinity chromatography (the sortase A has a His tag). The biotiny-latoin was confirmed by western blot and mass spectrometry.
15N labeled GST-p300 was purified after autoinduction with
a glucose to lactose ratio 1 : 4; the full media recipe is outlined in Table S6 (ESI†). The cells were grown at 371C for four hours and then 20 1C for 40 hours. Cells were harvested and the protein purified in the same way as native p300.
Mutants H20A, L47M and I71M were all made as per Q5 site-directed mutagenesis kit (NEB). They were expressed and purified in the same way as wild-type p300. CD was performed at 0.2 mg mL 1in buffer: 40 mM sodium phosphate pH 7.5, 100 mM sodium chloride, 1 mM DTT and 5% glycerol.
eIF4E-SUMO expression by autoinduction and purification have been outlined previously.35
Peptides
All peptides outlined in Fig. 3 were purchased either FITC labeled of or unlabeled from PreoGenix (France), except HIF-1a794–804and HIF-1a816–826which were by standard Fmoc SPPS and purified by preparative HPLC. Characterisation outlined in ESI†Fig. S7–S10.
Florescence anisotropy
Direct binding. p300 protein was serially diluted in buffer (40 mM sodium phosphate, 100 mM NaCl, 1 mM DTT, 5% glycerol, 0.1% triton) and labeled peptide (40 nM) was added, the plates were then incubated for 30 minutes at room temperature. Each experiment was run in triplicate and the fluorescence anisotropy measured using a EnVision 2103 Multi-Label plate reader (Perkin Elmer) with excitation at 480 nm and emission at 535 nm (30 nm bandwidths). In parallel, a control experiment was performed in which no labeled peptide was added and the volume made up with additional buffer, this blank was deducted from the raw data for each of the three repeats. The intensity was calculated for each point using eqn (1) and used to calculated anisotropy using eqn (2). From a plot of anisotropy against p300 concentration the minimum and maximum anisotropies were obtained using a logistic sigmoidal fit in OriginPro 8.6. This allowed the conversion to
fraction bound (eqn (3)). The data were then fitted using eqn (4) in OriginPro 8.6 to determine the dissociation constant,Kd.
I= (2PG) +S (1)
R= (S PG)/I (2)
Lb = (R Rmin)/((l(Rmax R)) +R Rmin) (3)
y= ((Kd+x+ [FL]) O((Kd+x+ [FL])2 4x[FL]))/2 (4)
R= anisotropy,I= total intensity,P= perpendicular intensity,
S = parallel intensity, G = an instrument factor set to 1, Lb = fraction ligand bound, l = Ibound/Iunbound = 1, [FL] =
concentration of fluorescent peptide, Kd = dissociation
constant,y= Lb multiplied by [FL],x= protein concentration.
Competition.Unlabeled peptide was serially diluted across a 384 well plate in buffer (40 mM sodium phosphate, 100 mM NaCl, 1 mM DTT, 5% glycerol, 0.1% triton) and 40 nM labeled HIF-1a786–826peptide and 0.1mM protein were added sequen-tially. The plates were then incubated for 30 minutes at room temperature. Each experiment was run in triplicate and the fluorescence anisotropy measured using a EnVision 2103 MultiLabel plate reader (Perkin Elmer) with excitation at 480 nm and emission at 535 nm (5 nm bandwidths). A control experiment was performed in which no labeled peptide was added and the volume made up with additional buffer, this blank was deducted from the raw data each of the three repeats. Intensity and anisotropy were calculated as above using eqn (1) and (2) respectively. Plots of anisotropy against unlabeled peptide were fitted to a logistic sigmoidal dose response model to determine and an IC50.
Isothermal titration calorimetry. The ITC experiment was conducted at 25 1C in 40 mM sodium phosphate, 100 mM sodium chloride and 5% glycerol. 10mM p300 was present in the cell and 100mM HIF-1a786–826in the syringe. One injection of 10mL for 20 seconds of HIF-1a786–826was made every 300 seconds for 30 injections.
Peptide phage display experiment.The biotin-p300 (10 pM) was mixed with each phage library (10mL), incubated at room temperature for one hour, then isolated on to a streptavidin plate via the biotin tag (ten minute incubation), additional biotin (0.1 mM final concentration) was added to each well to block the unbound streptavidin (5 minute incubation at room temperature). The wells were then emptied and washed 3 times with high and low salt TBS-T (0.5 M NaCl and 1.5 M NaCl respectively). The phage were then eluted with 500mM HIF-1a. To re-amplify the phage cultures of ER278 cells were grown to mid-log phase (O.D6000.6–0.8) and the elutes were added
(one elute condition per culture). The cultures were then grown at 371C with vigorous shaking (300 rpm) for 4.5 hours, the first 10 minutes of this growth period the shaking was set to 80 rpm. To isolate phage the cultures were then pelleted and the supernatant was mixed with a chilled 20% PEG 8000/2.5 M NaCl solution and the mixture was centrifuged at 13,000 rpm for 20 minutes (at 201C). The pellet was resuspended in 1 ml TBS, spun down at 13,000 rpm, the chilled 20% PEG 8000/2.5 M NaCl solution was again added to the supernatant and incubated on ice
Open Access Article. Published on 10 June 2015. Downloaded on 14/10/2015 16:08:37.
This article is licensed under a
for 30 minutes. The mixture was again centrifuged at 13000 rpm for 5 minutes and the pellet resuspended in TBS. 1011 plaque forming units were added to start the next round of panning, in total three panning rounds were completed.
Enrichment ELISA.Streptavidin plates were coated in biotin-p300 (5mg mL 1), incubated at room temperature for 30 minutes.
The plates were washed with TBS-T to remove excess target. 11010pfu of re-amplified phage from each panning elute and incubate for one hour at room temperature, (also added to an uncoated well as a control). The plates were washed with TBS-T and anti M13-HRP antibody was added and incubated for one hour, washed with TBS-T, developed with 100ml per well TMB. Plate was read at A370.
Peptide phage display sequencing. DNA was isolated from pan elute 1 and 3 and from the unpanned library and PCR was used to amplify the DNA. Blunt end repair of the resultant ds-DNA was conducted using Illumina Paired-end DNA sample preparation kit. The primers with the unique bar codes (Illumina adaptors) were ligated to each fragment and the fragments with the adaptors were amplified by a second round PCR. This resulted in 12 different pools which each had a unique bar code; the unpanned 7mer and 12mer libraries were also sequenced to assess the presence of any propagation related clones at the start of the experiment. Sequencing was performed by the Centre for Genomic Research, University of Liverpool. The Matlab analysis was performed using scripts based on published code57 and modified for correctness and the specific sequences used. Modification used were:
Cope with smaller files by not discarding partial blocks
Allow for variable length adaptor sequences, and unequal adaptor sequences
Allow for variable file tags (i.e.not just Illumina)
Allow for variable length peptide libraries (tested with 7-mer and 12-mer)
Scripts were run over all ‘pure’ 7-mer and 12-mer libraries. Locus specific sequences rather than full primers were used and the quality control cut off was A.
NMR analysis. The NMR experiments were all conducted in 10 mM Tris-HCl pH 6.9, 50 mM NaCl, 2 mM DTT and 2% glycerol. 300–750 mM peptide was titrated into 230 mM
15N-p300. Data were collected on a 600 MHz Agilent NMR
system at 251C and analysed with CCPN Analysis software.
Adhiron phage display experiment.p300 was expressed and biotinylated as described above. Biotin-p300 was added and incubated on pre-blocked steptavdin plate, the plate was then washed using a KingFisher robotic platform (ThermoFisher) and 1012 cfu of the pre-panned phage library was added and incubated for 2.5 h with shaking. Wells were wash ten times and eluted with 100mL 0.2 M glycine (pH 2.2) for ten minutes neutralized with 15 mL 1 M Tris-HCl (pH 9.1), further eluted with triethylamine 100 mM for 6 min, and neutralised with 1 M Tris-HCl (pH 7). Eluted phage were used to infect ER2738 cells for 1 h at 371C and 90 rpm then plated onto LB agar plates with 100mg ml 1carbenicillin and grown overnight. All colonies were scrapped into 5 mL of 2XYT with carbenicillin (10mg mL 1) and 1 109M13K07 helper phage were added. After an overnight
incubation phage were precipitated with 4% polyethylene glycol 8000, 0.3 M NaCl and resuspended in 1 ml of 10 mM Tris, pH 8.0, 1 mM EDTA (TE buffer). 2mL phage suspension was used for the second round panning round streptavidin magnetic beads as opposed to streptavidin plates (Invitrogen); otherwise the second pan was conducted in the same way as the first pan. The third pan was conducting using neutravidin high binding capacity plates (Pierce). During the fourth and final pan 50mM of HIF-1a
peptide was added as competitor before elution. After the final pan colonies were picked, an ELISA was conducted to select positive clones (in the same way as the enrichment ELISA) which were sent for Sanger sequencing.
Adhiron expression.Adhiron cDNA were cloned in to pET-11 and expressed by induction with 0.5 mM IPTG (at O.D6000.6–0.8)
and induced at 181C for 18 hours. Each Adhiron had a 6-HIS tag and was purified by affinity chromatography using Ni-column follow by size exclusion chromatography using the buffer 10 mM HEPES pH 7.5, 100 mM sodium chloride and 2% glycerol.
Blitzt. The BLitzt (ForteBio) dip and read Ni biosensors were used to estimate the affinity of p300 (10mM) binding to immobilized Adhirons (1mM) and a global fit was used to calculate the binding affinities using the advanced kinetic software.
SPR.1 pM biotin-p300 was isolated on to one flow cell of a streptavidin chip (100 response units), at a flow rate of 5mL min 1, while the other flow cell was left unfunctionalised. 5 concentra-tions of Ad34 were tested (100 nM 1mM). Each concentration was flowed over both the functionalised and the unfunction-alised flow cells at 40mL min 1and the on- and off-rates were calculated using the Biacore software. The on- and off-rates were used to calculate theKd.
d[AB]/ dt=ka[A][B]d[AB]/dt=kd[AB]
Kd=kd/ka
Ad34 crystallography.Ad34 was concentrated to 10 mg mL 1
and crystallized in the condition 0.8 M di-sodium succinate pH 7. The crystals grew overnight at 181C. They were picked and cryo protected with 20% glycerol. The structure was solved using molecular replacement from the structure published by Tiede et al., (PDB 4N6U).50 Initially Ad34 was subjected to molecular replacement with no loops present using the program Balbes,71 and Buccaneer72 was used to rebuild the loops. The structure was then refined using Phenix73and Refmac.74
Docking.Docking was performing using HADDOCK (High Ambiguity Driven protein–protein Docking).70 Using the NMR structure of p300 and the crystal structure of Ad34. The restraint used was that the binding was mediated through the loop regions.
Acknowledgements
We thank AstraZeneca and EPSRC for PhD studentships for G.M.B. and H.F.K. and the European Research Council (ERC-StG-240324) for support. We would also like to thank the Wellcome Trust (094232) for funding CD, ITC, X-ray generator and SPR facilities and the BBSRC (BB/L015056/1)
Paper Molecular BioSystems
Open Access Article. Published on 10 June 2015. Downloaded on 14/10/2015 16:08:37.
This article is licensed under a
Creative Commons Attribution 3.0 Unported Licence.
for the crystallisation robotics and imaging facilities. We thank Arnout Kalverda and Gary Thompson for assistance with NMR experiments, Chi Trinh for assistance with crystallography, Iain Manfield for help with ITC and SPR and Daniel Williamson for help with biotin labeling of p300.
Notes and references
1 D. Hanahan and R. A. Weinberg,Cell, 2011,144, 646–674. 2 P. Vaupel, O. Thews, D. K. Kelleher and M. Hoeckel, Adv.
Exp. Med. Biol., 1998,454, 591–602.
3 H. Zhong, A. M. De Marzo, E. Laughner, M. Lim, D. A. Hilton, D. Zagzag, P. Buechler, W. B. Isaacs, G. L. Semenza and J. W. Simons,Cancer Res., 1999,59, 5830–5835.
4 M. Hockel and P. Vaupel,Semin. Oncol., 2001,28, 36–41. 5 I. K. Nordgren and A. Tavassoli,Chem. Soc. Rev., 2011, 40,
4307–4317.
6 N. Vo and R. H. Goodman, J. Biol. Chem., 2001, 276, 13505–13508.
7 S. J. Freedman, Z. Y. Sun, F. Poy, A. L. Kung, D. M. Livingston, G. Wagner and M. J. Eck,Proc. Natl. Acad. Sci. U. S. A., 2002,99, 5367–5372.
8 S. A. Dames, M. Martinez-Yamout, R. N. De Guzman, H. J. Dyson and P. E. Wright,Proc. Natl. Acad. Sci. U. S. A., 2002,99, 5271–5276.
9 S. Surade and T. L. Blundell,Chem. Biol., 2012,19, 42–50. 10 A. D. Thompson, A. Dugan, J. E. Gestwicki and A. K. Mapp,
ACS Chem. Biol., 2012,7, 1311–1320.
11 S. Jones and J. M. Thornton,Proc. Natl. Acad. Sci. U. S. A., 1996,93, 13–20.
12 L. Lo Conte, C. Chothia and J. Janin,J. Mol. Biol., 1999,285, 2177–2198.
13 M. R. Arkin and J. A. Wells,Nat. Rev. Drug Discovery, 2004,3, 301–317.
14 A. A. Bogan and K. S. Thorn,J. Mol. Biol., 1998,280, 1–9. 15 T. Clackson and J. A. Wells,Science, 1995,267, 383–386. 16 Z. Hu, B. Ma, H. Wolfson and R. Nussinov,Proteins, 2000,
39, 331–342.
17 W. Guo, J. A. Wisniewski and H. Ji,Bioorg. Med. Chem. Lett., 2014,24, 2546–2554.
18 B. Onnis, A. Rapisarda and G. Melillo, J. Cell. Mol. Med., 2009,13, 2780–2786.
19 L. M. Greenberger, I. D. Horak, D. Filpula, P. Sapra, M. Westergaard, H. F. Frydenlund, C. Albaek, H. Schroder and H. Orum,Mol. Cancer Ther., 2008,7, 3598–3608. 20 A. Rapisarda, B. Uranchimeg, O. Sordet, Y. Pommier,
R. H. Shoemaker and G. Melillo, Cancer Res., 2004, 64, 1475–1482.
21 E. Laughner, P. Taghavi, K. Chiles, P. C. Mahon and G. L. Semenza,Mol. Cell. Biol., 2001,21, 3995–4004. 22 E. W. Newcomb, M. A. Ali, T. Schnee, L. Lan, Y. Lukyanov,
M. Fowkes, D. C. Miller and D. Zagzag, Neuro-Oncology, 2005,7, 225–235.
23 M. Mayerhofer, P. Valent, W. R. Sperr, J. D. Griffin and C. Sillaber,Blood, 2002,100, 3767–3775.
24 P. K. Majumder, P. G. Febbo, R. Bikoff, R. Berger, Q. Xue, L. M. McMahon, J. Manola, J. Brugarolas, T. J. McDonnell, T. R. Golub, M. Loda, H. A. Lane and W. R. Sellers, Nat. Med., 2004,10, 594–601.
25 G. V. Thomas, C. Tran, I. K. Mellinghoff, D. S. Welsbie, E. Chan, B. Fueger, J. Czernin and C. L. Sawyers,Nat. Med., 2006,12, 122–127.
26 J. Y. Han, S. H. Oh, F. Morgillo, J. N. Myers, E. Kim, W. K. Hong and H. Y. Lee,J. Natl. Cancer Inst., 2005,97, 1272–1286.
27 G. L. Wang, B. H. Jiang and G. L. Semenza,Biochem. Biophys. Res. Commun., 1995,216, 669–675.
28 J. S. Isaacs, Y. J. Jung, E. G. Mimnaugh, A. Martinez, F. Cuttitta and L. M. Neckers, J. Biol. Chem., 2002, 277, 29936–29944.
29 D. Kong, E. J. Park, A. G. Stephen, M. Calvani, J. H. Cardellina, A. Monks, R. J. Fisher, R. H. Shoemaker and G. Melillo,Cancer Res., 2005,65, 9047–9055.
30 E. Miranda, I. K. Nordgren, A. L. Male, C. E. Lawrence, F. Hoakwie, F. Cuda, W. Court, K. R. Fox, P. A. Townsend, G. K. Packham, S. A. Eccles and A. Tavassoli,J. Am. Chem. Soc., 2013,135, 10418–10425.
31 S. R. Mooring, H. Jin, N. S. Devi, A. A. Jabbar, S. Kaluz, Y. Liu, E. G. Van Meir and B. Wang,J. Med. Chem., 2011,54, 8471–8489.
32 D. H. Shin, Y. S. Chun, D. S. Lee, L. E. Huang and J. W. Park,
Blood, 2008,111, 3131–3136.
33 A. L. Kung, S. D. Zabludoff, D. S. France, S. J. Freedman, E. A. Tanner, A. Vieira, S. Cornell-Kennon, J. Lee, B. Wang, J. Wang, K. Memmert, H. U. Naegeli, F. Petersen, M. J. Eck, K. W. Bair, A. W. Wood and D. M. Livingston,Cancer Cell, 2004,6, 33–43.
34 L. K. Henchey, S. Kushal, R. Dubey, R. N. Chapman, B. Z. Olenyuk and P. S. Arora,J. Am. Chem. Soc., 2010,132, 941–943.
35 G. M. Burslem, H. F. Kyle, A. L. Breeze, T. A. Edwards, A. Nelson, S. L. Warriner and A. J. Wilson,ChemBioChem, 2014,15, 1083–1087.
36 S. Kushal, B. B. Lao, L. K. Henchey, R. Dubey, H. Mesallati, N. J. Traaseth, B. Z. Olenyuk and P. S. Arora,Proc. Natl. Acad. Sci. U. S. A., 2013,110, 15602–15607.
37 B. B. Lao, I. Grishagin, H. Mesallati, T. F. Brewer, B. Z. Olenyuk and P. S. Arora,Proc. Natl. Acad. Sci. U. S. A., 2014,
111, 7531–7536.
38 R. Dubey, M. D. Levin, L. Z. Szabo, C. F. Laszlo, S. Kushal, J. B. Singh, P. Oh, J. E. Schnitzer and B. Z. Olenyuk,J. Am. Chem. Soc., 2013,135, 4537–4549.
39 S. Yin, S. Kaluz, N. S. Devi, A. A. Jabbar, R. G. de Noronha, J. Mun, Z. Zhang, P. R. Boreddy, W. Wang, Z. Wang, T. Abbruscato, Z. Chen, J. J. Olson, R. Zhang, M. M. Goodman, K. C. Nicolaou and E. G. Van Meir, Clin. Cancer Res., 2012,18, 6623–6633.
40 Q. Shi, S. Yin, S. Kaluz, N. Ni, N. S. Devi, J. Mun, D. Wang, K. Damera, W. Chen, S. Burroughs, S. R. Mooring, M. M. Goodman, E. G. Van Meir, B. Wang and J. P. Snyder,
ACS Med. Chem. Lett., 2012,3, 620–625.
Open Access Article. Published on 10 June 2015. Downloaded on 14/10/2015 16:08:37.
This article is licensed under a
41 C. A. Lipinski, J. Pharmacol. Toxicol. Methods, 2000, 44, 235–249.
42 J. L. Ruas, L. Poellinger and T. Pereira,J. Biol. Chem., 2002,
277, 38723–38730.
43 J. Gu, J. Milligan and L. E. Huang,J. Biol. Chem., 2001,276, 3550–3554.
44 D. Lando, D. J. Peet, D. A. Whelan, J. J. Gorman and M. L. Whitelaw,Science, 2002,295, 858–861.
45 H. Cho, D. R. Ahn, H. Park and E. G. Yang,FEBS Lett., 2007,
581, 1542–1548.
46 S. S. Sidhu,Curr. Opin. Biotechnol., 2000,11, 610–616. 47 J. K. Scott and G. P. Smith,Science, 1990,249, 386–390. 48 S. E. Cwirla, E. A. Peters, R. W. Barrett and W. J. Dower,Proc.
Natl. Acad. Sci. U. S. A., 1990,87, 6378–6382.
49 J. J. Devlin, L. C. Panganiban and P. E. Devlin,Science, 1990,
249, 404–406.
50 C. Tiede, A. A. Tang, S. E. Deacon, U. Mandal, J. E. Nettleship, R. L. Owen, S. E. George, D. J. Harrison, R. J. Owens, D. C. Tomlinson and M. J. McPherson,Protein Eng., Des. Sel., 2014,27, 145–155.
51 T. Hoffmann, L. K. Stadler, M. Busby, Q. Song, A. T. Buxton, S. D. Wagner, J. J. Davis and P. Ko Ferrigno,Protein Eng., Des. Sel., 2010,23, 403–413.
52 L. K. Stadler, T. Hoffmann, D. C. Tomlinson, Q. Song, T. Lee, M. Busby, Y. Nyathi, E. Gendra, C. Tiede, K. Flanagan, S. J. Cockell, A. Wipat, C. Harwood, S. D. Wagner, M. A. Knowles, J. J. Davis, N. Keegan and P. K. Ferrigno,Protein Eng., Des. Sel., 2011,24, 751–763. 53 V. Azzarito, K. Long, N. S. Murphy and A. J. Wilson, Nat.
Chem., 2013,5, 161–173.
54 T. A. Edwards and A. J. Wilson,Amino Acids, 2011,41, 743–754. 55 B. N. Bullock, A. L. Jochim and P. S. Arora,J. Am. Chem. Soc.,
2011,133, 14220–14223.
56 D. J. Williamson, M. A. Fascione, M. E. Webb and W. B. Turnbull,Angew. Chem., Int. Ed., 2012,51, 9377–9380. 57 W. L. Matochko, K. Chu, B. Jin, S. W. Lee, G. M. Whitesides
and R. Derda,Methods, 2012,58, 47–55.
58 V. Munoz and L. Serrano,Nat. Struct. Biol., 1994,1, 399–409.
59 P. A. t Hoen, S. M. Jirka, B. R. Ten Broeke, E. A. Schultes, B. Aguilera, K. H. Pang, H. Heemskerk, A. Aartsma-Rus, G. J. van Ommen and J. T. den Dunnen, Anal. Biochem., 2012,421, 622–631.
60 P. Molek, B. Strukelj and T. Bratkovic,Molecules, 2011,16, 857–887.
61 R. N. De Guzman, J. M. Wojciak, M. A. Martinez-Yamout, H. J. Dyson and P. E. Wright,Biochemistry, 2005,44, 490–497. 62 M. Gebauer and A. Skerra,Curr. Opin. Chem. Biol., 2009,13,
245–255.
63 S. E. Hufton, N. van Neer, T. van den Beuken, J. Desmet, E. Sablon and H. R. Hoogenboom, FEBS Lett., 2000, 475, 225–231.
64 S. J. McConnell and R. H. Hoess,J. Mol. Biol., 1995,250, 460–470.
65 B. Heyd, F. Pecorari, B. Collinet, E. Adjadj, M. Desmadril and P. Minard,Biochemistry, 2003,42, 5674–5683.
66 K. Nord, E. Gunneriusson, J. Ringdahl, S. Stahl, M. Uhlen and P. A. Nygren,Nat. Biotechnol., 1997,15, 772–777. 67 E. Bianchi, A. Folgori, A. Wallace, M. Nicotra, S. Acali,
A. Phalipon, G. Barbato, R. Bazzo, R. Cortese and F. Felici,
et al.,J. Mol. Biol., 1995,247, 154–160.
68 P. A. Dalby, R. H. Hoess and W. F. DeGrado,Protein Sci., 2000,9, 2366–2376.
69 C. Souriau, L. Chiche, R. Irving and P. Hudson,Biochemistry, 2005,44, 7143–7155.
70 C. Dominguez, R. Boelens and A. M. Bonvin,J. Am. Chem. Soc., 2003,125, 1731–1737.
71 F. Long, A. A. Vagin, P. Young and G. N. Murshudov,Acta Crystallogr., Sect. D: Biol. Crystallogr., 2008,64, 125–132. 72 K. Cowtan,Acta Crystallogr., Sect. D: Biol. Crystallogr., 2006,
62, 1002–1011.
73 P. D. Adams, R. W. Grosse-Kunstleve, L. W. Hung, T. R. Ioerger, A. J. McCoy, N. W. Moriarty, R. J. Read, J. C. Sacchettini, N. K. Sauter and T. C. Terwilliger, Acta Crystallogr., Sect. D: Biol. Crystallogr., 2002,58, 1948–1954. 74 G. N. Murshudov, A. A. Vagin and E. J. Dodson, Acta
Crystallogr., Sect. D: Biol. Crystallogr., 1997,53, 240–255.
Paper Molecular BioSystems
Open Access Article. Published on 10 June 2015. Downloaded on 14/10/2015 16:08:37.
This article is licensed under a
Creative Commons Attribution 3.0 Unported Licence.