Automatic Localisation of Blood Vessels, Optic
Disc and Optic Cup using Selfish Gene
Algorithm
R.Abirami
1, S.Velmurugan
2, J.Ezhilarasi
3Associate Professor, Dept. of ECE, Krishnasamy College of Engg. and Technology,Cuddalore,Tamilnadu,India1
Assistant Professor, Dept. of Mechanical Engg, CK College of Engg. and Technology, Cuddalore, Tamilnadu,India2
PG Student [EST], Dept. of EEE, Krishnasamy College of Engg. and Technology, Cuddalore, Tamilnadu, India 3
ABSTRACT: Automated fundus image analysis plays an important role in the computer aided diagnosis of ophthalmologic disorders. Many important eye diseases as well as systemic diseases manifest themselves in the retina. The most prevalent causes of blindness in the industrialized world are age-related macular degeneration, diabetic retinopathy, and glaucoma. Glaucoma is an eye disease which occurs due to the increased fluid pressure inside the eye. The pressure inside the normal eye is below 21mm of Hg. When the pressure inside the eye(s) increases more than 21mm of Hg, the optic nerve get damaged. This can permanently damage the vision in the effected eye(s) and can lead to blindness, if left untreated. The aim of this paper is to segment and locate the blood vessels, optic disc and optic cup for identifying glaucoma. The blood vessels are segmented by using prewitt edge detection. The optic disc and optic cup are segmented by using gradient algorithm. The features like shape, area and size of optic disc and optic cup are extracted and the cup-to-disc ratio(CDR) is calculated. To detect glaucoma, the CDR of normal person image and CDR of affected person image is calculated and compared. If the CDR of input person image exceeds the CDR of normal person image, then it is confirmed that the person is affected by glaucoma. Then the level of glaucoma is identified.
KEYWORDS: optic disc, optic cup, blood vessels, CDR, glaucoma.
I. INTRODUCTION
Optic Disc connects eye and brain acts as a conduit, transmitting visual information from light sensitive cells of retina to brain. It is also the entry point of major blood vessel that supplies blood to retina. Glaucoma and Diabetic retinopathy are sight threatening diseases which in severe stage causes blindness. So, optic disc detection is an important step for diagnosis of these two diseases as well as some other diseases related to retina. Changes in optic disc shape and area may indicate disease progression. In case of glaucoma detection, the optic cup-to-disc ratio (CDR) determines whether the person is suffering from glaucoma or not. The risk of glaucoma increases dramatically with age, but it can strike any group, even newborn infants and fetuses.
GLAUCOMA DEFINITION
Glaucoma is a term describing a group of ocular (eye) disorders resulting in optic nerve damage or loss to the field of vision, typically caused by a clinically characterized pressure buildup in regards to the fluid of the eye (intraocular pressure-associated optic neuropathy). Glaucoma has been called the silent thief of sight.
TYPES
1. Closed angle glaucoma
2. Primary open angle glaucoma (chronic glaucoma) 3. Low-tension glaucoma
4. Pigmentary glaucoma
SIGNS AND SYMPTOMS
Primary open-angle glaucoma
Peripheral vision is gradually lost. This nearly always affects both eyes.
In advanced stages, the patient has tunnel vision.
Closed angle glaucoma
Eye pain, usually severe
Blurred vision
Eye pain is often accompanied by nausea, and sometimes vomiting
Lights appear to have extra halo-like glows around them
Red eyes
Sudden, unexpected vision problems, especially when lighting is poor.
RISK FACTORS LINKED TO GLAUCOMA
Certain ethnicities: Glaucoma is six to eight times more common in African-Americans than in Caucasians.
Mexican-Americans, Asian-Americans and Japanese-Americans are also at an increased risk.
Over 60 years old
Chronic diseases
Family history
Eye injury and nearsightedness
Use of corticosteroids
PREVENTIVE MEASURES
Get regular eye care
Treat elevated eye pressure
Eat a healthy diet
Wear eye protection glass
II. GENERAL TERMINOLOGY
Cup to Disc Ratio: To compare the features of the Optic Disc and Optic Cup for detecting the presence of glaucoma.
III. RELATED WORK
In Year 2010, Zhuo Zhang performed a work," ORIGA-light : An Online Retinal Fundus Image Database for Glaucoma Analysis and Research"[8]. Author present an online dataset, ORIGA-light, which aims to share clinical retinal images with the public. Author had updated the system continuously with more clinical ground-truth images. In Year 2012, Nilan jan Dey performed a work," Optical Cup to Disc Ratio Measurement for Glaucoma Diagnosis Using Harris Corner"[11]. In this paper, CDR is determined using Harris Corner. Harris comer detector measures the local changes of the signal with patches shifted in different directions by a small amount. It is based on the local auto-correlation function of a signal. In Year 2012, R. Geetha Ramani performed a work," Automatic Prediction of Diabetic Retinopathy and Glaucoma through Retinal Image Analysis and Data Mining Techniques"[5]. This paper proposed a novel approach for automatic disease detection. Retinal image analysis and data mining techniques are used to accurately categorize the retinal images as either Normal, Diabetic Retinopathy and Glaucoma affected. In the proposed system, prewitt edge detection, gradient algorithm and cup-to-disc ratio are used to overcome this problem and accuracy is more when compared to the existing system.
IV. PROPOSED SYSTEM
There are about 20 images are taken. The various sizes of RGB images are resized universally into 512*512 size images, and converted into gray scale and then binary image. From the binary image, the blood vessels are segmented by using prewitt edge detector.
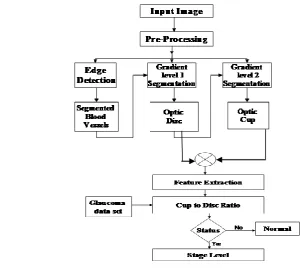
Figure 1.1 Flow chart of proposed system
Figure 1 Flowchart of the proposed system
There are about 20 images are taken. The various sizes of RGB images are resized universally into 512*512 size images, and converted into gray scale and then binary image. From the binary image, the blood vessels are segmented by using prewitt edge detector. The threshold level is set for the intensity level of the binary image.
Because the optic disc is in yellowish colour. To avoid the confusion, threshold level is set to segment optic disc and optic cup. The region segmentation algorithm is used to segment the region of optic disc and optic cup. By using gradient level, the optic disc and optic cup are segmented. From the segmented image, the features like size, shape and area of optic disc and optic cup are extracted. The cup to disc ratio is calculated by using these features. C/D ratio is measured by using the cup edge and disc region. The normal cup-to-disc ratio is 0.3. The ratio will be high for the glaucoma affected image. This ratio is compared with the database which consists of cup to disc ratio for normal and glaucoma images. If the status is yes, the output is, the given image has glaucoma stage level. Then the three levels of glaucoma are to find. Otherwise, it gives the output as, the image is normal.
V. WORKING OF THE ALGORITHM
SELFISH GENE ALGORITHM (SGA)
In 1998, Corno has proposed the selfish gene algorithm (SGA) where the survival of the fittest is considered a battle fought by genes not between individuals. The population here is like a storeroom of genes denoted by virtual population. The algorithm evolves reproducing its effect on the statistical parameters of a virtual population related with allele’s frequencies in the same gene group. Some authors proposed a novel class of evolutionary algorithms denoted by estimation of distribution algorithms (EDAs) together with the selfish gene theory. In these approaches the new candidate solutions are generated by sampling from statistically promising solutions without using mutation and crossover operators. The learning procedure is based on mutual information of genes performance.
BLOOD VESSELS SEGMENTATION Prewitt edge detection
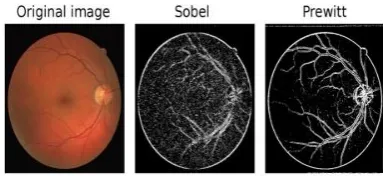
The Prewitt filter is a discrete differentiation operator. It is a correct way to estimate the magnitude and orientation of an edge in given image. Prewitt edge detection is simpler to implement computationally than Sobel edge detection.The compass edge detection obtains the direction directly from the kernel with highest response. The gradient edge detection of Prewitt is limited to eight possible directions. The operator uses two 3x3 kernels. Also, the edge detection is estimated in these 3x3 neighborhood for eight directions. The kernels of Prewitt are convolved with the original image to calculate approximations of the derivatives.
1 0 1
-1 0 1
-1 0 1
Figure2 Prewitt mask used for detecting edges
Figure shows the prewitt mask used for detecting edges of the input image.
Figure 3 Comparison of sobel and prewitt edge detector
Figure shows the edge detection images of sobel and prewitt edge detection methods.
-1 -1 -1
0 0 0
OPTIC DISC AND OPTIC CUP SEGMENTATION
The presence of blood vessels that run on the outline of the optic disc makes accurate extraction of its outline difficult.The optic disc region tends to be comparatively brighter. Thus, the approximate region of the optic disc was extracted by using the gradient level segmentation method on each red, green, and blue component image, and the optic disc region was determined by using an image combining these three binary images. Then, the area of the 512*512 pixel image, centered on the optic disc thus determined was extracted as the region for analysis. An RGB color image was converted to an intensity image, and the pixel values were normalized. The change in intensity (brightness) is usually high at the outline of the optic disc; thus region segmentation is used to detect the edges of optic disc and optic cup.
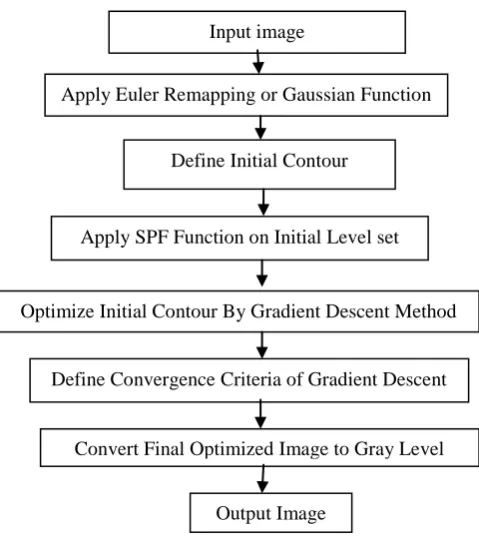
The algorithm is described as follows:
1. First take input image as jpeg format for segmentation and localization of optic nerves of retinal image. 2. Apply Euler remapping or Gaussian function as smoothing filter for removing noise and blur reassembling.
Where, is standard deviation of Gaussian distribution, x is distance from the origin in horizontal axis, y is distance from the origin in vertical axis, e is Euler no.
3. Define initial level contour for introducing curve around the object to be detected.
Steps of gradient algorithm
Figure 4 Steps of gradient algorithm
Figure shows the step by step procedure of gradient algorithm for optic disc and optic cup segmentation. Input image
Apply Euler Remapping or Gaussian Function
Define Initial Contour
Apply SPF Function on Initial Level set
Optimize Initial Contour By Gradient Descent Method
Define Convergence Criteria of Gradient Descent
Convert Final Optimized Image to Gray Level
4. Apply SPF function on initial level set for modulates the sign of pressure force inside and outside the region of interest based on minimizing and maximizing the energy function of curve.
Where, C1 and C2, are two constants which are the average intensities inside and outside the contour, Ω is planer curve.
5. Optimize initial contour of Gradient Descent method for local minimization of function.
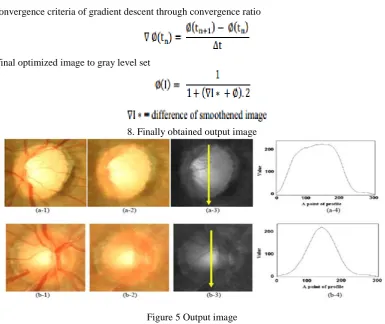
6. Define Convergence criteria of gradient descent through convergence ratio
7. Convert final optimized image to gray level set
8. Finally obtained output image
Figure 5 Output image
DETERMINATION OF CUP-TO-DISC RATIO
The vertical C/D ratio is most important factor for diagnosis of glaucoma, because the contrast of the cup region and the rim one was high. Here, glaucoma cases tend to have enlarged cup regions as against the normal cases. (In other words, the bright region is extended in many cases.) Thus, while comparing the optic disc profiles, the profile for normal cases tend to appear as a narrow mountain with long skirts, while that for glaucoma cases appears as a broad mountain with short skirts, as shown in Figure. The images were preprocessed before obtaining the profile. First, a blood-vessel-erased image was created. Since there is high contrast between the cup and disc regions in the blue channel of a color image, a blue component was used for subsequent analysis. Thus, the fundus image is classified into the right and left image by comparing the pixel value in right and left side of an optic disc region, because the nose side of an optic disc was then aver-aged so that the result would not depend on the specific line selected. This profile was smoothed as shown in Figure (b), and impulses if any were removed, in order to reduce the effect of noise and remaining blood vessels. After that, we determined the skirt region of the profile as the rim region. The skirt region was determined by the empirical threshold value of profile (as shown in Figure (c)). The edge of the skirt region and mountain one was determined as the cup edge. Finally, C/D ratio was measured by using the cup edge and disc region. CDR is the ratio between the Vertical Cup Diameter (VCD) &Vertical Disc Diameter (VDD).
CDR =VCD/VDD
Figure 6 An analysis of profile. (a) Original profile. (b) Smoothed profile. (c) Determination of cup edge.
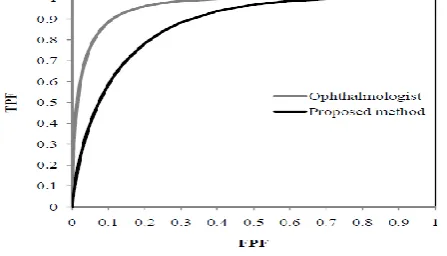
In figure, gray regions show rim regions, and a dashed line shows a thresholding value of determination of cup edge. The minimum distance between two gray region was cup diameter. Although C/D ratios of an ophthalmologist and a proposed method were similar in normal cases, the errors of an ophthalmologist and a proposed method were high in glaucoma cases.
Figure 7 Comparison of ROC curves of ophthalmologist and proposed method
Figure 8 Comparison of C/D ratio measured by an ophthalmologist and the proposed method
In figure, Case 1-10 shows normal cases, and case 11-20 shows glaucoma cases. Horizontal dashed line shows a threshold value for determination of glaucoma. A threshold value of determination of glaucoma was set 0.6.
RESULT OF GLAUCOMA
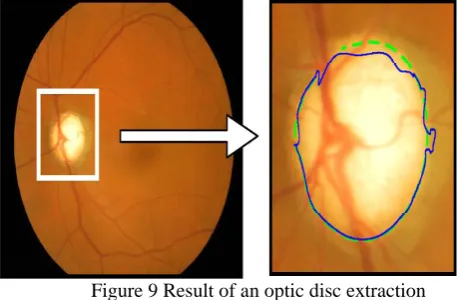
This method was useful in the extraction of disc regions with a concordance rate of 86%, which expresses the area of intersection as a percentage of the area of union. This method correctly extracted on average 96% of the disc regions determined by the ophthalmologist, whereas it over extracted 11% of the disc regions. In contrast, the concordance rate using previous method was 63% when the extraction rate was 83% and the over-extraction rate was 28%. Although the previous method mis-extracted slightly in the top of the disc region, it could extract the approximate disc region. Compared with the previous method, this method can be useful for detecting the optic disc in glaucoma examinations.
Figure 9 Result of an optic disc extraction
In figure, solid line shows the result of the proposed method. Dashed line shows a sketch by an ophthalmologist.
VI. RESULTS AND DISCUSSION
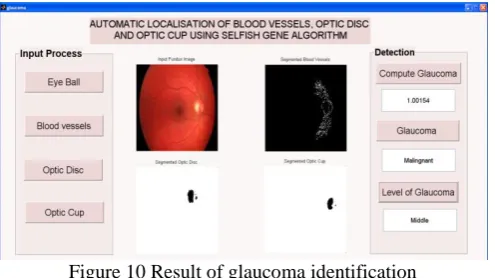
Figure 10 Result of glaucoma identification
Figure shows that the level of glaucoma is identified as middle level for the given input image.
VII. CONCLUSION AND FUTURE WORK
In this paper, simulation is carried out for extracting the features like size, area and shape of the optic disc and optic cup. The glaucoma disease for the 20 input images is detected by comparing these features with the features of database images using MATLAB 7 software. In the future, the glaucoma disease can be identified for more images and its accuracy can be improved and the hardware implementation can be done.
REFERENCES
[1]A. Hoover, V. Kouznetsova, and M. Goldbaum. “Locating blood vessels in retinal images by piecewise threshold probing of a matched filter response” IEEE 2000
[2]F. Zana and J.-C. Klein. “Segmentation of vessel-like patterns using mathematical morphology and curvature evaluation” IEEE 2001
[3] J. Staal, M. D. Abramoff, M. Niemeijer, M. A. Viergever, and B. van Ginneken.“Ridge-based vessel segmentation in color images of the Retina” IEEE 2004
[4] Aquino, M. E. Geg´undez-Arias, and D. Mar. “Detecting the optic disc boundary in digital fundus images using morphological, edge detection, and feature extraction techniques” IEEE 2010
[5] R. Geetha Ramani," Automatic Prediction of Diabetic Retinopathy and Glaucoma through Retinal Image Analysis and Data mining techniques”
[6] A. G. Salazar-Gonzalez, Y. Li, and X. Liu. “Retinal blood vessel segmentation via graph cut” IEEE 2010
[7] A. Salazar-Gonzalez, Y. Li, and X. Liu. “Optic disc segmentation by incorporating blood vessel compensation” IEEE 2011
[8] Zhuo Zhang," ORIGA-light : An Online Retinal Fundus Image Database for Glaucoma Analysis and Research", 32nd Annual
International Conference of the IEEE EMBSBuenos Aires, Argentina, August 31 - September 4, 2010 [9] WWW.MEDICALNEWSTODAY.COM
[10] A. M. Mendonca and A. Campilho “Segmentation of retinal blood vessels by combining the detection of centerlines and morphological reconstruction” IEEE 2006
[11] Nilan jan Dey," Optical Cup to Disc Ratio Measurement for Glaucoma Diagnosis Using Harris Corner", ICCCNT12
[12] R. Chrastek, M. Wolf, K. Donath, H. Niemann, D. Paulus, T. Hothorn, B. Lausen, R. Lammer, C. Y. Mardin, and G. Michelson. “Automated segmentation of the optic nerve head for diagnosis of glaucoma” IEEE 2005.