Clinical Interventions in Aging
Dove
press
O r I g I n A l r e s e A r C h
open access to scientific and medical research
Open Access Full Text Article
Visual-spatial perception: a comparison between
instruments frequently used in the primary care
setting and a computerized cognitive assessment
battery
Boris Punchik1–3
Avital shapovalov2
Tzvi Dwolatzky4,5
Yan Press1–3
1Comprehensive geriatric Assessment
Unit, Clalit health Care services, Yassky Clinic, 2sial Center for
research in Family Medicine, Faculty of health sciences, 3
Community-Based geriatric Unit, The Division of Community health, 4Center for
Multidisciplinary research in Aging, Faculty of health sciences, Ben gurion University of the negev, Beer sheva, 5geriatric Unit, rambam health
Care Campus, haifa, Israel
Background: The development of screening instruments will help the primary care team to determine when further comprehensive cognitive assessment is necessary.
Design: A retrospective analysis based on medical records.
Patients and setting: Patients referred to a comprehensive geriatric assessment unit.
Analysis: Cognitive screening and assessment included visual-spatial components: the Mini Mental State Examination, the Clock Drawing Test, the Montreal Cognitive Assessment Test, and the Neurotrax (Mindstreams) computerized cognitive assessment battery.
Results: The average age of the 190 eligible patients was 81.09±5.42 years. Comparing the individual tests with that of the visual-spatial index of Neurotrax, we found the Trail Making B test to be most sensitive (72.4%) and the Cube Test to have the highest specificity (72.8%). A combination of tests resulted in higher sensitivity and lower specificity.
Conclusion: The use of a combination of visual-spatial tests for screening in neurocognitive disorders should be evaluated in further prospective studies.
Keywords: visual-spatial perception, mild cognitive impairment, cognitive assessment, screen-ing tools
Introduction
Cognitive decline associated with advancing age is one of the most important challenges currently facing health care providers, both in the spheres of diagno-sis and management and in the delivery of supportive services to the patient and caregivers.1–3 The spectrum of neurocognitive decline from subjective cognitive
complaints to mild cognitive impairment (MCI) and ultimately to a progressive dementia syndrome places the primary care physician at the forefront in providing care for a growing number of cognitively impaired older patients, the majority of whom reside in the community. While systematic population screening for cognitive impairment has not been shown to be effective,4,5 the assessment of patients who
are referred to the clinic for cognitive symptoms and decreased cognitive function is recommended.6–8
MCI is a clinical syndrome that has been clearly defined, both in the clinical situation and in research settings.7,9,10 MCI is prevalent in the older population, with
some 15% of those older than 65 years having this condition, with a range of 3%–42% reported in community-based studies.11–13 The presence of predominant memory
complaints and impairment alongside the preservation of function in instrumental Correspondence: Boris Punchik
Comprehensive geriatric Assessment Unit, Clalit health Care services, Yassky Clinic, 24 King David street, 84539, Beer sheva, Israel
Tel +972 8 640 2630 Fax +972 8 647 7623 email [email protected]
Journal name: Clinical Interventions in Aging Article Designation: Original Research Year: 2015
Volume: 10
Running head verso: Punchik et al
Running head recto: Visual-spatial perception battery DOI: http://dx.doi.org/10.2147/CIA.S92819
Clinical Interventions in Aging downloaded from https://www.dovepress.com/ by 118.70.13.36 on 20-Aug-2020
For personal use only.
Number of times this article has been viewed
This article was published in the following Dove Press journal: Clinical Interventions in Aging
Dovepress
Punchik et al
daily activities suggests amnestic MCI, and this is gener-ally considered to represent an early stage of Alzheimer’s disease.9,10,14 Approximately 10% of patients with MCI will
progress to dementia annually.15,16
In a longitudinal archival study,17 it was shown that
changes in visual-spatial perception sometimes appear in the preclinical phase of dementia as early as 3 years before the diagnosis of dementia, while memory decline occurs some 2 years before diagnosis.
The purpose of this study was to examine whether the use of visual-spatial perception testing (as a component of existing screening tools for the early detection of cognitive impairment) is of value for the determination of cognitive impairment, as compared to the visual-spatial component of a more comprehensive computerized neurocognitive battery used for cognitive assessment.
Methods
We performed a retrospective analysis based on medical records from the years 2005 to 2010 of patients seen at the comprehensive geriatric assessment (CGA) unit of the Clalit Health Services in Beer Sheva, Israel. The multidisciplinary staff of the CGA unit include specialist geriatricians, geriat-ric nurses, a dietician, an occupational therapist, a physical therapist, and a social worker.
The study population included patients older than 65 years referred by the primary care physician for geriatric assessment. The assessment battery included the following components: 1) Demographics, including age, gender, and education level. 2) History and examination, with emphasis on medical history and physical examination, drug therapy, laboratory and other investigations (available via the com-puterized medical record system), psychosocial assessment, and nutritional status. 3) Depression screening by Patient Health Questionnaire.18 4) Basic Activity of Daily Living.19,20
5) Instrumental Activity of Daily Living (the Older Americans Resources and Service Instrumental Activity of Daily Living).21 6) Comorbidity status (Charlson
comorbid-ity index22 and cumulative illness rating scale – geriatric
version).23 7) Cognitive screening was performed using the
following instruments: a) Mini Mental State Examination, rated on a scale of 0–30;24 b) Clock Drawing Test (CDT)
rated on a scale of 0–2;25,26 c) Montreal Cognitive
Assess-ment (MoCA) test rated on a scale of 0–30;27 d) Neurotrax
(Mindstreams) computerized cognitive assessment battery, validated for use in the elderly.28–30
The visual-spatial components of each of the afore-mentioned instruments were compared. A dichotomy score
of either normal or abnormal was allocated for each of the tests as follows:
1) Mini Mental State Examination: The intersecting pentagons were rated as normal (score 1) or abnormal (score 0). 2) CDT as normal (score 2) or abnormal (1 or 0). Scores were allocated as follows: 0 – neither numbers nor hands are present, or they have been placed incorrectly; 1 – the hands are present and they have been placed cor-rectly, and numbers are either missing or incorrectly placed; 2 – both hands and numbers are present and have been placed correctly. 3) Cube Drawing Test component of the MoCA test as normal (score 1) or abnormal (score 0). 4) Trail Making B test component of MoCA test as normal, where all points (letters and numbers) are con-nected in the correct order (score 1), or at least one point is missed or not in the correct sequence (score 0). 5) Visual-spatial index of the Neurotrax (Mindstreams) computerized cognitive assessment battery (a score of #85, representing one standard deviation [SD] below normal was scored as 0, and .85 as 1).
A diagnosis of dementia was made according to DSM-IV criteria31 and of MCI according to consensus criteria for
MCI.7,9,10
The study was approved by the Ethics Committee of Clalit Health Services at the Meir Medical Center.
statistical analysis
We calculated sensitivity, specificity, positive predictive value (PPV), and negative predictive value (NPV) for each of the measures for determining cognitive impairment. • Sensitivity = true positive/gold standard positive • Specificity = true negative/gold standard negative • PPV = true positive/test outcome positive • NPV = true negative/test outcome negative
Using the visual-spatial index of the Neurotrax (Mind-streams) assessment battery as the reference,28–30 the other
tests were compared both individually and in varied combina-tions, in order to determine sensitivity and specificity, PPV, and NPV. Chi-square analysis was performed with P,0.05 considered to be statistically significant.
Results
study population
A total of 190 patients assessed at the CGA unit over the years 2005–2010 with data available for all the study instruments were eligible for inclusion in the study (Table 1).
The average age and SD was 81.09±5.42 years (range: 67–94), and 111 (58.4%) were females. The mean education
Clinical Interventions in Aging downloaded from https://www.dovepress.com/ by 118.70.13.36 on 20-Aug-2020
Dovepress Visual-spatial perception battery
Table 1 Characteristics of study participations (n=190)
Baseline variables N %
sex
Male 79 41.6
Female 111 58.4
Age (years)
range 67–94
Mean ± sD 81.09±5.42
Cognitive diagnosis
normal 62 32.6
MCI 90 47.4
Dementia, total 38 20
Alzheimer type 27 71
Vascular type 9 23.8
lewy body type 1 2.6
Others 1 2.6
Years of education
range 0–25
Mean ± sD 13.83±10.02
Depression screening (by PhQ-9)
Total 127 (63 missing data)
range 1–27
Mean ± sD 12.9±6.6
Basic Activity of Daily living (BADl)
Total 154 (36 missing data)
range 35–100
Mean ± sD 92.06±11.89
Instrumental Activity of Daily living (IADl)
Total 146 (44 missing data)
range 0–14
Mean ± sD 9.60±3.55
Charlson combined score (with age)
range 3–11
Mean ± sD 5.28±1.65
Total CIrs-g score
range 4–19
Mean ± sD 10.91±4.66
severity index (total CIrs-g score/total number of categories endorsed)
range 1.3–2.6
Mean ± sD 1.99±0.27
Abbreviations: sD, standard deviation; MCI, mild cognitive impairment; PhQ-9, Patient health Questionnaire-9; CIrs-g, cumulative illness rating scale – geriatric version.
level was 13.83 years (SD ±10.02). Based on clinical and cognitive assessment, 62 (32.6%) of the patients were deter-mined to be cognitively normal, 90 (47.4%) were diagnosed as having MCI, and 38 (20%) were diagnosed as having dementia. Of those with dementia, 27 (71%) patients were diagnosed with Alzheimer’s disease, nine (23.8%) with vas-cular dementia, one (2.6%) with diffuse Lewy body dementia, and one (2.6%) with other dementia.
Cognitive evaluations
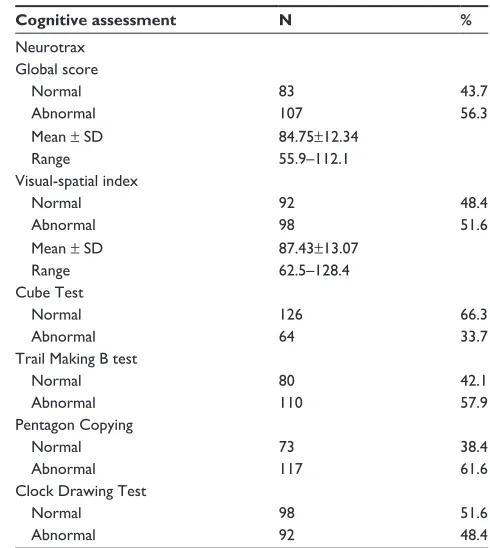
The results of the cognitive assessments are presented in Table 2.
With regard to the Neurotrax computerized cognitive assessment, a total of 107 (56.3%) subjects scored below
Table 2 selected outcomes cognitive assessment of study population
Cognitive assessment N %
neurotrax global score
normal 83 43.7
Abnormal 107 56.3
Mean ± sD 84.75±12.34
range 55.9–112.1
Visual-spatial index
normal 92 48.4
Abnormal 98 51.6
Mean ± sD 87.43±13.07
range 62.5–128.4
Cube Test
normal 126 66.3
Abnormal 64 33.7
Trail Making B test
normal 80 42.1
Abnormal 110 57.9
Pentagon Copying
normal 73 38.4
Abnormal 117 61.6
Clock Drawing Test
normal 98 51.6
Abnormal 92 48.4
Abbreviation: sD, standard deviation.
one SD from the normal (,85%) on the global score index. For the visual-spatial index, 98 subjects (51.6%) scored below one SD.
With regard to abnormal results for the other cognitive tests, the Cube Test was abnormal in 64 subjects (33.7%), the Trail Making B test in 110 (57.9%), the Intersecting Pentagon Copying (IPC) test in 117 (61.6%) subjects, and the CDT was abnormal in 92 (48.4%).
Comparing the individual cognitive tests with that of the visual-spatial index of Neurotrax, we found the Trail Making B test to be most sensitive (72.4%) and the Cube Test to have the highest specificity (72.8%) (Table 3).
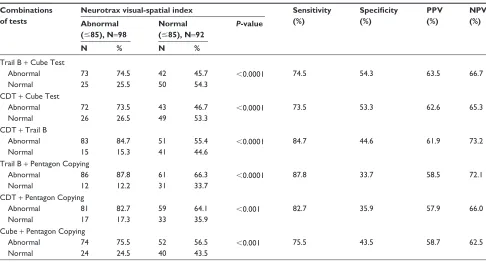
The effect of combining two different tests, Trail Making B and IPC, was a higher sensitivity of 87.8%. The highest specificity of combined tests was for Trail Making B test and the Cube Test (54.3%) (Table 4).
When looking at the combined effect of three tests compared to the visual-spatial index, the highest sensi-tivity was 88.8% for a combination of Trail Making B test, Cube Test, and IPC. This combination also had the highest specificity of 33.7% compared to other multiple combinations of tests. When looking at the combination of all four tests, the sensitivity was 93.9%, and specificity was 27.2% (Table 5).
Clinical Interventions in Aging downloaded from https://www.dovepress.com/ by 118.70.13.36 on 20-Aug-2020
Dovepress
Punchik et al
Table 3 Comparison between single tools and visual score of neurotrax test for evaluation of visual-spatial ability
Type of tests
Neurotrax visual-spatial index Sensitivity
(%)
Specificity (%)
PPV (%)
NPV (%) Abnormal
(#85), N=98
Normal (.85), N=92
P-value
N % N %
Cube Test
Abnormal 39 39.8 25 27.2 0.091 39.8 72.8 60.9 53.2
normal 59 60.2 67 72.8
Trail Making B test
Abnormal 71 72.4 39 42.4 ,0.0001 72.4 57.6 64.5 66.3
normal 27 27.6 53 57.6
Pentagon Copying
Abnormal 67 68.4 50 54.3 0.053 68.4 45.7 57.3 57.5
normal 31 31.6 42 45.7
Clock Drawing Test
Abnormal 64 65.3 34 37.0 ,0.0001 65.3 63.0 65.3 63.0
normal 34 34.7 58 63.0
Abbreviations: PPV, positive predictive value; nPV, negative predictive value.
Table 4 Comparison between two integrated single tools and visual score of neurotrax test for evaluation of visual-spatial ability
Combinations of tests
Neurotrax visual-spatial index Sensitivity
(%)
Specificity (%)
PPV (%)
NPV (%) Abnormal
(#85), N=98
Normal (#85), N=92
P-value
N % N %
Trail B + Cube Test
Abnormal 73 74.5 42 45.7 ,0.0001 74.5 54.3 63.5 66.7
normal 25 25.5 50 54.3
CDT + Cube Test
Abnormal 72 73.5 43 46.7 ,0.0001 73.5 53.3 62.6 65.3
normal 26 26.5 49 53.3
CDT + Trail B
Abnormal 83 84.7 51 55.4 ,0.0001 84.7 44.6 61.9 73.2
normal 15 15.3 41 44.6
Trail B + Pentagon Copying
Abnormal 86 87.8 61 66.3 ,0.0001 87.8 33.7 58.5 72.1
normal 12 12.2 31 33.7
CDT + Pentagon Copying
Abnormal 81 82.7 59 64.1 ,0.001 82.7 35.9 57.9 66.0
normal 17 17.3 33 35.9
Cube + Pentagon Copying
Abnormal 74 75.5 52 56.5 ,0.001 75.5 43.5 58.7 62.5
normal 24 24.5 40 43.5
Abbreviations: PPV, positive predictive value; nPV, negative predictive value; CDT, Clock Drawing Test.
Discussion
Our results show that tests of visual-spatial function are use-ful for screening patients for impaired cognitive function. While most screening instruments currently in use include an evaluation of visual-spatial function as one component of the test,24–29 no screening tool is based solely on this aspect
of cognitive function. The high sensitivity found for the combination of all four tests that were administered was associated with a low specificity. Our results suggest that when at least one of the tests is abnormal, further cognitive assessment is indicated.
The high sensitivity of the combined tests may eliminate the need for further cognitive screening. The time required to administer these four tests varies from 3 to 5 minutes, which is certainly acceptable for screening. These tests are all simple paper-based tests that can be easily administered in the clinic or home setting by nonprofessional staff who have received the necessary training (Table 5).
To the best of our knowledge, this is the first such study to evaluate the combined value of screening tests for visual-spatial function in cognitive assessment. The use in this study of the Neurotrax visual-spatial index based on the
Clinical Interventions in Aging downloaded from https://www.dovepress.com/ by 118.70.13.36 on 20-Aug-2020
Dovepress Visual-spatial perception battery
Table 5 Comparison between three and four integrated tools and visual score of neurotrax test for evaluation of visual-spatial ability
Type of tests
Neurotrax visual-spatial index Sensitivity
(%)
Specificity (%)
PPV (%)
NPV (%) Abnormal
(#85), N=98
Normal (#85), N=92
P-value
N % N %
Cube + Pentagon + Trail B
Abnormal 87 88.8 61 66.3 ,0.0001 88.8 33.7 58.8 73.8
normal 11 11.2 31 33.7
CDT + Cube + Pentagon + Trail B
Abnormal 92 93.9 67 72.8 ,0.0001 93.9 27.2 57.9 80.6
normal 6 6.1 25 27.2
Abbreviations: PPV, positive predictive value; nPV, negative predictive value; CDT, Clock Drawing Test.
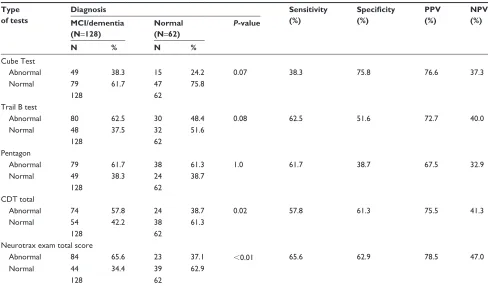
Table 6 Sensitivity and specificity of individual tests compared with clinical diagnosis
Type of tests
Diagnosis Sensitivity
(%)
Specificity (%)
PPV (%)
NPV (%) MCI/dementia
(N=128)
Normal (N=62)
P-value
N % N %
Cube Test
Abnormal 49 38.3 15 24.2 0.07 38.3 75.8 76.6 37.3
normal 79 61.7 47 75.8
128 62
Trail B test
Abnormal 80 62.5 30 48.4 0.08 62.5 51.6 72.7 40.0
normal 48 37.5 32 51.6
128 62
Pentagon
Abnormal 79 61.7 38 61.3 1.0 61.7 38.7 67.5 32.9
normal 49 38.3 24 38.7
128 62
CDT total
Abnormal 74 57.8 24 38.7 0.02 57.8 61.3 75.5 41.3
normal 54 42.2 38 61.3
128 62
neurotrax exam total score
Abnormal 84 65.6 23 37.1 ,0.01 65.6 62.9 78.5 47.0
normal 44 34.4 39 62.9
128 62
Abbreviations: PPV, positive predictive value; nPV, negative predictive value; MCI, mild cognitive impairment; CDT, Clock Drawing Test.
Block Design of the Wechsler Adult Intelligence Scale-332 as
the reference test, as well as the use of a cognitive diagnosis based on a CGA by a multidisciplinary team, strengthens the value of our findings.
Our study has a number of limitations. We performed a retrospective analysis based on the charts of patients referred to a single CGA unit in the southern district of Israel. Our patients spoke either Hebrew or Russian as their primary language and were all of Jewish ethnicity. Thus, the general-izability of our results is limited. The choice of a computer-ized cognitive assessment battery as the gold standard rather than formal neuropsychological assessment is a possible
limitation. However, the Neurotrax battery has been well validated in numerous studies.28–30 We realize that many of
the tests that we used are not limited to visual-spatial func-tion but that they assess other aspects of cognitive funcfunc-tion as well, particularly executive function. The overlap with other cognitive functions may clearly have a confounding effect on our results.
We also acknowledge that most conditions causing the dementia syndrome present primarily with memory, language, and executive function deficits, at least initially, and that impaired visual-spatial function in itself does not constitute one of the usual diagnostic criteria (Table 6).
Clinical Interventions in Aging downloaded from https://www.dovepress.com/ by 118.70.13.36 on 20-Aug-2020
Dovepress
Punchik et al
Conclusion
The combination of four short, paper-based tests, namely the Trail Making B test, the Cube Test, the IPC test, and the CDT, was found to be highly sensitive (93.9%) for identifying subjects with cognitive impairment, when compared to the Neurotrax (Mindstreams) computerized cognitive assessment battery. The use of a combination of visual-spatial tests for screening in neurocognitive disorders should be evaluated in further prospective studies.
Disclosure
The authors declared no potential conflicts of interest with respect to the research, authorship, and/or publication of this article.
References
1. Hebert LE, Scherr PA, Bienias JL, Bennett DA, Evans DA. Alzheimer disease in the US population: prevalence estimates using the 2000 census. Arch Neurol. 2003;60(8):1119–1122.
2. 2012 Facts and Figures Alzheimer’s Disease Facts and Figures. 2012. Available from: https://www.alz.org/downloads/facts_figures_2012.pdf 3. Mitchell AJ, Shiri-Feshki M. Rate of progression of mild cognitive
impairment to dementia – meta-analysis of 41 robust inception cohort studies. Acta Psychiatr Scand. 2009;119(4):252–265.
4. Canadian Agency for Drugs and Technologies in Health. Screening Tools to Identify Adults with Mild Cognitive Impairment Not Associ-ated with Dementia: A Review of Diagnostic Accuracy, Effectiveness and Guidelines. 2013. Available from: https://www.cadth.ca/media/ pdf/htis/sep-2013/RC0475_Mild%20Cognitive%20Impairment%20 Final.pdf. Accessed November 13, 2015.
5. Lin JS, O’Connor E, Rossom RC, et al. U.S. preventive services task force evidence syntheses, formerly systematic evidence reviews.
Screening for Cognitive Impairment in Older Adults: An Evidence Update for the U.S. Preventive Services Task Force. Rockville, MD:
Agency for Healthcare Research and Quality (US); 2013.
6. State of Israel, Ministry of Health [webpage on the Internet]. The Israel National Program for Prophylaxis and Treatment of Alzheimer’s Disease and Other Dementias. 2013. Available from: State of Israel, Ministry of Health, 2013. http://www.health.gov.il/English/Topics/ SeniorHealth/DEMENTIA/Pages/National_program.aspx. Accessed November 13, 2015.
7. Albert MS, DeKosky ST, Dickson D, et al. The diagnosis of mild cog-nitive impairment due to Alzheimer’s disease: recommendations from the National Institute on Aging-Alzheimer’s Association workgroups on diagnostic guidelines for Alzheimer’s disease. Alzheimers Dement. 2011;7(3):270–279.
8. Cordell CB, Borson S, Boustani M, et al; Medicare Detection of Cogni-tive Impairment Workgroup. Alzheimer’s Association recommenda-tions for operationalizing the detection of cognitive impairment during the medicare annual wellness visit in a primary care setting. Alzheimers
Dement. 2013;9(2):141–150.
9. Petersen RC, Smith GE, Waring SC, Ivnik RJ, Tangalos EG, Kokmen E. Mild cognitive impairment: clinical characterization and outcome.
Arch Neurol. 1999;56(3):303–308.
10. Winblad B, Palmer K, Kivipelto M, et al. Mild cognitive impairment – beyond controversies, towards a consensus: report of the international working group on mild cognitive impairment. J Intern Med. 2004; 256(3):240–246.
11. Artero S, Petersen R, Touchon J, Ritchie K. Revised criteria for mild cognitive impairment: validation within a longitudinal population study.
Dement Geriatr Cogn Disord. 2006;22(5–6):465–470.
12. Busse A, Bischkopf J, Riedel-Heller SG, Angermeyer MC. Mild cognitive impairment: prevalence and incidence according to different diagnostic criteria. Results of the Leipzig Longitudinal Study of the Aged (LEILA75+). Br J Psychiatry. 2003;182:449–454.
13. Ward A, Arrighi HM, Michels S, Cedarbaum JM. Mild cognitive impairment: disparity of incidence and prevalence estimates. Alzheimers
Dement. 2012;8(1):14–21.
14. Ravaglia G, Forti P, Maioli F, et al. Conversion of mild cognitive impairment to dementia: predictive role of mild cognitive impairment subtypes and vascular risk factors. Dement Geriatr Cogn Disord. 2006; 21(1):51–58.
15. Bennett DA, Wilson RS, Schneider JA, et al. Natural history of mild cog-nitive impairment in older persons. Neurology. 2002;59(2):198–205. 16. Bruscoli M, Lovestone S. Is MCI really just early dementia? A
sys-tematic review of conversion studies. Int Psychogeriatr. 2004;16(2): 129–140.
17. Johnson DK, Storandt M, Morris JC, Galvin JE. Longitudinal study of the transition from healthy aging to Alzheimer disease. Arch Neurol. 2009;66(10):1254–1259.
18. Kroenke K, Spitzer RL, Williams JB. The PHQ-9: validity of a brief depression severity measure. J Gen Intern Med. 2001;16(9):606–613. 19. Mahoney FI, Barthel DW. Functional evaluation: the barthel index. Md
State Med J. 1965;14:61–65.
20. Wade DT, Collin C. The Barthel ADL index: a standard measure of physical disability? Int Disabil Stud. 1988;10(2):64–67.
21. Doble SE, Fisher AG. The dimensionality and validity of the Older Americans Resources and Services (OARS) Activities of Daily Living (ADL) scale. J Outcome Meas. 1998;2(1):4–24.
22. Charlson ME, Pompei P, Ales KL, MacKenzie CR. A new method of classifying prognostic comorbidity in longitudinal studies: development and validation. J Chronic Dis. 1987;40(5):373–383.
23. Linn BS, Linn MW, Gurel L. Cumulative illness rating scale. J Am
Geriatr Soc. 1968;16(5):622–626.
24. Folstein MF, Folstein SE, McHugh PR. “Mini-mental state”. A practi-cal method for grading the cognitive state of patients for the clinician.
J Psychiatr Res. 1975;12(3):189–198.
25. Kokmen E, Naessens JM, Offord KP. A short test of mental status: description and preliminary results. Mayo Clin Proc. 1987;62(4): 281–288.
26. Korner EA, Lauritzen L, Nilsson FM, Lolk A, Christensen P. Simple scoring of the clock-drawing test for dementia screening. Dan Med J. 2012;59(1):A4365.
27. Nasreddine ZS, Phillips NA, Bédirian V, et al. The Montreal Cognitive Assessment, MoCA: a brief screening tool for mild cognitive impair-ment. J Am Geriatr Soc. 2005;53(4):695–699.
28. Doniger GM, Zucker DM, Schweiger A, et al. Towards practical cognitive assessment for detection of early dementia: a 30-minute computerized battery discriminates as well as longer testing. Curr
Alzheimer Res. 2005;2(2):117–124.
29. Dwolatzky T, Whitehead V, Doniger GM, et al. Validity of a novel computerized cognitive battery for mild cognitive impairment. BMC
Geriatr. 2003;3:4.
30. Dwolatzky T, Dimant L, Simon ES, Doniger GM. Validity of a short computerized assessment battery for moderate cognitive impairment and dementia. Int Psychogeriatr. 2010;22(5):795–803.
31. American Psychiatric Association. Diagnostic and Statistical Manual of Mental Disorders. 1994. Available from: http://www.psychiatry.org/ psychiatrists/practice/dsm. Accessed November 13, 2015.
32. Silva MA. Development of the WAIS-III: a brief overview, history, and description. Grad J Couns Psychol. 2008;1(1):1–19.
Clinical Interventions in Aging downloaded from https://www.dovepress.com/ by 118.70.13.36 on 20-Aug-2020
Clinical Interventions in Aging
Publish your work in this journal
Submit your manuscript here: http://www.dovepress.com/clinical-interventions-in-aging-journal
Clinical Interventions in Aging is an international, peer-reviewed journal focusing on evidence-based reports on the value or lack thereof of treatments intended to prevent or delay the onset of maladaptive correlates of aging in human beings. This journal is indexed on PubMed Central, MedLine,
CAS, Scopus and the Elsevier Bibliographic databases. The manuscript management system is completely online and includes a very quick and fair peer-review system, which is all easy to use. Visit http://www.dovepress. com/testimonials.php to read real quotes from published authors.
Dovepress
Dove
press
Visual-spatial perception battery
Clinical Interventions in Aging downloaded from https://www.dovepress.com/ by 118.70.13.36 on 20-Aug-2020