A Weighted Least Squares Solution for Space
Intersection of Spaceborne Stereo SAR Data
Pu-Huai Chen and Ian J. Dowman
Abstract—The use of stereoscopic SAR images offers an alter-native to interferometric SAR for the generation of digital eleva-tion models (DEMs). The stereo radargrammetric method is ro-bust and can generate DEMs of sufficient accuracy to geocode SAR images. Previous work has shown that ground coordinates with ac-curacy of four times the resolution cell can be obtained from ERS data without using any ground control points (GCPs), where the high accuracy of the orbit and satellite position of the order of meters introduce insignificant errors into the intersection proce-dure. The orbit data for RADARSAT is not as accurate as that for ERS, and the perpendicular relationship between the resultant ve-locity vector and the resultant range vector is uncertain in terms of image geometry. Hence, it is necessary to refine the method to allow for possible errors. This paper introduces a weighted space inter-section algorithm based on an analysis of the predicted errors. A radargrammetric error model for observation errors is also formu-lated to predict the accuracy of the algorithm. The revised method can be used without any GCPs, but this can lead to systematic er-rors due to less accurate orbit data, and it has been found that the use of two GCPs provides a reasonable solution. The method is in-sensitive to the spatial distribution of GCPs, which is often critical in traditional methods. The error statistics of the results generated from 32 independent check points, distributed through the entire SAR image, approach the predicted errors and give positional ac-curacy of 38 m in three dimensions.
Index Terms—DEM, orbit, RADARSAT, stereo SAR.
I. INTRODUCTION
R
ADARSAT can provide images with a variety of bases and look angles and so for the first time digital eleva-tion models (DEMs) can be generated using stereoscopic prin-ciples from spaceborne synthetic aperture radar (SAR) image pairs on a routine basis. Experiments of the repeat-pass inter-ferometric SAR (IfSAR) technique show that the method often gives poor results due to poor scene coherence and to different atmospheric conditions. For this reason, the stereoscopic SAR method presents an important alternative for terrain mapping.Several photogrammetric methods have been proposed to re-construct DEMs from SAR data [1]. A major disadvantage of these methods is that ground control points (GCPs) are needed to determine the parameters of the stereo models [2], [3]. GCPs are the reference points providing the basis for radargrammetric model setup or the connections between coordinate tions. If the GCPs are being used to carry out this
transforma-Manuscript received November 4, 1999; revised June 6, 2000. This work was supported by RSI under the RADARSAT ADRO Program 136. The RADARSAT SAR data used for the work described in this paper was provided by RSI.
The authors are with the Department of Geomatic Engineering, University College London, London WC1E 6BT, U.K. (e-mail: [email protected]).
Publisher Item Identifier S 0196-2892(01)01173-1.
tion, as opposed to being used as check points, then the radar-grammetric algorithm can be sensitive to the number and the dis-tribution of the GCPs required. It is often very difficult and time consuming to determine a sufficient number of well distributed GCPs in SAR images and this has proved to be a problem in using SAR data for terrain mapping. Reducing the sensitivity of the radargrammetric model to the number and the distribution of GCPs required is therefore a major issue in the paper.
The previous work on shuttle image radar (SIR-B) data and European remote sensing satellite (ERS-1) data at University College London (UCL), London, U.K., suggests that the stereo-scopic SAR approach is a promising tool for producing DEMs from spaceborne SAR data [4]–[6]. The authors have proposed particularly an analytic approach to carry out space intersection by using a least squares adjustment for ERS-1 data and reported results without using any GCPs when good quality orbit data are available [7]. GCPs are used for systematic correction of coor-dinate transformation for the resultant DEMs at the last stage if necessary. The approach primarily utilizes two Doppler equa-tions and two range equaequa-tions to obtain the position of an un-known ground point.
The need for GCPs is less when good orbit data is available and when there are minimal errors in the orthogonal relation-ship between the azimuth direction (the resultant velocity vector considering the Earth rotation) and the range (the resultant range vector relating the sensor to a ground point). Hence, reasonable results have been obtained with ERS data with no GCPs [7]. However, the orbit data for RADARSAT is not as accurate as for ERS and the reliability of the orthogonal relationship be-tween the azimuth direction and the range is uncertain, hence it is necessary to refine the intersection method to allow for these possible errors. It is proposed in this paper that the weighting matrix in the least squares adjustment be designed to solve these problems. In general, the proposed weighting matrix helps make the radargrammetric model insensitive to the effects from the azimuth timing error as well as those from the uncertain orthog-onal relationship between the azimuth direction and the range. The method presented is designed to use the minimum number of GCPs and to give a better solution than, or at least similar to, the traditional methods. The use of the weighting matrix for de-termining unknown ground points, leading to the generation of DEMs [8], is described in Section II. A revised error model for the algorithm is discussed in Section III to show the robustness of the proposed method and to be compared with the test results. The paper demonstrates the proposed radargrammetric model is not only robust to the error from uncertain orthogonal rela-tionship between the azimuth direction and the range, but also independent from the need of accurate orbit data and of GCPs,
thus showing that it is superior to other methods. GCPs are only used for systematic correction and the minimal requirement of the number of GCPs is two. The superiority and robustness of the proposed technique is validated by the test results of 32 in-dependent check points in Section IV.
II. THEORY
A. Rigorous Stereo Method
Two basic equations for each orbit can be treated as observa-tion equaobserva-tions in space intersecobserva-tion.
Doppler equation
(1)
Range equation
(2)
is the Doppler central frequency, the wave length, and the velocity vector of sensor and target, respectively, , the position vector of sensor and ground point, respectively, and
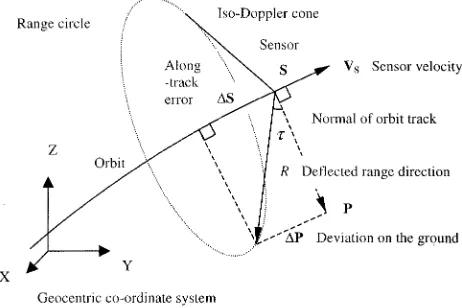
the range timing value between sensor and ground point. is the squint angle of the surface of a Doppler cone with respect to the normal plane, which is perpendicular to the velocity vector
, as shown in Fig. 1.
When 0, a nominal zero-Doppler image is obtained, and the resultant velocity vector ( ) is perpendicular to the resultant range vector ( - ), or 0. Thus, the problem of space intersection could be solved for an unknown ground point using (1) and (2) from two same-side orbits to form observation equations
(3a)
(3b)
(3c)
(3d)
These are used to form the normal equation so that the sum of the squares of the residuals can be minimized
(3e)
Fig. 1. Deflected range direction of a nonzero Doppler SAR image.
Equations (3a)–(3d) are four observation equations, and is the residual of each observation equation. The ma-trix [ ] denotes the coefficients of the partial derivatives of four linearized observation equations with respect to the three un-knowns of a ground point or the unknown matrix:
, which is the
incre-ment matrix of unknowns; , which is
the provisional values of unknowns; [ ], which is the matrix of the constant terms, and [ ], which is the weighting ma-trix. Each element of the coefficient matrix [ ] and [ ] in (3e) is illustrated in [4]. If zero-Doppler processed images are given, or 0, each linearly independent observa-tion may be treated as having the same weight, i.e.,
or 1 in (3e). The
provi-sional values [ ] of the unknown ground points are given by the scene center location and can be updated progressively using the incremental magnitudes [ ] derived from the least squares solution. The iterative updating process for the provi-sional values of the ground coordinates of each ground point will not go further if the criterion of a minimal increment mag-nitude, i.e., 1.0 10 m, has been met. Following the iterative procedures of the least squares adjustment of indirect observa-tions as shown in (3e), the position vector of a ground point can be derived [7]. If a SAR image and the header information give definite geometry for range pixels and for azimuth lines, then there remains only the problem with shifts of the image coordi-nates. Such shifts in range and azimuth time data can be simply corrected by two GCPs.
the overall shifts in three-dimensional (3-D) space and then the ground controls are collected, provided that the image geometry is well defined and the resultant range vector is perpendicular to the resultant velocity vector.
B. Formation of a Weighting Matrix
If the resultant velocity vector is not perpendicular to the re-sultant range vector, and since the axes of the azimuth and range components in the SAR image coordinate system remain or-thogonal, then the deflected range vector does not correspond to the nominal range vector (azimuth line) of that image. This is clearly shown in Fig. 1. The range direction deflected by an azimuth time error (converted to distance) produces a de-viation in along-track direction of the ground position in respect to the image coordinate system and gives
(4)
is the precision of prior estimation for observation. is the nominal zero Doppler frequency given by image header data (for a RADARSAT SAR standard image). is the deflected range magnitude, which is relatively large: about 880 000 m for a RADARSAT SAR image compared with the nominal along-track orbit error of 600 m.
Consider the difference between the range and the Doppler equations. Apparently, increases in proportion to the mag-nitude of . But the error is set as zero in the least squares solution, under the assumption of an orthogonal relationship between the azimuth line and range, which causes a relatively large residual for the Doppler equation. If the same weights were given to the Doppler and range equations in the least squares ad-justment, a small error of angle could be magnified to produce a significant residual in (3a) and (3c) under the circumstances of a relatively large range magnitude of spaceborne SAR images. A suitable weighting matrix is then considered to suppress such possible effects in the least squares adjustment.
The condition is that the effects from azimuth time error are expected to be minimal, since observations are made in respect to an orthogonal SAR image coordinate system. Let the preci-sion of the prior estimation for the observation of the left and the right image be and , respectively. Also, let the precision of the slant range observation of each orbit be approx-imately the same as . Generally, the weights of observations are taken to be quantities proportional to the reciprocals of the square of the precision (or the reciprocals of the variance) of the observations. The other elements of the weight matrix are all zero since linearly independent observations are assumed.
Hence, the weighting matrix [ ] of the normal equation in (3e) is derived as
(5)
The location of a ground point decides the magnitude of the resultant velocity vector . The velocity magnitude of a ground point is identical to that of the Earth rotation that changes according to the latitude of that ground point and gives
(6)
For example, if the resultant vector between sensor and ground velocity has achieved a maximal magnitude at low latitude, the elements of the weighting matrix are given as
(7)
Numerically, let 0.056 56 m, 5 m (one slant range pixel of the RADARSAT SAR standard image), the same sensor speed assumed for both orbits 7460 m/s, the Earth rotation speed at low latitude 400 m/s, and the along-track error as 600 m. The weighting matrix is derived as
test site or the speed of the sensor on different orbits makes insignificant effects on the weights.
Notice that the weights used in direct observations such as a “weighting average” may change the magnitude of the object explicitly and directly. But this is not the case of a least squares adjustment of indirect observations in which the weights are employed for achieving a balance of different qualities of ob-servations of different classes. Namely, the use of weights can potentially improve or optimize the precision of the calculated results under the condition of reducing the effects of the less reliable observations and emphasizing those of the good ones. So the reduction of the effects of one component (say azimuth line observations) must be paid by increasing the effects of the other component (say range pixel observations). If the qualities of observations of different classes are similar, there will be no significant improvement for the calculated results by means of using weighting techniques.
III. THEORETICALERRORMODELS
In terms of terrain mapping, either automatic correlation or manual measurement may introduce errors causing uncertain-ties in the results derived from a radargrammetric model. In order to demonstrate the robustness of the proposed method, it is useful to investigate the theoretical error generated by the pro-posed rigorous model for random observations. The theoretical error model for the measurements of range pixels is explained and shown in [7]. The error magnitude is decided by the in-tersecting angle of two range vectors and the measuring error of range pixel and is given by
(8)
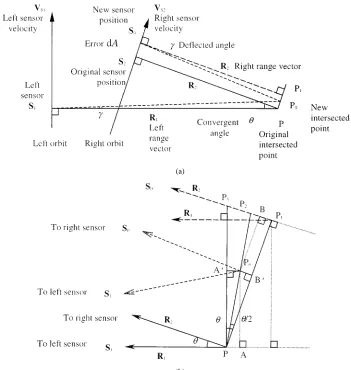
when a greater weight is given to the range observations. The error model for measurements of azimuth line must be revised because the assumption of good orbit data was made in [7], which is not always valid for every kind of spaceborne SAR data. Because the weight for the range observation is relatively large as shown in (5), the ground points are solved mainly using distance observations. The greatest concern in space intersec-tion is to find an intersecting point to satisfy a balance of range shifts between and , the range vector from right and left sensor, respectively, to the ground point, as shown in Fig. 2(a). If we assume that the same weight is assigned to the range equa-tion of each orbit, the deviaequa-tion of range distance for each orbit tends to be the same value in the least square adjustment. Again, the weight for the Doppler equation of each orbit is assumed to be the same. An intersecting point solved from space inter-section must satisfy two conditions, i.e., the same but relatively large weight for each range equation and the same but relatively small weight for each Doppler equation. The range direction of each orbit may swing slightly from one side to another and inter-sect at a point where the range distance and the deflected angle of range direction achieve a balance.
Notice that Fig. 2(b) is an enlargement of the right end of Fig. 2(a). In Fig. 2(a) an error in the sensor position causes a small error in the measurement of the azimuth lines. Change
of causes a shift in from to and that of from to , as shown Fig. 2(b), i.e.,
Let be the intersecting point. The deviation in from to , or to , must equal to that of from to , or to
, under the two conditions. Then
There are infinite points satisfying the criterion forming the track of the line from to . Obviously, such a line is a bi-sector of the convergent angle of two orbit tracks, as shown in Fig. 2(b). There is only one intersecting point making a balance between two Doppler equations, i.e., the deflected angle tends to be the same for each range direction as
(9)
and is the magnitude of and , respectively, and is the error vector of the measurement of azimuth line. The resultant error vector is derived as In general, both vec-tors and are approximately perpendicular to each other. Therefore, the magnitude of the resultant error vector for mea-surements of one azimuth line and one range pixel in an image is derived as
(11)
(10)
IV. TESTRESULTS
A. Procedures and Implementation
(a)
(b)
Fig. 2. (a) Swings of range directions in space intersection (top view of the two orbits) achieving a balance. Two range beams converge and intersect at the ground pointP . (b) Enlargement of the intersected location at the right part of Fig. 2(a).
TABLE I
THEORETICALERRORS FOROBSERVATIONS FROM APAIR OF RADARSAT SAR IMAGES
microwave length, ground-range-to-slant-range transformation parameters, the azimuth time of each azimuth line, etc. The ground points can be derived solving space intersection problem as described in Section II. All GCPs are treated as unknowns to be solved from measured image coordinates and are to be compared with the corresponding map coordinates to derive a difference between both coordinates that are used to correct
systematic shifts. The whole system has been implemented and tested on a SUN SPARC4 workstation within a local area network at UCL.
B. Theoretical Errors
Fig. 3. Spatial distribution of 32 check points, and of two GCPs.
to those of range observations, according to (8) and (9), and any possible effects from azimuth time error and the orthogonal re-lationship between the azimuth line and range can be reduced.
C. Tests with Check Points
To evaluate the performance of the algorithm for space in-tersection, 32 ground check points have been selected manu-ally from three images of descending passes provided under the RADARSAT Application Development and Research Opportu-nity (ADRO) Program (no. 136). The 32 points are distributed randomly within a 80 km 80 km area, as shown in Fig. 3. The test images are located on the Aix-Marseilles test site of south France as in Fig. 4. Table II shows the characteristics for the test images. Two descending standard beam-7 (DS7a and DS7b) SAR images are taken together with one of the descending stan-dard beam-1 (DS1) images, individually, to form two stereo-scopic pairs as case (1) and (2). The coordinates of the check points were calculated using the new methods with weights, and were compared with the coordinates measured from French 1 : 25 000 maps. The measuring errors of the ground coordinates are estimated as 1 mm in easting (E) or northing (N) on maps, or 25 m on the ground and 10 m in height (H), which leads to an error vector with error magnitude of 37 m in 3-D space. The results of weighted space intersection for the 32 check points, as shown in Table III, demonstrate that the systematic shifts can be eliminated using only two GCPs, and the resultant accuracy is good compared with the theoretical values.
In Table IV, the results calculated using an equal-weighted least squares adjustment show similar results to the weighted re-sult. This shows that in this case, any error in the zero-Doppler assumption has not caused significant error in the results, and it also shows a balanced distribution of errors between E, N, and H and also a smaller range of maximum (positive) and minimum (negative) errors. This is the expected result from a weighted least squares adjustment where observations of different quali-ties are balanced to give an optimum result as explained in Sec-tion II.
Fig. 4. Location of the Aix–Marseilles test site in south France (not to scale).
TABLE II
CHARACTERISTICS OF THETESTIMAGES FORSELECTINGCHECKPOINTS
TABLE III
ACCURACYSTATISTICS OFCHECKPOINTSFROMWEIGHTEDSPACE INTERSECTIONUSINGRADARSAT DATA WITH TWOGCPs
TABLE IV
ACCURACYSTATISTICS OFCHECKPOINTSFROM ANONWEIGHTEDSPACE INTERSECTIONUSINGRADARSAT DATA WITHTWOGCPs.
TABLE V
ACCURACYSTATISTICS OFGCPsANDARBITRARYGROUNDPOINTSDERIVED USING ATRADITIONALAPPROACH(QUOTEDFROM[13])
TABLE VI
ACCURACYSTATISTICS OF THERESULTANTDEMs USING THEWEIGHTED LEASTSQUARESALGORITHM WITH TWOGCPs
D. Generation of DEMs
Four images, including those from descending (DS1 DS7b) and ascending (AS1 AS7) orbits, as in Table II, have been tested to generate DEMs. A subscene image of 1024 1024 pixels was extracted from each whole scene covering the urban area of Marseille and the hilly area of Chaine de l’Etoile. The terrain relief within the subimage varies from 0 m to 639 m above mean sea level at Mountain St. Cyr. Each same-side image pair of the descending orbits and the ascending orbits forms a stereoscopic SAR image pair to be correlated together to produce parallax files containing more than 200 000 points [8]. The relative location of the generated DEM is shown in Fig. 3.
As mentioned before, no GCPs are used as input for space intersection. Two GCPs were used to correct systematic shifts caused from inferior orbit information after stereo intersection. The resultant DEMs were interpolated into a 25-m grid and compared with a reference DEM in the same area, giving the accuracy statistics as shown in Table VI. The root mean square errors (RMSEs) from statistics of each resultant DEM is better than 24 m, and this is reasonable compared to the predicted error of 28 m in 3-D. Note that such accuracy can be achieved using other methods, but a great number of good quality GCPs or tie points for those methods are needed. Due to the limitations of the automatic correlation method, layover effects, ambiguities of image features, and speckle, 100% coverage DEM can hardly be generated, and it is liable to produce some gaps in the results. The resultant DEM image has been shown in [8].
V. CONCLUSIONS
The results calculated from RADARSAT data, using the re-fined rigorous algorithm for space intersection with the use of a weighting matrix, reduces the errors in the azimuth line com-ponent. The use of the weighting matrix is not only essential in the theory of least squares adjustment (such as the treatments of different classes of observations), but also beneficial in prac-tice (the reduction of the extent of errors in azimuth direction). The paper demonstrates a flexible and rigorous radargrammetric algorithm, which enables users to deal with observations of dif-ferent classes (of difdif-ferent precision), i.e., the range and azimuth line observations, to optimize the calculated results. This goal
has been achieved, as shown in Tables III and IV. Also, the quality of the calculated results can be affected by many fac-tors, not only the weights given in the least squares solution, but the qualities of the GCPs used for systematic corrections and those of the check points employed for objective comparisons. Notice that the qualities of GCPs or check points that are mea-sured manually are subject to variations from one to another.
However, GCPs of relatively poor quality make the use of the traditional approach difficult and justify the use of the proposed algorithm. The absolute position of the solved ground points can be fixed by only two GCPs, which gives the accuracy of a generated DEM as 24 m. This keeps the cost of providing control at the lowest level without degrading the outcome. The results are comparable with the theoretical errors of up to 28 m, predicted by the proposed error model, and are superior to other methods in terms of efficiency and cost.
Based on the quality of the results derived, it is suggested that the main applications of DEMs generated from stereoscopic SAR data may include the geocoding of SAR images, terrain mapping at a small-scale, and numerous applications for envi-ronmental monitoring. When map revision or terrain mapping is difficult with optical data and IfSAR methods, and the requested accuracy in 3-D is not better than the resolution of a SAR image, stereo SAR is shown as being important as an alternative map-ping tool.
REFERENCES
[1] F. W. Leberl, Radargrammetric Image Processing. Norwood, MA: Artech House, 1990.
[2] F. W. Leberl, G. Domik, J. Raggam, and M. Korbick, “Radar stereo map-ping techniques and application to SIR-B images of Mt. Shasta,” IEEE
Trans. Geosci. Remote Sensing, vol. GE-24, pp. 473–481, July 1986.
[3] H. Toutin, “Opposite side ERS-1 SAR stereo mapping over rolling to-pography,” IEEE Trans. Geosci. Remote Sensing, vol. 34, pp. 543–549, Mar. 1996.
[4] C. Clark, “Geocoding and stereoscopy of synthetic aperture radar im-ages,” Ph.D. dissertation, Univ. London, London, U.K., 1991. [5] I. J. Dowman, “The geometry of SAR images for geocoding and stereo
application,” Int. J. Remote Sensing, vol. 13, no. 9, pp. 1609–1617, 1992. [6] I. J. Dowman, C. Clark, and M. Denos, “Three dimensional data from SAR images,” Int. Archives Photogramm. Remote Sensing Commission
IV, vol. 29, no. 4, pp. 425–427, 1992.
[7] P.-H. Chen and I. J. Dowman, “Space intersection from ERS-1 syn-thetic aperture radar images,” Photogramm. Record, vol. 15, no. 88, pp. 561–573, Oct. 1996.
[8] I. J. Dowman and P.-H. Chen, “A rigorous stereo method for DEM gen-eration from RADARSAT data,” in RADARSAT ADRO Symp., Montreal, QC, Canada, Oct. 1998, CD-ROM, File:/papers/adro136i.pdf. [9] G. P. Otto and T. K. W. Chau, “Region-growing algorithm for matching
of terrain images,” Image Vis. Comput., vol. 7, no. 2, pp. 83–94, 1989. [10] T. Day and J. P. Muller, “Digital elevation model production by
stereo-matching SPOT image-pairs: a comparison of algorithms,” Image Vis.
Comput., vol. 7, no. 2, pp. 95–101, 1989.
[11] M. Denos, “A pyramidal scheme for stereo matching SIR-B imagery,”
Int. J. Remote Sensing, vol. 13, no. 2, pp. 387–392, 1992.
[12] F. W. Leberl, K. Maurice, J. K. Thomas, and M. Millot, “Automatic radar image matching experiment,” Int. J. Photogramm. Remote Sensing, vol. 49, no. 3, pp. 19–34, 1994.
[13] K. Singh, O. K. Lim, L. K. Kwoh, and H. Lim, “An accuracy evalua-tion of DEM generated using RADARSAT stereo images,” in Proc. Int.
Geoscience and Remote Sensing Symp.’98, Seattle, WA, 1998.
[14] P.-H. Chen and I. J. Dowman, “SAR image geocoding using a stereo-sar dem and automatically generated GCPs,” Int. Archives Photogramm.
Remote Sensing, vol. 33B, pp. 38–45, 2000.
Pu-Huai Chen was born in Kaohsiung, Taiwan,
R.O.C., in 1965. He received the B.Sc. degree in surveying engineering from the Chung Cheng In-stitute of Technology (CCIT), Taiwan, in 1987, and the M.Sc. degree in photogrammetry and the Ph.D. degree from University College London (UCL), London, U.K., in 1993 and 2000, respectively
He was a Teaching Assistant from 1987 to 1992, and was appointed as a Lecturer in 1994 in the De-partment of Surveying Engineering, CCIT.
Ian J. Dowman received the B.Sc. and postgraduate
degrees in geography and photogrammetry, respec-tively, from University College London (UCL), London, U.K., in 1963 and 1964.
He worked in Australia for a number of years and then returned to a Lectureship in photogrammetry at UCL, where he was appointed Reader in Photogram-metry and Remote Sensing in 1983 and to a Chair in 1991. From 1997 to 1999, he was Dean of Engi-neering at UCL. He works in the area of digital map-ping using data from aerial and satellite borne sen-sors. He has developed methods for orientation and correction of SPOT data and SAR data, and his most recent work has been concerned with the automatic registration of different types of image data such as SPOT and SAR, to each other and to map reference data. He is also concerned with automatic extraction of features from image data.