International Journal of Research (IJR)
e-ISSN: 2348-6848, p- ISSN: 2348-795X Volume 2, Issue 09, September 2015Available at http://internationaljournalofresearch.org
Comparison of surface roughness at different
parameters cutting speed, depth of cut & feed rate by
using Taguchi Method
Deepak Sangwan# & Somvir Arya
* #M. Tech,4th sem student, I.I.E.T. Kinana.
*
Assistant Professor, Head of Mechanical Engg. Department,I.I.E.T. Kinana.
ABSTRACT
In the present research work gives the effect of different machining parameters (cutting speed, feed rate and depth of cut) on surface roughness in end milling is determined. Taguchi technique of optimization is used to select different parameter. The experimental work is carried out on hardened Die-Steel H-13. The processing of the job was done by solid carbide four flute end-mill tool under finishing conditions to calculate different variables and their levels. L-9 standard orthogonal array is used for calculation of number of variables and number of levels. Signal to Noise Ratio is used to calculate the significant parameter where as ANOVA F-Test is carried out to determine the percentage effect of each parameter.
Introduction
Automation and mass production are associated with advancement in technology. in the mass production units since the quantity of item required is very high with little or no variety special purpose machines, automatic machines or transfer lines have been used. On a CNC machine it is possible to make hundreds or even thousands of the same items in a day. Out of various machining processes, milling process has the advantage of multi-point cutting tool with high dimensional accuracy. the end milling is the most common metal removal operation encountered. In end milling the tool can cut the work-piece either horizontally or vertically. We are used three parameters (1) cutting speed (2) feed rate (3) depth of cut . and methodology adopted taguchi method the tool used in the Taguchi method is the orthogonal array (OA). The Taguchi method employs a generic signal-to-noise (S/N) ratio to quantify the present
variation. Hass surya vf 30 cnc vs milling machine is finalized to carry out the experimentation. The range and levels of various process parameters have been identified using Pilot Experimentation. The software used for analysis in this project is Minitab 15. results shows that the highest value of cutting speed, lower value of feed rate and higher value of depth of cut gives the better surface finish (lower surface roughness).
1.2 Milling Process
International Journal of Research (IJR)
e-ISSN: 2348-6848, p- ISSN: 2348-795X Volume 2, Issue 09, September 2015Available at http://internationaljournalofresearch.org
can cut the work-piece either horizontally or vertically. The processing of the job can be done by different types of end-mill tool under finishing conditions.
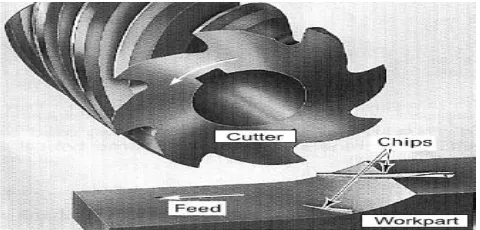
Milling is a process of producing flat and complex shapes with the use of multi-tooth cutting tool, which is called a milling cutter and the cutting edges are called teeth. The axis of rotation of the cutting tool is perpendicular to the direction of feed, either parallel or perpendicular to the machined surface. The machine tool that traditionally performs this operation is a milling machine.
Milling is an interrupted cutting operation. The teeth of the milling cutter enter and exit the work during each revolution. This interrupted cutting action subjects the teeth to a cycle of impact force and thermal shock on every rotation. The tool material and cutter geometry must be designed to withstand these conditions. Cutting fluids are essential for most milling operations.
Figure 1.1 Schematic Milling Operation
1.3.3 End Mill
The most common cutting tool used with a vertical milling is an end-mill, which looks like a stubby twist drill with a flattened end instead of a point. An end mill can cut into a work piece either vertically, like a drill, or horizontally using the side of the end mill to do the cutting. This horizontal cutting operation imposes heavy lateral forces on the tool and the mill, so both must be rigidly constructed. By making a series of horizontal cuts across the surface of a work piece, the end mill removes layers of metal at a depth than can be accurately controlled to about one-thousandth of an inch (.001").
Work Piece Material
Work piece Hot Die Steel H-13 is high hot strength, hardness and Good resistance to heat, good hot toughness, high resistance to temperature fatigue and wear in medium heat.
Chemical Composition of H-13
Chemical Composition C Si Mn Cr Mo V
Percentage (%)
International Journal of Research (IJR)
e-ISSN: 2348-6848, p- ISSN: 2348-795X Volume 2, Issue 09, September 2015Available at http://internationaljournalofresearch.org
Methodology Adopted-Taguchi Method
The Taguchi approach is a form of DOE with special application principles. For most experiments carried out in the industry, the difference between the DOE and Taguchi approach is in the method of application.Taguchi's method is an efficient and important optimization method based on orthogonal array concept which offers systematic and efficient process where the output depends on many factors (variables, inputs) without having tediously and uneconomically run of the process using all possible combinations of values or we can say. Thanks to systematically chosen certain combinations of variables it is possible to separate their individual effects .In Taguchi methodology, the desired design is finalized by selecting the best performance under given conditions. The tool used in the Taguchi method is the orthogonal array (OA). OA is the matrix of numbers arranged in columns and rows .The Taguchi method employs a generic signal-to-noise (S/N) ratio to quantify the present variation. These S/N ratios are meant to be used as measures of the effect of noise factors on performance characteristics. S/N ratios take into account both amount of variability in the response data and closeness of the average response to target.
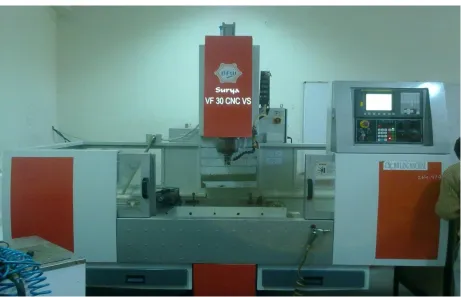
Selection of Machine
HAAS Surya VF 30 CNC VS milling machine is finalized to carry out the experimentation.
Fig. 3.2 SURYA VF30 CNC VS
Selection of Tool
International Journal of Research (IJR)
e-ISSN: 2348-6848, p- ISSN: 2348-795X Volume 2, Issue 09, September 2015Available at http://internationaljournalofresearch.org
Table 4.6 Raw Data for Surface Roughness
Ex. No. (A)
Cutting Speed
(B)
Feed Rate
(C)
Depth of cut
Surface roughness (Ra) at
Different location
Signal to noise ratio
(dbi)
Mean response value
Response
1
Response
2
Response
3
1 223.6 0.07 0.1 3.39 3.33 3.37 -10.5356 3.36
2 223.6 0.11 0.2 3.61 3.65 3.67 -11.2302 3.64
3 223.6 0.14 0.3 3.21 3.23 3.19 -10.1302 3.21
4 348.6 0.07 0.2 2.45 2.51 2.49 -7.9011 2.48
5 348.6 0.11 0.3 2.50 2.55 2.53 -8.0512 2.52
6 348.6 0.14 0.1 2.98 2.93 2.88 -9.3382 2.93
7 473.6 0.07 0.3 1.45 1.47 1.43 -3.2279 1.45
8 473.6 0.11 0.1 1.96 1.93 1.99 -5.0902 1.95
9 473.6 0.14 0.2 2.74 2.69 2.75 -8.7130 2.72
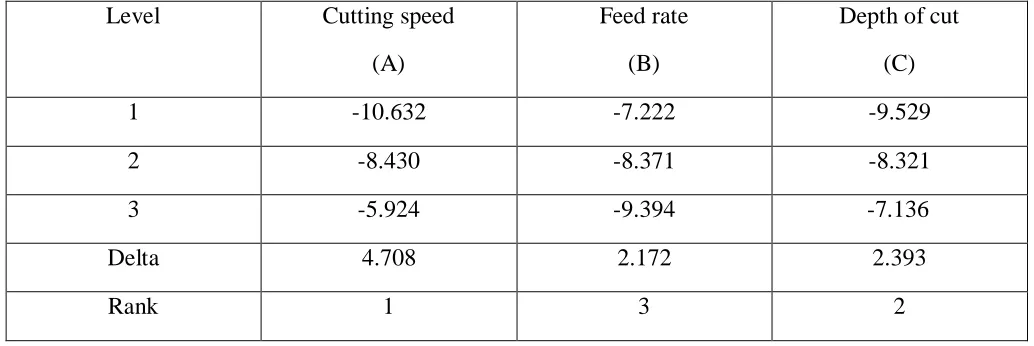
Table 4.7 Average Effect Response Table for Signal to Noise Ratios
Level Cutting speed
(A)
Feed rate
(B)
Depth of cut
(C)
1 -10.632 -7.222 -9.529
2 -8.430 -8.371 -8.321
3 -5.924 -9.394 -7.136
Delta 4.708 2.172 2.393
International Journal of Research (IJR)
e-ISSN: 2348-6848, p- ISSN: 2348-795X Volume 2, Issue 09, September 2015Available at http://internationaljournalofresearch.org
Table 4.9 Analysis of Variance for Signal to Noise Ratios
Source Degree of freedom
Sum of square Mean of square
F value P value
Cutting speed(A) 2 33.295 16.648 12.36 0.009
Feed rate (B) 2 5.086 2.822 2.10 0.003
Depth of cut (C) 2 7.144 3.572 2.65 0.037
Residual error 2 2.693 1.347
Total 8 50.219
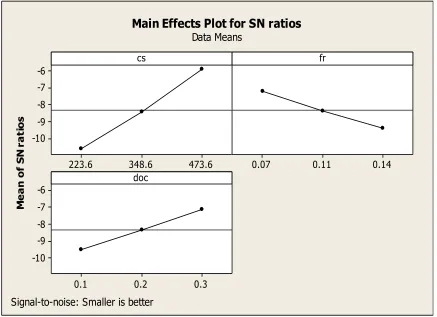
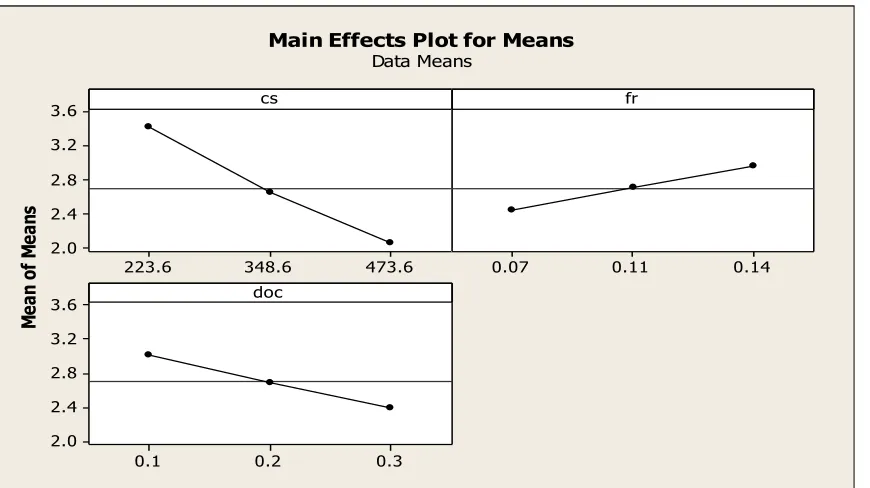
Figure 4.6 Main Effects Plot for Signal to Noise Ratios
473.6 348.6
223.6 -6
-7 -8 -9 -10
0.14 0.11
0.07
0.3 0.2
0.1 -6
-7 -8 -9 -10
cs
M
e
a
n
o
f
S
N
r
a
ti
o
s
fr
doc
Main Effects Plot for SN ratios Data Means
International Journal of Research (IJR)
e-ISSN: 2348-6848, p- ISSN: 2348-795X Volume 2, Issue 09, September 2015Available at http://internationaljournalofresearch.org
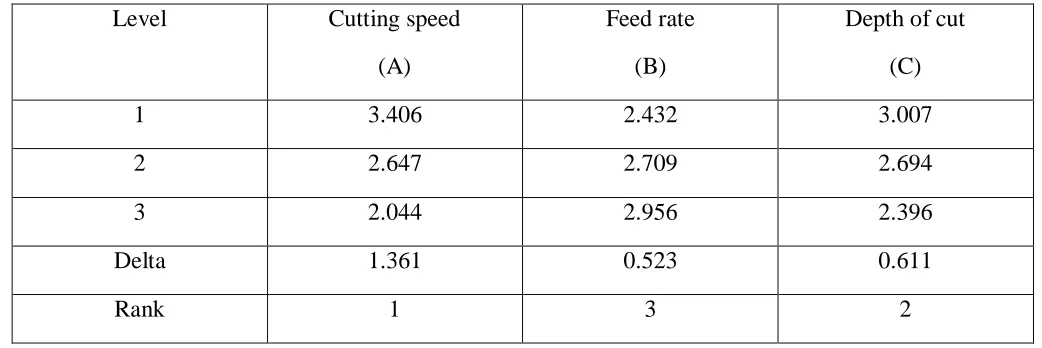
Table 4.8 Average Effect Response Table for Means
Level Cutting speed
(A)
Feed rate
(B)
Depth of cut
(C)
1 3.406 2.432 3.007
2 2.647 2.709 2.694
3 2.044 2.956 2.396
Delta 1.361 0.523 0.611
Rank 1 3 2
Table 4.10 Analysis of Variance for Means
Source Degree of freedom
Sum of square Mean of square
F value P value
Cutting speed(A) 2 2.7912 1.39560 17.43 0.042
Feed rate (B) 2 0.3240 0.16200 2.02 0.008
Depth of cut (C) 2 0.4730 0.23651 2.95 0.031
Residual error 2 0.1601 0.08007
International Journal of Research (IJR)
e-ISSN: 2348-6848, p- ISSN: 2348-795X Volume 2, Issue 09, September 2015Available at http://internationaljournalofresearch.org
473.6 348.6
223.6 3.6
3.2
2.8
2.4
2.0
0.14 0.11
0.07
0.3 0.2
0.1 3.6
3.2
2.8
2.4
2.0
cs
M
ea
n
of
M
ea
ns
fr
doc
Main Effects Plot for Means
Data Means
Figure 4.7 Main Effects Plot for Means
CONCLUSIONS
It has beenconcluded that:
1. In end milling, increase in cutting speed, decrease in feed rate and increase in depth of cut will decreases the surface roughness within specified test range.
2. In end milling, use of high cutting speed (473.6m/min.), low feed rate (0.07mm/tooth) and high depth of cut (0.3mm) are optimized parameters to obtained better surface finish for the specific test range in a H13 material.