An Application of the
Method to the Sampling
RALPH L. DIX”
Point-Centered Quarter
of Grassland Vegetation’
Biology Department, Marquette University, Milwaukee, Wisconsin
The point-centered quarter method, which belongs to a fam- ily of methods usually desig- nated as “distance measurement methods,” was developed by Cot- tam and Curtis (1956) for use in the sampling of tree and sapling compositions of woodlands in the northern Prairie-Forest Border Region. The method was first ap- plied to grassland studies by the author in western North Dakota during the summer of 1958 and it is presently in use in that area. This method offers a means of taking rapid, quantitative sam- ples of grassland vegetation which are free from subjective estimates and which yield data in terms of both species com- positions and species densities. Densities are in terms of aerial shoots per unit area; a shoot is defined as a stem plus its ap- pendages (Arber 1941; Foster 1949). The shoot has been se- lected as the organismal unit to avoid the necessity of distin- guishing individual plants in the field.
Three native grassland stands in western North Dakota were sampled in June and August of 1959 in order to evaluate the
1 This investigation was supported in part by funds made available by the National Science Foundation
(Grant No. G 5559).
2Present Address: Department of Plant Ecology. University of Sas- katchewan, Saskatoon, Saskatche- wan.
The author is indebted to Drs. Grant Cottam and W. C. Whitman for suggestions in the preparation of the manuscript.
characteristics and merits of the method when applied to grass- land vegetation and it is the pur- pose of this paper to report that study. The great diversity of grassland types suggests, how- ever, that the general applicabil- ity of the method should not be assumed until trials are made on a variety of other grassland types. This paper describes the method so that it may be tested by other workers on other grass- lands.
Distance measurement meth- ods are based upon the thesis that the measurement of the dis- tances between plants is a more efficient sampling tool in the field than area methods of direct density (plants or shoots per unit area) measurement. This would appear particularly true in grassland vegetation, where difficulty is often encountered in distinguishing individuals and where high densities often make the direct counting of individ- uals or shoots, even in small sample areas, impractical. Many distance measuring meth- ods have appeared since 1947 when Cottam introduced the random pairs method, the origi- nal member of this family. The works of Curtis (1950)) Skellam
(1952)) Cottam, Curtis and Hale (1953)) Clark and Evans (1954)) Hopkins (1954)) Moore (1954)) Morisita (1954), Cottam and Curtis (1956)) Greig-Smith
(1957) and Lindsay, Barton and Miles (1958) are of particular importance in tracing the devel- opment of this family of meth- ods.
The plant names used in this paper follow Stevens (1950).
63
All stands sampled in the pres- ent study were located in the South Unit of Theodore Roose- velt National Memorial Park, Billings County, North Dakota. The grassland vegetation of this area has been described by Han- son and Whitman (1938) and Dix (1958). The sampled stands had been ungrazed for at least 4 years and free from fire for 25 or more years.
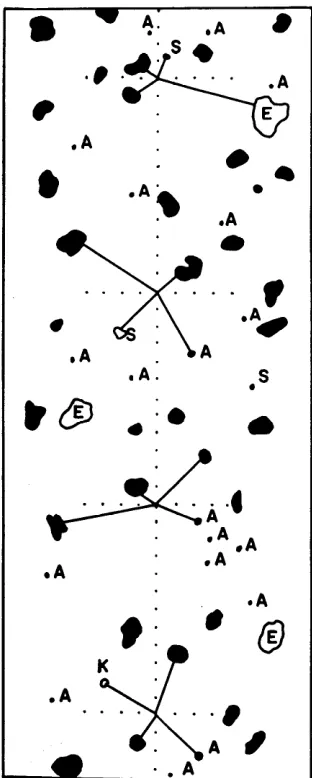
In applying the point-centered quarter method to grassland veg- etation, a technique developed by Evans and Love (1957) has been modified for use in locat- ing the central point of each sampling unit. A single pin (sur- veyor’s arrow) is placed verti- cally into the soil, guided by a small notch cut into the toe of the sampler’s boot. The area around the point is then divided into quarters by drawing two imaginary lines through the pin; one line is drawn parallel with the line of traverse while the second is drawn at right angles to the first (Figure 1). The es- tablishment of these lines is aided by filing four small marks on the pin in such a way that each mark is 90” from its near- est neighbor. Within each quar- ter of the sampling unit the clos- est living shoot to the point is recorded by species and the dis- tance from the point to the clos- est shoot is measured to the nearest centimeter. Thus, each sampling unit consists of four shoots and four measured dis- tances. The recording of field data is greatly facilitated by em- ploying a previously prepared data form (Figure 2).
64
.A.
.s
FICUHE 1. A hypothetical map of a grass- land area illustrating the application of the method. The vertical dotted line indi- cates the line of traverse. The intersection of the four solid lines indicates the loca- tion of the point of the sampling unit. The area around the point was divided into four 90” quarters by drawing a line (dot- ted horizontal line) at right angles to the line of traverse. The solid lines indicate measured distances from points to shoots. Four sampling units are illustrated and the data is recorded in Figure 2. “A”=
Agropyron smithii; “K” = Koeleria cris- tata; “E” = Eurotia lanata; “S” = Stipa viridula; solid black = Bouteloua gracilis.
Under this regime, a single woody plant may occasionally be measured two or more times when it appears in more than one quarter of a sampling unit. When a woody shoot overtops herbaceous shoots, only the for- mer is measured. When a shoot
DIX
touches the pin, a distance of zero is recorded.
The positions of the points in the field are determined objec- tively by pacing a predeter- mined number of steps along a compass line and placing the pin into the soil in the manner des- cribed above. The number of points required to adequately sample the vegetation is dis- cussed below.
All sampling in the present study was done by a two-man team-a sampler and a recorder. While this method may be eas- ily applied by an individual, a two-man team appears more ef- ficient since the time required to record distances usually limits the speed of the method.
Laboratory Calculations The homogeneity of each stand was tested by employing the method suggested by Curtis and McIntosh (1951). The number of shoots of the major species in each stand was segregated into four groups in which each segre- gate represented an approxi- mately equal area1 portion of the stand. Using the number of shoots contained in each of the four segregate groups, a Chi- square test for homogeneity
(Snedecor 1956) was applied. All Chi-square values for the stands used in this study were found to be within the expected 5 percent level and all stands were accepted as homogenous.
Cottam, Curtis and Hale (1953) have shown that, when the point-centered quarter
method is applied, the mean dis- tance between points and shoots is equal to the square root of the mean area, if individual species are disregarded. The mean dis- tance between shoots is found by summing the individual measured distances and dividing the sum by four times the num- ber of points used. Further, the mean distance squared is equal to the mean area while density is equal to the reciprocal of the mean area, or, to put density in terms of shoots per square meter, 10,000 (the number of sq. ems. in 1 sq. m.) over the mean dis- tance squared.
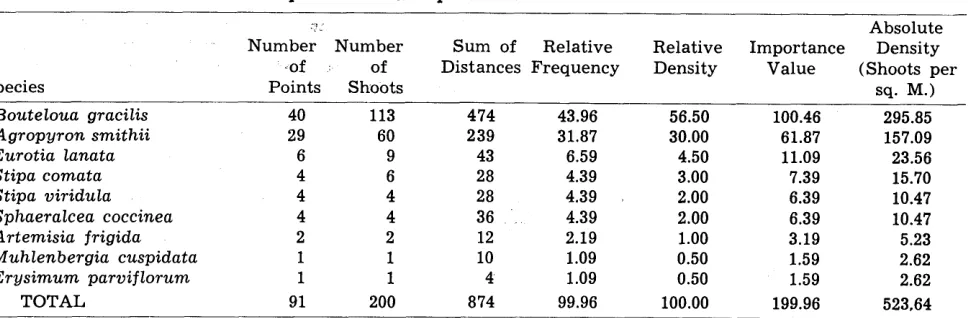
Table 1 may be used to demon- strate these calculations (p. 65).
In order to find the absolute densities for the individual spe- cies of the stand, the total den- sity is multiplied by the relative densities of the individual spe- cies. Again, from Table 1, the absolute density for blue grama (Bouteloua gracilis) is calculated to be 295.85 shoots per square meter (0.565 x 523.64).
The adequacy of the sampling was judged by employing the suggestion of Cottam and his colleagues (Cottam, et. al. 1953 and Cottam and Curtis 1956) that approximately 30 individu- als of a particular species must be encountered in the total sam- ple before reasonable accuracy is obtained for that species.
An importance value which is independent of distance meas- urements may also be obtained from data collected with this method. Relative frequencies and
FIGURE 2. Data form used to record field sampling. Four measurements are made in each sampling unit. Data are from Figure 1.
Marquette University Plant Ecology Form No. IO
dt + d- + d:< ____________________ dn 874
Mean Distance = - _ - = 4.37 ems.
4 x number of points used 4 x 50
Mean Area = mean distance’ = (4.37) ’ = 19.1 sq. ems. per shoot Total Density = l/19.1
or, to put the density in terms of shoots per square meter, 10,000
Total Density = ____ = 523.64 shoots per square meter. 19.1
densities may be calculated from the number of points of occur- rence (each point is considered a quadrat) and the number of shoots, respectively. The two relative values for each species are then added to give an im- portance value (Table 1) . While importance values calculated in this way may be of limited value in some grassland work, they may be highly desirable in cer- tain studies-e.g., in Savannah vegetation when it is desired to make use of some method which will permit direct comparisons between tree, shrub and herba- ceous synusia. When the point- centered quarter method is ap- plied to woodland vegetation, it is customary (Cottam and Cur- tis 1956) to calculate an impor- tance value which is the sum of the relative frequency, density and dominance values for each species. The importance values for trees will sum to 300 percent (relative frequency + relative density + relative dominance)
while the importance values for herb, shrub and sapling meas- urements will sum to 200 percent
(relative frequency -+ relative density). Whitford and Salamun (1954) have suggested that sap- ling data may be made directly comparable to tree data by mul- tiplying the importance value of each sapling species by 1.5 to bring the sum to the same 300 percent as the importance value for trees. The same method would appear applicable to herb and shrub data.
Resulfs
Stand A was first sampled on June 29 by employing 50 sam- pling units and the results of that sampling are given in Table 1. Of the nine species detected, only two proved adequately sam- pled. Further, it appeared that while a prohibitive number of sampling units would be re- quired to adequately sample the third ranked species, winter fat (Eurotia kmata), it suggested
that an adequate sample of the first and second ranked species might be obtained with fewer sampling units. A second sam- pling of the stand was therefore made (Table 2) by employing 25 units distributed over the same total area and this gave an ade- quate sample for blue grama but not for western wheatgrass (Ag- ropyron smithii). A third sam- pling of 25 units was made in the stand and again only blue grama proved to be adequately sam- pled. It was concluded from this study that 25 sampling units gave an adequate sample for the first ranked species in this grass- land type; that approximately 30-35 sampling units were re- quired to adequately determine the density of the recond ranked species; and that a very large number of sampling units would be required to adequately sam- ple the lesser ranked species.
In order to evaluate the influ- ence of seasonal differences upon data obtained with the point- centered quarter method, Stand A was sampled again on August 28, approximately two months after the first sampling, and the results are given in Table 3. Comparisons between Tables 1 and 3 show a striking similarity in the values for the first and second ranked species. The in- adequately sampled lesser spe- cies show large variations which are probably attributable to
Table 1. Species densities and importance values for Stand A. The stand was sampled on June 29, 1959 by em- ploying fifty sampling units (200 shoots). An asterisk has been placed before the adequately sampled species. The stand has a southwest exposure and a slope of Ilo.
Species
: 7 Absolute
Number Number Sum of Relative Relative Importance Density -of of Dist antes Frequency Density Value (Shoots per
Points Shoots sq. M.)
* Bouteloua gracilis 40 113 474 43.96 56.50 100.46 295.85
* Agropyron smithii 29 60 239 31.87 30.00 61.87 157.09
Eurotia lanata 6 9 43 6.59 4.50 11.09 23.56
Stipa comata 4 6 28 4.39 3.00 7.39 15.70
Stipa viridula 4 4 28 4.39 / 2.00 6.39 10.47
Sphaeralcea coccinea 4 4 36 4.39 2.00 6.39 10.47
Art emisia frigida 2 2 12 2.19 1.00 3.19 5.23
Muhlenbergia cuspidata 1 1 10 1.09 0.50 1.59 2.62
Erysimum parviflorum 1 1 4 1.09 0.50 1.59 2.62
66
DIX
Table 2. Species densifies and imporfance values for Sfand A on June 29, 1959 employing 25 sampling unifs. An asferisk has been placed before fhe adequafely sampled species.
Species
Absolute Number of Number of Importance Density Points Shoots Value (shoots per sq. M.)
* Bouteloua gracilis 21 59 104.28 323.67
Agropyron smithii 14 25 55.04 137.15
Eurotia lanata 4 6 14.57 32.92
Four other species 8 10 26.11 54.87
TOTAL 47 100 200.00 548.6 1
large sampling errors,
rather
than to differences in seasonal
variations.
Time trials in Stand A showed
the rate of sampling with the
point-centered quarter method
to be a consistent 50 sampling
units per hour in this vegetation
type.
For comparative purposes, stu-
sampling units. The very high
density of this species, the low
densities of the remaining spe-
cies, and the small amount of
mulch present, permitted sam-
pling to occur at the compara-
tively rapid rate of 67 sampling
units per hour.
The third site had a north-
northeast exposure and a slope
Table 3. Species densifies and imporfance values for Wand A on Augusf 29, 1959. Fiffy sampling units were employed in obfaining the sample. An asferisk has ben placed before fhe adequafely sampled species.
Species
Absolute Number of Number of Importance Density
Points Shoots Value (shoots
per sa. M.)
* Bouteloua gracilis 43 116 105.20 322.23
*Agropyron smithii 27 53 56.10 147.22
Stipa viridula 7 13 14.20 36.11
Eurotia lanata 5 6 8.50 16.67
Stipa comata 4 7 7.90 19.45
Five other species 5 5 8.00 13.90
TOTAL 91 200 199.90 555.58
dies were made on two addi-
tional grassland stands in west-
ern North Dakota. One stand
(B) was located contiguously
with Stand A but, due to its di-
rect southern exposure,
was
more xeric than the original
stand. When 50 sampling units
were used to sample Stand B,
blue grama was found (Table 4)
to have a density which was 42
percent higher than the density
for the same species in Stand A
while the total density for all
species was 28 percent higher in
the more xeric stand. Blue grama
accounted for 76 percent of the
vegetation in Stand A. In Stand
B, blue grama was the only spe-
cies adequately sampled with 50
of 18”. This stand (C) was less
xeric than either of the other
stands; it supported a greater
number of species and had a
thick mulch cover. When 50
sampling units were employed
on the stand only little bluestem
(Andropogon scoparius)
proved
to be adequately sampled. Fifty
additional sampling units were
distributed over the area and the
results pooled with the original
to form a single sample of 100
units (Table 4). This table shows
that a total of 32 species were
detected in the sampling and
that, of these, six were species
adequately sampled. The com-
paratively slow sampling rate of
37 units per hour ih this stand
was due to the necessity of re-
moving large quantities of mulch
before the exact locations of the
emergence of the shoots from
the soil could be determined. The
total density of plants in this
stand was approximately mid-
way between the total densities
for Stand A and B.
Some differences that may be
encountered in various grass-
land types within the same gen-
eral area are shown by compari-
sons between the three stands.
Stand B occurred on the most
xeric site of the study and this
condition was reflected in the
very high density for a single
species, blue grama, the low den-
sities of all other species and the
small amount of mulch on the
grassland floor. The least xeric
site was Stand C which showed
a high total number of species,
a comparatively large number of
important species (6)) the ab-
sence of a single species with a
density far higher than that for
the other species, and a thick
Table 4. Species densifies and imperfance -values for Stand B. Fifty sampling unifs were used in sampling fhe stand. An asferiak has been placed before fhe adequately sampled species. The sfand has southern exposure and a slope of 14”.
Species
* Bouteloua gracilis Eurotia lanata Agropyron smithii Plantago purshii Six other species
TOTAL
Absolute Number of Number of Importance Density Points Shoots Value (shoots per sq. M.)
47 152 137.84 513.51
13 29 31.60 97.97
6 8 11.89 27.03
4 5 7.76 16.89
6 6 10.86 20.28
Table 5. Species densities and importance valus for Stand C. The stand
was sampled by employing 100 sampling units. An asterisk has been placed before ihe adequately sampled species. The stand has a north norfheasi exposure and a slope of 18’.
Absolute Number of Number of Importance Density
Species Points Shoots Value (shoots
per sq. M.) __
* Andropogon scopurius 41 89 39.69 132.88
* Bouteloua curtipenduza 38 58 30.60 86.58
*Stipa viridula 30 46 24.22 68.66
*Bouteloua gracilis 21 43 19.67 64.16
*Carex jilijolia 22 31 17.34 46.24
*Muhlengergia cuspidata 19 35 16.81 53.22
Juniperus horizontalis 7 22 8.24 31.34
Stipa comata 7 9 4.96 11.95
Cares eleocharis 7 7 4.71 10.47
Calamovilja longijolia 4 8 3.70 11.95
Twenty-two other species 42 52 30.27 74.71
TOTAL 238 400 200.21 591.09
mulch mat. While Stand A was
intermediate between the other
two stands and showed inter-
mediate characteristics, it was
more closely related to Stand B
than to Stand C.
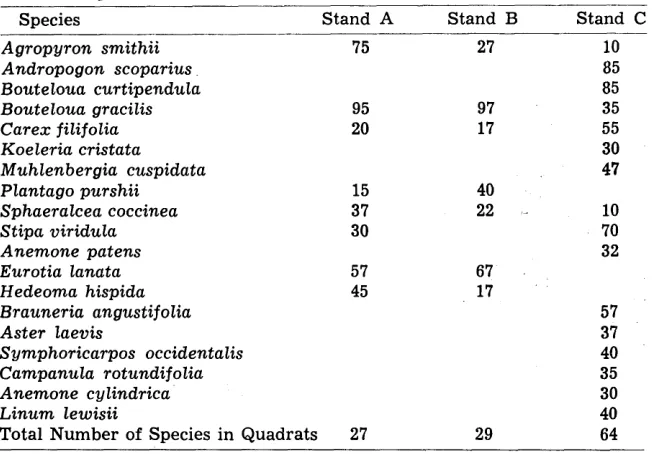
F r e q u e n c y determinations
were also made on the three
stands of the study by employ-
ing 40 l-M2 quadrats distributed
throughout each stand. The re-
sults for all species which had a
frequency index value of 30 per-
cent or more in any stand are
given in Table 6. Comparisons
between this table and Tables
1, 2, 3, 4, and 5 show a general
agreement in the relative impor-
tance of most species when sam-
pled with the two methods. The
point-centered quarter method
would appear, however, to be
more sensitive in distinguishing
between the relative importance
of species with near equal ranks.
For example, while the frequen-
cy index values for blue grama
shows the species to be nearly
as important in Stand A as in
S t a n d B, the point-centered
quarter method shows a 58 per-
cent higher density for the
species in Stand B. Again, in
Stand C little bluestem and side-
oats grama (Bouteloua curtipen-
dula) had the same frequency
values, but when the point-
centered quarter method was
used to sample the stand, the
former species had a density 65
percent greater than the latter
species. Frequency index deter-
minations made from area quad-
rats, however, appear to yield a
broad though general picture of
the species composition spectrum
and for this reason such deter-
minations are highly valuable in
establishing g r o s s similarities
and differences between stands.
Discussion
While the point-centered quar-
ter method is not historically a
descendant of the point quadrat
method, it nevertheless appears
to be a logical extension of that
method when, as in the present
study, it is applied to the sam-
pling of grassland vegetation.
The point quadrat method was
introduced by the Australian
ecologists Levy and Madden
(1933) and has as its theoretical
basis the principle that when the
sample area becomes a point, the
proportion of an infinitely large
total number of sampling areas
which are covered equals the
cover of the species (Greig-
Smith 1957). The point quadrat
method has been widely applied
in the sampling of grassland
vegetation throughout the world
and Brown (1954) suggests that
the method has every prospect
of becoming the accepted one in
both survey and detailed an-
alyses of grassland vegetation.
Of the several variations of the
point quadrat method which are
now in use, the most widely ap-
plied appears to be the point-
frame method in which 10 pins,
spaced 2 inches
apart, are
arranged in a frame in such a
way that they can be lowered
into the vegetation and the con-
tacts between the pins and shoots
recorded.
Goodall
(1952), in an ex-
haustive study of several varia-
Table 8. Frequency index values for ihe three stands of the study. Foriy l/4 -M2 quadrats were used fo sample each stand.
Species Stand A Stand B Stand C
Agropyron smithii 75 27 10
Andropogon scoparius 85
Bouteloua curtipendula 85
Bouteloua gracilis 95 97 35
Carex jilijolia 20 17 55
Koeleria cristata 30
Muhlenbergia cuspidata 47
Plantago purshii 15 40
Sphaeralcea coccinea 37 22 - 10
Stipa viridula 30 70
Anemone patens 32
Eurotia lanata 57 67
Hedeoma hispida 45 17
Brauneria angustijolia 57
Aster laevis 37
Symphoricarpos occidentalis 40
Campanula rotundijolia 35
Anemone c y lindrica 30
Linum lewisii 40
68 DIX
tions of the point quadrat method, concluded that: 1) a great economy in sampling time may be achieved by using a single pin as the sampling unit rather than a frame containing 10 pins; 2) when a single pin is used, the subconscious choice of placement ‘of the pin is much greater than with frames of 10 pins and special ‘care must be taken to avoid their subjective placement; 3) the diameter of the pins used in sampling may strongly affect the obtained es- timates of vegetal composition. . As applied in the present study,
the point-centered quarter meth- od appeared to take advantage of the first of Goodall’s conclu- sions while avoiding the possible undesirable features of the second and third. Since the di- ameter of the pin used in the sampling was small (3 mm.), and since the number of times which the pin was intercepted by vegetation low (8 percent or less), the diameter of the pin would appear to be relatively in- signif icant. Furthermore, since four s e p a r a t e measurements were made at each point (one to the closest shoot in each quarter) t h e possibility o f subjective selection of the distances to be measured was minimized. While it may be possible to subcon- sciously select a particular loca- tion for a point, the subjectivity concerned becomes greatly re- duced when four separate dis- tances are measured.
The present study shows that with the point-centered quarter method no a priori number of sampling units can be given as adequate to sample a given vege- tation type, nor can the time re- quired to make such a sample be given. It is suggested that when the point-centered quarter method is applied to grasslands, those species which are repre- sented by 30 or more shoots may be considered as adequately sam- pled unless positive evidence exists to the contrary. The occur- rence of 30 or more shoots in a
sample may be easily determined in the field and such an occur- rence may be accepted in the field as evidence that further sampling of that species is un- necessary.
No study was made in this work of the time requirements and efficiencies of s a m p 1 i n g methods other than the point- centered quarter method. It is not possible, therefore, to com- pare directly the time required to apply the point-centered quar- ter method with the time re- quirements of other commonly used grassland methods. How- ever, some general comparisons may be justified. Whitman and Siggeirsson (1954) , working in upland, native, ungrazed mixed- grass rangeland in western North Dakota, found that ap- proximately one full day was re- quired for a two-man team to sample the third-ranked species to an accuracy of 10 percent of the mean with the point-quadrat method while about four days were required to obtain the same accuracy with the line-intercept method. In comparison to these figures, the point-centered quar- ter method, as applied in the present study, yielded an ade- quate sample for six species in Stand C, vegetatively the most complex of the study areas, in approximately 2.6 hours of work for a two-man team. In Stand A, an adequate sample of the first ranked species was obtained in approximately 20 minutes, while one hour was required to sample the second ranked species. It would appear, there- fore, that the rapid working rate of the point-centered quarter method would recommend it as a valuable sampling tool.
The sampling efficiency of the point-centered quarter method may be greatly increased by applying the technique of multi- phase sampling (Yates 1953). This technique is of particular value when quantitative infor- mation is desired on a number of species which differ widely in
absolute densities. Under this regime, one or two species in a stand with apparently similar densities are selected for sam- pling in the first-phase and all remaining species are ignored. Thus, in Stand A, a survey of the stand would quickly establish blue grama and western wheat- grass as the most abundant species and they would be selec- ted for first-phase sampling; in each sampling unit the distances from the point to the closest shoot of either of these species would be measured in each quar- ter, all other species being ignored. When 30 or more of each of these species are detected in the sample, they would be presumed adequately sampled. A new estimate would then be made and the species which seem likely to rank third, fourth or fifth in abundance would be sampled to the exclusion of all others, including blue grama and western wheatgrass, in the second-phase sample. When 30 or more shoots of each of these species have been detected in the sample they would be considered adequately sampled and, if de- sirable, a third-phase sampling would be initiated. The multi- phase sampling technique may be continued to any level which appears practical for a particular study. The calculations for de- termining the absolute densities for the sampled species are made in the usual way (see PRO- CEDURES) but it is necessary to calculate the densities for each sample-phase separately. Overall species compositions ( i m p 0 r - tance values) cannot, of course, be determined when multi-phase sampling is employed.
One objection which may be advanced to the application of the point-centered quarter meth- od to grasslands is that the ob- tained density data are exactly true only for species which are randomly distributed. Anderson
is not always the case. Cottam
and Curtis (1956) have indicated
that, when populations are ag-
gregated, the densities obtained
with this method are below the
actual density values. At the
present time, no rapid, accurate
method for measuring a c t u a 1
densities of aggregated species
in grasslands has come to the at-
tention of the author and the
point-centered quarter method
appears to suffer less from this
shortcoming than do methods
now in use. The sampling bias
appears to be in only one direc-
tion and the added computa-
tional labor involved in deter-
mining actual densities does not
appear to justify more time con-
suming methods for most grass-
land studies. In discussing the
application of distance measure-
ment methods to studies of
pattern, Greig-Smith (1957) has
concluded that where it is im-
possible to distinguish individu-
als, as is clearly the case in
perennial grasslands, “it may be
impossible by these techniques
to analyse the distribution of all,
or even a majority, of species
present”.
The need met by the point-
centered quarter method as ap-
plied to grassland sampling is
that of offering a means of mak-
ing rapid, objective estimates of
the vegetation which are ex-
pressed in terms of both species
composition
(importance
values) and density. Since the
measured distances are relative-
ly small, minor differences in
vegetation are readily detected,
whether
the differences are
changes in time caused by live-
stock grazing, climatic shifts or
some similar factor or differ-
ences in space caused by slope,
exposure or edaphic dissimilari-
ties.
Summary
The point-centered q u a r t e r
method of sampling grassland
vegetation yields data in terms
of densities (shoots per unit
area) and relative species com-
positions. In applying the meth-
od, a point is objectively es-
tablished and the area around
the point is divided into four
quadrants. In each quadrant of
the sampling unit, the distance
to the closest living shoot is
measured in centimeters and the
snecies and the distance are re-
corded. Each sampling
unit
therefore consists of four meas-
ured distances to four shoots.
The densities of in divi du a 1
species are calculated from the
measured distances and an im-
portance value (relative frequen-
cy + relative density) which
is independent of the measured
distances is determined.
The method was tested on
three grassland
stands in
western
North Dakota. One
stand was sampled in June and
again in August and no signifi-
cant differences were found, in-
dicating that the method is not
sensitive to seasonal aspect. The
method appeared to be more
rapid than either the line inter-
cept or point frame methods and
is thought to be highly efficient
in detecting slight differences
between closely related stands
or vegetal changes in time with-
in a stand due to treatment or
climatic shifts.
LITERATURE CITED
ARBER, A. 1941. The interpretation of leaf and root in the angio- sperms. Biol. Rev. 16: 81-105. BROWN, D. 1954. Methods of sur-
veying and measuring vegetation. Bull. 42. Commonwealth Bur. of Pasture and Field Crops. Hurley, Berks., England. 223 pp.
CLARK, P. J. AND F. C. EVANS. 1954. Distance to nearest neighbor as a measure of spatial relationships in populations. Ecology 35: 445-453. COTTAM, G. 1947. A point method for
making rapid surveys of wood- lands. (Abstract) Bull. Ecol. Sot. Amer. 28: 60.
, AND J. T. CURTIS. 1956. The use of distance measures in phytosociological sampling. Ecol- ogy 37: 451-460.
--, , AND B. W.
HALE. 1953. Some sampling char- acteristics of a population of ran- domly dispersed individuals. Ecol- ogy 34: 741-757.
CURTIS, J. T. AND R. P. MCINTOSH. 1951. An upland forest continuum in the prairie-forest border region of Wisconsin. Ecology 32: 476-496. DIX, R. L. 1958. Some slope-plant
relationships in the grasslands of the Little Missouri Badlands of North Dakota. Jour. Range Mangt.
11(2):88-92.
EVANS, R. A. AND R. M. LOVE. 1957. The step-point method of sam- pling-A practical tool in range research. Jour. Range Mangt. 10
(5) : 208-212.
FOSTER, A. S. 1949. Practical Plant Anatomy. D. Van Nostrand Co. Inc., Publishers, New York. 228 pp. GOODALL, D. W. 1952. Some consid-
erations in the use of point quad- rats for analysis of vegetation. Aust. Jour. Sci. Res. 5: 1-41. GREIG-SMITH, P. 1957. Quantitative
Plant Ecology. Academic Press Inc., Publishers, New York. 198 pp. HANSON, H. C. AND W. WHITMAN.
1938. Characteristics of major grassland types in western North Dakota. Ecol. Monog. 8: 57-114. HOPKINS, B. 1954. A new method
for determining the type of dis- tribution of plant individuals. Ann. Bot., N. S. 18:213-227.
LEW, E. B. AND E. A. MADDEN. 1933. The point method of pasture anal- ysis. N. Z. Jour. Agr. 46: 267-279. LINDSEY, A. A., J. D. BARTON AND
S. R. MILES. 1958. Field efficien- cies of forest sampling methods. Ecology 39: 428-444.
MOORE, P. G. 1954. Spacing in plant populations. Ecology 35: 222-227. MORISITA, M. 1954. Estimation of
population density by spacing method. Mem .Fac. Sci. Kyushu Uni., Ser. E. 1: 187-197.
SKELLAM, J. G. 1952. Studies in sta- tistical ecology. I. Spatial pattern. Biometrika 39: 346-362.
STEIGER, T. L. 1930. Structure of prairie vegetation. Ecology 11: 170-217.
STEVENS, 0. A. 1950. Handbook of North Dakota plants. North Da- kota Institute for Regional Stu- dies, Fargo, N. D: 324 pp.
WHITFORD, P. B. AND P. J. SALAMUN. 1954. An upland forest survey of the Milwaukee Area. Ecology 35: 533-540.
WHITMAN, W. C., AND E. I. SIGCEIRS- SON. 1954. Comparison of line in- terception and point contact meth- ods in the analysis of mixed grass range vegetation. Ecology 35: 431- 436.