ISSN(Print) : 2320-3765 ISSN(Online):2278-8875
International Journal of Advanced Research in Electrical,
Electronics and Instrumentation Engineering
(An ISO 3297: 2007 Certified Organization)
Vol. 3, Issue 8, August 2014
Telugu Speech Enhancement In Terms Of
Objective Quality Measures Using
Discrete Wavelet Transform With Hybrid
Thresholding
V.Harika
1, A.SubbaRami Reddy
2, S.China Venkateswarlu
3 M.Tech Student, SKIT, Srikalahasti, Andhra Pradesh, India 1Principal, SKIT, Srikalahasti, Andhra Pradesh, India 2
Professor, Dept of ECE, J I T S, Karimnagar, Andhra Pradesh, India 3
ABSTRACT
:
This paper investigates the improvement of Telugu speech quality in terms of six objective quality measures using Discrete Wavelet Transform and proposes two Hybrid thresholding methods which are formed by combining soft and Improved thresholding methods with Modified Improved thresholding method. The performance of the new Hybrid methods is compared with the other thresholding methods. It is observed that the new proposed scheme yields better results when applied to Telugu noisy speech signals with low SNR (0dB) conditions. In this method, noisy speech signal is divided in to overlapping frames and each frame is windowed using hamming window. The windowed speech blocks are applied to the wavelet based speech enhancement algorithm and the enhanced speech is reconstructed in its time domain. For denoising the Telugu speech signal, various techniques like hard, soft, improved, modified improved and hybrid thresholding methods are used. Analysis is done using daubechies and symlets wavelets with different white Gaussian noise environments. Six Objective quality measures are considered in this study to test the performance of the algorithm for enhanced Telugu speech quality and compared. Hybrid thresholding methods perform better than hard, soft, improved and modified improved thresholding methods for wavelet based speech denoising.KEYWORDS
:
Speech
enhancement, objective quality measures, thresholding, discrete wavelet transform, hamming window.I. INTRODUCTION
Speech is the most primary human communication. For that reason, it exists a big trend to increase and improve telecommunications [1]. Now-a-days, all the people use the communication devices such as telephones, mobiles, internet etc., as a primary goal and the customers demand a high coverage and quality. But a speech signal is often degraded by additive background noise. Listening task is very difficult at the end user, in such noisy environment. Therefore, it is necessary to develop speech enhancement algorithms. Speech enhancement is the most important field of speech processing. Speech enhancement refers to methods aiming at recovering speech signal from a noisy observation. During the last decades, Many algorithms and various approaches have been proposed to the problem such as spectral subtraction [2], wavelet based methods [3], hidden Markov modelling [4] and signal subspace methods [5]to improve the perceptual quality of the speech signals from the corrupted input signal.
ISSN(Print) : 2320-3765 ISSN(Online):2278-8875
International Journal of Advanced Research in Electrical,
Electronics and Instrumentation Engineering
(An ISO 3297: 2007 Certified Organization)
Vol. 3, Issue 8, August 2014
to cross the 20,000 articles mark, and presently has the largest number of articles among all South Asian languages[6], [7].
Wavelets have been found to be a powerful tool for removing noise. The fundamental idea behind wavelets is to analyse the noise level separately at each wavelet scale [8]. Wavelet thresholding deals with wavelet coefficients using a preset threshold value. The wavelet coefficients are obtained by taking DWT of noisy speech signal. It is assumed that high amplitude coefficients are due to original signal and low amplitude coefficients are due to noise. Thresholding is that each wavelet coefficient is compared with the preset threshold value, if the coefficient is smaller than the threshold, then it is set to zero, otherwise it is kept or reduced in amplitude. Soft, Hard, Improved Modified Improved and the proposed Hybrid thresholding methods are used in the present work for de-noising the signals.
In this paper, to study the performance of the algorithm, objective quality measures and subjective quality measures have to be carried on. Subjective measures are based on comparison of original and processed speech data by a listener or a panel of listeners. They rank the quality of the speech according to a predetermined scale subjectively. But it is costly and time consuming. Hence, six objective measures such as SNR, segmental SNR, Frequency weighted segmental SNR, Log likelihood ratio, Weighted spectral slope distance, Cepstrum distance are chosen for performance evaluation test.
The paper is organised as follows: Part II explains the background for the Speech enhancement, In Part-III the Speech enhancement using wavelet transform and the proposed scheme of thresholding are explained, In Part-IV Speech Materials is presented; Part-V Applying DWT to Telugu Speech Samples, Part-VI describes the Objective quality measures, Part-VII presents the Simulation and Results and Part-VIII describes the Conclusion.
II. BACKGROUND
There are basically two domains of speech enhancement. First one is time domain approach and second one is transform domain approach. In time domain approach, filtering is performed directly on the time sequence. This includes techniques such as LPC based digital filtering, Hidden Markov Model (HMM), and Kalman filtering. In the transform domain techniques, signals are first transformed into a new domain and then noise attenuation is performed on the transformed coefficients. Such techniques are Fourier Transform (FT), Discrete Fourier Transform (DFT), Discrete Cosine Transform (DCT), Wavelet Transform (WT) etc. The time domain filtering of noise corrupted signal is simple method and finds advantage only when removing high frequency noise from low frequency signal. However they do not provide satisfactory results under real world conditions. Advantage of wavelet transform is that, wavelet analysis allows the use of long time intervals for low frequency information and shorter regions for high frequency information.
ISSN(Print) : 2320-3765 ISSN(Online):2278-8875
International Journal of Advanced Research in Electrical,
Electronics and Instrumentation Engineering
(An ISO 3297: 2007 Certified Organization)
Vol. 3, Issue 8, August 2014
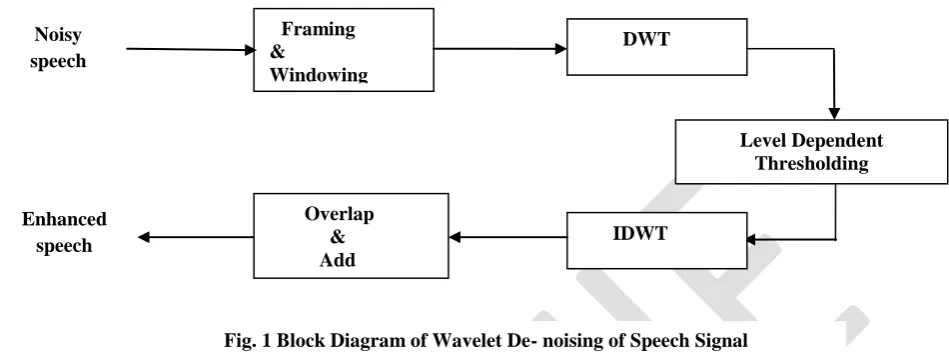
III. SPEECH ENHANCEMENT USING THE PROPOSED WAVELET THRESHOLDING Speech Enhancement using the proposed Hybrid thresholding scheme can be summarized below.
A. Noise Generation and Addition:
The Additive white Gaussian noise, which has zero mean and constant variance, is generated and added to the clean Telugu speech signal. The process of adding noise to the clean speech signal is expressed as:
x (n) = s (n) + g(n) , n=1,2,...N (1)
Where, s (n) is the clean speech signal, g (n) is the Gaussian noise,
x (n) is the Noisy speech signal.
B. Steps Involved:
The steps involved in wavelet based speech enhancement algorithm are as follows:
1) Segmentation
:
In speech processing, speech is non-stationary signal, where properties change rapidly over time. So it is impossible to calculate DWT. Because of this reason, the noisy speech signal is divided in to blocks of overlapping frames. The length of each frame is 256 samples. The overlap taken between two consecutive frames is from 50% to 75% .In this project, the overlap between frames is taken as 50%.That means, each frame is shifted from previous frame by 128 samples.
2) Windowing:
A window is defined as a function that has zero-valued outside of some chosen interval. To avoid the discontinuities between the frames, every frame is multiplied by a window function. Hamming window is used in this method. Hamming window is most commonly used for windowing of the speech signal It is a fixed length window, only window length controls the window‟s main lobe width or controls the performance of window function. Richard .W. hamming has proposed a hamming window. It is raised cosine window. Hamming window is defined as,
1
2
cos
46
.
0
54
.
0
)
(
n
n
n
w
,0
n
N
1
(2)Fig. 1 Block Diagram of Wavelet De- noising of Speech Signal Noisy
speech
Enhanced speech
DWT
Level Dependent Thresholding
Framing
&
Windowing
IDWT Overlap
ISSN(Print) : 2320-3765 ISSN(Online):2278-8875
International Journal of Advanced Research in Electrical,
Electronics and Instrumentation Engineering
(An ISO 3297: 2007 Certified Organization)
Vol. 3, Issue 8, August 2014
3) Discrete Wavelet Transform:
Discrete Wavelet Transform has become a powerful tool in a wide range of applications. Wavelet performs multi resolution analysis of a signal with localization in both time and frequency.Discrete wavelet transform produces non-redundant information due to orthonormal properties. To decompose and reconstruct the original speech signal, discrete Wavelet Transform (DWT) uses multi – resolution filter banks and wavelet filters. It provides sufficient information and reduces computation time for analysis and synthesis. There are different wavelet families like Haar, Daubechies, Coiflets, Symlet, Biorthogonal etc to analyse and synthesize a signal. The choice of wavelet determines the final waveform shape.For the present study Db4 and Db6 in Daubechies family and Sym5 and Sym7 in Symlet family have been selected for Speech Enhancement.
Given a mother wavelet
(
t
)
(which can be considered simply as a basis function ofL
2), the continuous wavelet transform (CWT) of a function x (t) (assuming that x
L
2) is given as:dt
t
x
a
b
t
a
b
a
X
(
,
)
1
(
)
(3)Where, „a‟ is the scale parameter corresponds to frequency information and „b‟ is the translation parameter corresponds to the time information in the transform. Discrete wavelet transform (DWT) is essentially a sampled version of CWT. Instead of working with (a, b)
R, the values of X (a, b) are calculated over a discrete grid:j j
k
b
a
2
,
.
2
j,k
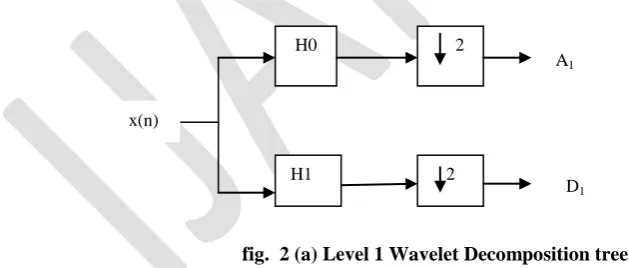
Z (4) 4) Wavelet FiltersThe time-frequency representation of DWT is performed by repeated filtering of the input signal with a pair of filters namely, low pass filter (LPF) and high pass filter (HPF), and its cut off frequency is the middle of input signal frequency. The coefficient corresponding to the low pass filter is called as Approximation Coefficients (Aj) and
similarly, high pass filtered coefficients are called as Detailed Coefficients (Dj) is shown in fig.2. Furthermore, the Aj is
consequently divided into new approximation and detailed coefficients. The decomposition process can be iterated, with successive approximations being decomposed in turn, so that one signal is broken down into many lower resolution components. This is called the wavelet decomposition tree. The wavelet decomposition of the signal is analyzed at level j has the following structure [Aj, Dj... D1]. Looking at a signal wavelet decomposition tree in fig.2 (a) can reveal valuable information. Since the analysis process is iterative, in theory it can be continued indefinitely. In reality, the decomposition can only proceed until the vector consists of a single sample. Normally, however there is little or no advantage gained in decomposing a signal beyond a certain level. In this work the composition is limited to only 2-level.
H0= low-pass decomposition filter; H 1= high-pass decomposition filter,
= Down-sampling operation. A1 is the approximated coefficient of the clean signal at level 1. D1 is the detailed
coefficient at level 1.
2
fig. 2 (a) Level 1 Wavelet Decomposition tree
H0 2
2 H1
D1
A1
ISSN(Print) : 2320-3765 ISSN(Online):2278-8875
International Journal of Advanced Research in Electrical,
Electronics and Instrumentation Engineering
(An ISO 3297: 2007 Certified Organization)
Vol. 3, Issue 8, August 2014
5) Thresholding:
Wavelet thresholding is the signal estimation technique that exploits the capabilities of signal denoising. Performance of thresholding is purely depends on the type of thresholding method and thresholding rule used for the given application.Apply thresholding to the detailed coefficients rather than to the approximation coefficients, because the detailed coefficients contain important components of the signal. As a result, the estimated wavelet coefficients are obtained. In this paper, the additive white Gaussian noise that is added to the clean speech signal is removed by using the concept of Multi resolution. Threshold value is needed to remove the noise from the noisy signal. If the threshold value is too high, the content of original signal may get cut off and if threshold is too low, noise may not be removed properly.
Donoho and Jonstone [8, 10] proposed a time-constant threshold value for removing additive white Gaussian noise in the signal. The present work is based on level dependent threshold in which the detailed wavelet coefficients are modified according to the threshold value calculated based on the variance of the detailed coefficients of the Wavelet in each level. The threshold is mathematically expressed as:
𝑇 = 𝜎𝑗 2log(𝑁) (5)
Where, N denotes the number of samples of noisy speech signal and σi is the standard deviation of noise in level j and is given by
𝜎𝑗 = 𝑀𝑒𝑑𝑖𝑎𝑛(𝐷𝑗)/0.6745 (6)
Here Dj is the set of detailed coefficients at j
th
level and dj is an element in it. The Hard, Soft, Improved, Modified
Improved [11] and the proposed Hybrid Thresholding method which is a formulated by combining modified improved thresholding with soft and Improved thresholding methods are used in this study.
A. Hard Thresholding: In Hard Thresholding, all Wavelet‟s detail coefficients whose absolute values are less than the threshold are set to be zero and other wavelet‟s detail coefficients are kept. It is defined as,
𝑇𝐻 =
𝑑𝑗 𝑖𝑓 𝑑𝑗 ≥ 𝑇 0 𝑖𝑓 𝑑𝑗 < 𝑇
(7)
B. Soft Thresholding: Soft thresholding is an expanded version of hard thresholidng. It sets all wavelet‟s detail coefficients to zero whose absolute values are less than the threshold same as hard thresholding and shrinks the non-zero coefficients towards zero. It is defined as,
𝑇𝑆=
𝑆𝑖𝑔𝑛(𝑑𝑗 ) 𝑑𝑗 − 𝑇 𝑖𝑓 𝑑𝑗 ≥ 𝑇
0 𝑖𝑓 𝑑𝑗 < 𝑇 (8)
C. 𝑰𝒎𝒑𝒓𝒐𝒗𝒆𝒅 𝑻𝒉𝒓𝒆𝒔𝒉𝒐𝒍𝒅𝒊𝒏𝒈: 𝐼𝑚𝑝𝑟𝑜𝑣𝑒𝑑 𝑡𝑟𝑒𝑠𝑜𝑙𝑑𝑖𝑛𝑔 𝑖𝑠 𝑎𝑡𝑡𝑒𝑚𝑝𝑡𝑒𝑑 𝑡𝑜 𝑎𝑑𝑑𝑟𝑒𝑠𝑠 𝑡𝑒 𝑑𝑒𝑓𝑖𝑐𝑖𝑒𝑛𝑐𝑦 𝑜𝑓 𝑎𝑟𝑑 𝑎𝑛𝑑 𝑠𝑜𝑓𝑡
thresholding denoising methods.
𝑇𝐼=
𝑆𝑖𝑔𝑛(𝑑𝑗 ) 𝑑𝑗 − 𝑇𝛽(𝑇− 𝑑𝑗 ) 𝑖𝑓 𝑑𝑗 ≥ 𝑇
0 𝑖𝑓 𝑑𝑗 < 𝑇
(9)
ISSN(Print) : 2320-3765 ISSN(Online):2278-8875
International Journal of Advanced Research in Electrical,
Electronics and Instrumentation Engineering
(An ISO 3297: 2007 Certified Organization)
Vol. 3, Issue 8, August 2014
𝑇𝑀𝐼=
𝑑𝑗 = 𝑑𝑗 𝑖𝑓 𝑑𝑗 ≥ 𝑇
𝑆𝑖𝑔𝑛(𝑑𝑗 )
𝑇(𝑒𝛾
𝑑𝑗 𝑇 −1)
(𝑒𝛾−1) 𝑖𝑓 𝑑𝑗 < 𝑇
(10)
In this function, one important factor is γ and for this work γ =3 is used in order to have better performance [11].
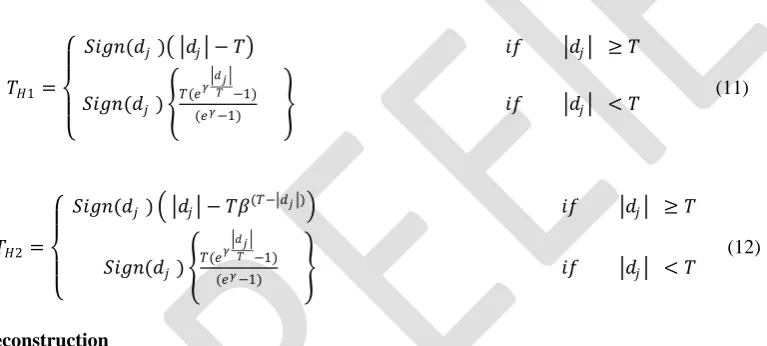
E. Hybrid Thresholding: In this method the authors are proposed two new thresholding schemes by combining with modified improved thresholding scheme with soft thresholding and modified improved thresholding with improved thresholding and are defined in EQ.11 and EQ.12 given below.
𝑇𝐻1=
𝑆𝑖𝑔𝑛(𝑑𝑗 ) 𝑑𝑗 − 𝑇 𝑖𝑓 𝑑𝑗 ≥ 𝑇
𝑆𝑖𝑔𝑛(𝑑𝑗 )
𝑇(𝑒𝛾
𝑑𝑗 𝑇 −1)
(𝑒𝛾−1) 𝑖𝑓 𝑑𝑗 < 𝑇
(11)
𝑇𝐻2=
𝑆𝑖𝑔𝑛(𝑑𝑗 ) 𝑑𝑗 − 𝑇𝛽(𝑇− 𝑑𝑗 ) 𝑖𝑓 𝑑𝑗 ≥ 𝑇
𝑆𝑖𝑔𝑛(𝑑𝑗 )
𝑇(𝑒𝛾
𝑑𝑗 𝑇 −1)
(𝑒𝛾−1) 𝑖𝑓 𝑑𝑗 < 𝑇
(12)
(6). Signal Reconstruction
The original signal can be reconstructed or synthesized using the inverse discrete wavelet transform (IDWT). The synthesis starts with the approximation and detail coefficients Aj and Dj, and then reconstructs by up sampling and filtering with the reconstruction filters. The reconstruction filters are designed in such a way to cancel out the effects of aliasing introduced in the wavelet decomposition phase. The reconstruction filters together with the low and high pass decomposition filters, forms a system known as quadrature mirror filters (QMF). For a multilevel analysis, the reconstruction process can itself be iterated producing successive approximations at finer resolutions and finally synthesizing the original signal as shown in fig. 2(b).
H0= low-pass decomposition filter; H1 = high-pass decomposition filter,
= Up-sampling operation. C1 is the approximated coefficient of the original signal at level 1. D1 is the detailed
coefficient at level 1.
All the above steps can be put in to the following denoising algorithm.
I. Initially, decompose the input signal frame using DWT: Choose a wavelet and determine the decomposition level of a wavelet transform L, then implement Layers wavelet decomposition of signal x (n).
2
Fig. 2 (b) Level 1 Wavelet Reconstruction tree
x(n)
H1 2
D1
2
2
H0 C1
ISSN(Print) : 2320-3765 ISSN(Online):2278-8875
International Journal of Advanced Research in Electrical,
Electronics and Instrumentation Engineering
(An ISO 3297: 2007 Certified Organization)
Vol. 3, Issue 8, August 2014
II. Select the thresholding method for quantization of wavelet coefficients. Apply the thresholding on each level of wavelet decomposition and this thresholding value adjusts the wavelet coefficients based on the threshold value.
III. Finally, the denoised signals reconstructed without affecting any features of signal interest. The reconstruction was done by performing the Inverse Discrete Wavelet Transform (IDWT) of various wavelet coefficients for each decomposition level.
7). Overlap Add method: In this method, the denoised short time signals are added together to get an enhanced speech signal.
IV. SPEECHMATERIALS
The aim of this section is to acquire the speech samples. The experimental part consists of recording each of the well known Telugu Speech proverbs at a normal speaking rate three times in a quiet room by three male and three female native Telugu speakers (age around 23 years) at a sampling rate of 48 kHz and 16 bit value. These digitized speech sounds are then down sampled to 8 kHz and then normalized for the purpose of analysis. The Gaussian white noise is added to the speech signal in four particular SNRs: (15 dB, 10 dB, 5 dB, 0 dB). DWT is used to obtain the Enhanced Speech Signal from noisy Speech Signal. The so produced pairs of reference and Enhanced Signals are used for evaluating the objective measures of speech quality.
V. APPLYING DWTTOTELUGU SPEECHSAMPLES
A suitable criterion used by [8] for selecting optimal wavelets, is the energy retained in the first N/2 (where N=Total no. of data points in a frame) coefficients. Based on this criterion alone, the Daubechies4 (db4), Daubechies6 (db6), Symlet5 (Sym5) and Symlet7 (Sym7)wavelets were chosen for analysis. Choosing the right decomposition level in the DWT is important for many reasons. For processing speech signals no advantage is gained in going beyond scale 5. At higher levels, the approximation data is not as significant and hence does a poor job in approximating the input signal [12]. However, in this work the speech signal frame is decomposed to scale 2 as most of the Speech denoising procedures based on Wavelet Transform use only up to level 2 or level 3 for Speech signal denoising. The multi-level decomposition implements the analysis-synthesis process which breaks up a signal x(n), to obtain the wavelet coefficients (A1, D1 etc.), and reassembling the signal from the coefficients[13], [14]. The wavelet coefficients are modified according to the threshold criteria using EQ.5-EQ.12 before performing the reconstruction step.Fig.2 shows the process of decomposing and reconstructing the signal waveforms using high pass and low pass filters. The procedure for Telugu Speech denoising using Wavelet Transform was summarized in fig.1
VI. OBJECTIVEQUALITYMEASURES
The performance of the enhanced signal is analysed through Six objective speech quality measures described here.
1. Signal -to –Noise Ratio: The Signal-to-Noise Ratio (SNR) is the ratio of signal energy to noise energy and it is given [15-19] as,
22
)
(
ˆ
)
(
)
(
log
10
n
s
n
s
n
s
SNR
(13)Where s(n) is the clean signal and 𝑠 (n) is the enhanced speech signal and N is the frame length.
ISSN(Print) : 2320-3765 ISSN(Online):2278-8875
International Journal of Advanced Research in Electrical,
Electronics and Instrumentation Engineering
(An ISO 3297: 2007 Certified Organization)
Vol. 3, Issue 8, August 2014
1 2
0 1 0 2 1 0 10
)
(
ˆ
)
(
(
log
10
1
N n N n M m dbmN
n
s
mN
n
s
mN
n
s
M
segSNR
(14)Where s(n) is the clean signal and 𝑠 (n) is the enhanced speech signal , N is the frame length. M represents the number of frames.
3. Weighted Spectral Slope Distance: WSS distance measure computes the weighted difference between the spectral slopes in each frequency band. The spectral slope is obtained as the difference between adjacent spectral magnitudes in decibels. The WSS measure is defined and evaluated [17] as
1 0 1 2 1)
,
(
)
.
(
)
,
(
)
,
(
1
M m k j k j p cm
j
w
m
j
s
m
j
s
m
j
w
M
WSS
(15)Where W(j, m) are the weights computed. Sc(j, m) and Sp(j, m) are the spectral slopes for jth frequency Band at mth frame of clean and processed speech signals respectively.
4.Log Likelihood Ratio: The LLR measure is based on dissimilarity between the all pole models of the original and enhanced speech and it is given [18] as,
T s S s T p S pa
R
a
a
R
a
LLR
log
10 (16)Where ap and as are the LP coefficient vectors for the clean and enhanced speech segments, respectively. Rs denote the
autocorrelation matrix of the clean speech segment.
5. Cepstum Distance: It gives an estimate of the log spectral distance between two spectra. It is defined as [15-19]
21
)
,
(
)
,
(
)
(
N k ps
k
m
c
k
m
c
m
CD
(17)Where Cs(n) and Cp(n) represent the cepstrum of clean and the enhanced speech respectively. Cs(k,m)=Re[IDFT{log|𝐷𝐹𝑇(𝑠(𝑘,𝑚)|}] (15)
The cepstrum coefficients can also be obtained recursively from the LPC coefficients using the following expression [9-10]
k m m
k
m
c
k
a
m
k
a
m
c
(
)
)
(
1 1for
1
m
p
(16)
ISSN(Print) : 2320-3765 ISSN(Online):2278-8875
International Journal of Advanced Research in Electrical,
Electronics and Instrumentation Engineering
(An ISO 3297: 2007 Certified Organization)
Vol. 3, Issue 8, August 2014
1 0 1 1 2 2 10)
,
(
)
,
(
ˆ
)
,
(
)
,
(
log
)
.
(
10
M m k j k jm
j
w
m
j
s
m
j
s
m
j
s
m
j
w
M
f wSNRseg
(18)where W (j, m) is the noise-dependent weight applied on the jth frequency band, K is the number of bands, M is the total number of frames in the signal, s(j, m) is the weighted clean signal spectrum in the jth frequency band at the mth frame, and𝑠 (j, m) in the weighted enhanced signal spectrum in the same band.
VII. SIMULATION&RESULTS
The Telugu Speech Signals from the authors‟ database are being used for processing using Discrete Wavelet Transform denoising algorithms and the obtained denoised signals called Enhanced Speech Signals are used for analysis. Performance of the Enhanced Signal is analyzed by using six objective measures for enhanced speech quality. The processing algorithm and the ones used to give objective estimate of the obtained quality are performed in Matlab. The measures are WSS, LLR, fwseg-SNR, Cep, Seg-SNR, and SNR defined in EQ.13-EQ.18. All the measures are computed by segmenting the Telugu Speech sentences of 32-ms duration using Hamming window with 50% overlap between adjacent frames. A tenth order LPC analysis was used in the computation of LPC- based objective measure LLR. The performance of the Algorithm is studied under Additive Gaussian noise conditions at 0dB, 5dB, 10dB and 15dB SNR levels and presented in Table.1 (a)-1(f). Five Telugu clean speech sentences written in English alphabets spoken by both male and female speakers have been taken from speech corpus developed by the authors are given below and are used for the present work.
1. AA RO GYA ME MA HA BHA GYA MU 2. AA LA SYA M AMRU TAM VI SHAM 3. IM TI KA NNA GU DI PA DI LAM
4. THA LLI DAM DRU LA KU MIM CHI NA POO JYU LU LE RU 5. VU LLI CHE SI NA ME LU THA LLI CHE YA LE DU
Gaussian white noise with known SNR is added to these clean speech signals to get noisy signal. The noisy speech signal is decomposed in to wavelet coefficients at a decomposition level of 2. In this de-noising algorithm, Daubechies wavelets (db4, db6) and symlet wavelets (sym5, sym7) are used for denoising. Soft, Hard, Improved, Modified Improved and the proposed Hybrid thresholding methods are applied to the wavelet coefficients to achieve the Enhanced Speech Signal. The performance of enhanced speech in terms of objective measures is presented in Tables1.(a)-1.(f).
ISSN(Print) : 2320-3765 ISSN(Online):2278-8875
International Journal of Advanced Research in Electrical,
Electronics and Instrumentation Engineering
(An ISO 3297: 2007 Certified Organization)
Vol. 3, Issue 8, August 2014
VIII. CONCLUSION
In this paper, a comparative study of Hard, Soft, Improved, Modified Improved and the proposed Hybrid Thresholding methods using Daubechies and Symlet wavelet families have been made to Enhance Telugu speech signals. This study gives the choice of Threshold function to use Wavelet denoising for Telugu Speech. The effects on the five Telugu Proverbs have been examined. The values of the extracted parameters are also presented. From the results, Db4 and Sym5perform better than other wavelets selected for this study. The Proposed algorithm will be tested with the Real noises like Babble, Car, and Airport etc. as part of their future work.
ACKNOWLEDGEMENTS:
The work is carried out through the research facility at the Department of Electronics & Communication Engineering Srikalahasteeswara Institute of Technology (SKIT), Srikalahasti, Chittoor District, Andhra Pradesh, as part of M.Tech Thesis Work. The Authors also would like to thank the authorities of SKIT for encouraging this research work. Our thanks are also to the experts who have contributed towards development of this paper.
REFERENCES
[1] A.M.Kandoz, “Digitalspeech”, 2nd edition, Willey, 2002
[2] S Boll, Suppression of acoustic noise in speech using spectral subtraction, IEEE Tans Acoust., Speech, Signal Processing, vol ASSP-27, pp 113-120, April 1979.
[3] B. Jaishankarand K. Duraiswamy, “Audio Denoising using Wavelet Transform”, International Journal of Advances in Engineering and Technology, ISSN: 2231-1963, 2012.
[4] H. Sameti, H. Sheikhzadeh, Li Deng, R. L. Brennan, “HMM-Based Strategies for Enhancement of Speech Signals Embedded in Nonstationary Noise”, IEEE Transactions on Speech and Audio Processing, Vol. 6, No. 5,September 1998.
[5] M. Klein and P. Kabal, “Signal subspace speech enhancement with perceptual postfiltering”, Proc. IEEE Int. Conf. Acoustics, Speech, Signal Processing, Orlando, FL, pp. I- 537-I-540, May 2002.
[6] http://en.wikipedia.org/wiki/Telugu_language [7] https://telugubasha.net/en/history#general
[8] David L. Donoho, “De-noising by Soft Thresholding”, IEEE Transactions on Information Theory, vol. 41, No. 3, 1995.
[9] I. Agbinya, “Discrete Wavelet Transform Techniques in Speech Processing”, IEEE Tencon Digital Signal Processing Applications Proceedings, IEEE, New York, NY, 1996, pp 514-519.
[10] Su, L. & Zhao, G.. De-noising of ECG Signal Using Translation-invariant Wavelet Denoising Method with Improved Thresholding.
Proceedings of IEEE-EMBS 2005 27th Annual International Conference of the Engineering in Medicine and Biology Society, pp. 5946-5949, ISBN 0-7803-8741-4, Shanghai, China, January 17-18, 2006
[11] Y. Ghanbari , M. Karami,” A Modified Speech Enhancement System Based on the Thresholding of the Wavelet Packets”, 13th ICEE-2005, Vol. 3, Zanjan, Iran, May 10-12, 2005.
[12] ShahinaHaque, Tomio Takara, “Optimal Wavelet for Bangla Vowel Synthesis”, International Journal of Scientific & Engineering Research Volume 2, Issue 11, PP 1-6, ISSN 2229-5518, November-2011.
[13] Gilbert Strang, and TroungNgugen, “Wavelets and Filter Banks”, Wellesley-Cambridge Press, ISBN 0-9614088-7-1.
[14] Stephane G. Mallat, “A Theoy for Multi-resolution signal decomposition – The Wavelet Representation ”, IEEE transactions on Pattern Analysis and Machine Intelligence, vol. 11, No. 7, July 1989.
[15] Y.Hu &P.Loizou, “Evaluation of objective measures for speech enhancement”.IEEE Trans. Audio speech Lang. process, Vol .16. No.1, pp.229- 238, Jan-2008
[16] P. C. Loizou, Speech Enhancement: Theory and Practice, 1st ed. CRC, 2007.goon Phinyomark, ChusakLimsakul, PornchaiPhukpattaranont, ECTI Transactions on Electrical Eng., Electronics and Communications, vol. 8, No. 1, February 2010.
[17] D. Klatt, “Prediction of perceived phonetic distance from critical band spectra,” in Proc. IEEE Int. Conf. Acoust., Speech, Signal Process., vol. 7, pp. 1278–1281,1982.
[18] Quackenbush,T.Barnwell,M.Clements,“objective measures of speech quality”,Engle wood Cliffs, NJ: Printice Hall, 1988.
ISSN(Print) : 2320-3765 ISSN(Online):2278-8875
International Journal of Advanced Research in Electrical,
Electronics and Instrumentation Engineering
(An ISO 3297: 2007 Certified Organization)
Vol. 3, Issue 8, August 2014
TABLE.1 (a)
SPEECH QUALITY EVALUATION WITH DIFFERENT THRESHOLDS IN TERMS OF SIGNAL TO NOISE RATIO (SNR) FOR SPEECH CORRUPTED BY
WHITE GAUSSIAN NOISE AT VARIOUS INPUT SNRs
Wavelet family
Input SNR dB
SEGSNR Measure Using Different Threshold Methods
TH TS TI TMI TH1 TH2
Db4
0 -3.958 -4.674 -4.118 -2.757 -2.672 -2.421 5 -2.335 -3.323 -2.558 0.011 -0.715 -0.228 10 -0.674 -2.244 -1.244 2.833 1.293 2.125
15 0.832 -1.267 0.022 5.317 2.978 3.908
Db6
0 -3.987 -4.575 -3.950 -2.757 -2.937 -2.446 5 -2.091 -3.196 -2.355 0.070 -0.447 0.356 10 -0.541 -2.106 -1.024 3.015 1.649 2.507
15 0.954 -1.087 0.292 5.607 2.975 4.204
Sym5
0 -4.224 -4.915 -4.243 -2.830 -2.810 -2.417 5 -2.281 -3.485 -2.626 -0.072 -0.591 0.162 10 -0.881 -2.506 -1.589 2.879 1.530 2.352 15 0.614 -1.563 -0.259 5.375 3.206 3.989
Sym7
0 -3.993 -4.636 -4.098 -2.697 -2.957 -2.516 5 -2.188 -3.264 -2.452 0.166 -0.529 0.261 10 -0.635 -0.959 -1.074 3.109 1.479 2.465
15 0.778 -1.280 0.277 5.669 2.866 4.122
Wavelet family
Input SNR dB
SNR Measure Using Different Threshold Methods
TH TS TI TMI TH1 TH2
Db4
0 2.0225 0.980 1.958 1.896 2.069 2.441
5 5.156 3.468 4.666 5.925 4.795 5.528
10 7.576 4.898 6.283 9.731 7.168 8.331
15 8.816 5.505 6.937 12.528 8.516 9.798
Db6
0 1.895 1.156 2.196 1.887 1.743 2.415
5 5.409 3.749 4.957 5.973 5.132 6.195
10 7.819 5.205 6.580 9.859 7.587 8.774
15 9.163 5.846 7.276 12.801 8.471 10.102
Sym5
0 1.670 0.578 1.748 1.808 2.008 2.518
5 5.134 3.209 4.518 5.817 5.055 6.062
10 7.383 4.536 6.028 9.778 7.490 8.637
15 8.741 5.188 6.750 12.60 8.770 9.873
Sym7
0 1.895 1.031 1.957 1.964 1.746 2.348
5 5.361 3.630 4.855 6.094 4.909 6.018
10 7.763 5.047 6.595 10.024 7.319 8.687
15 9.112 5.678 7.340 12.926 8.469 10.073
TABLE.1 (b)
SPEECH QUALITY EVALUATION WITH DIFFERENT THRESHOLDS IN TERMS OF SEGMENTAL SIGNAL TO NOISE RATIO (SEGSNR) FOR SPEECH CORRUPTED BY WHITE
ISSN(Print) : 2320-3765 ISSN(Online):2278-8875
International Journal of Advanced Research in Electrical,
Electronics and Instrumentation Engineering
(An ISO 3297: 2007 Certified Organization)
Vol. 3, Issue 8, August 2014
TABLE.1 (d)
SPEECH QUALITY EVALUATION WITH DIFFERENT THRESHOLDS IN TERMS OF LOG LIKELIHOOD RATIO (LLR) FOR SPEECH CORRUPTED BY
WHITE GAUSSIAN NOISE AT VARIOUS INPUT SNRs TABLE.1 (c)
SPEECH QUALITY EVALUATION WITH DIFFERENT THRESHOLDS IN TERMS OF
FREQUENCY WEIGHTED SEGMENTAL SIGNAL TO NOISE RATIO (FWSEG) FOR SPEECH CORRUPTED BY WHITE GAUSSIAN NOISE AT VARIOUS INPUT SNRs
Wavelet family
Input SNR dB
FWSEG Measure Using Different Threshold Methods
TH TS TI TMI TH1 TH2
Db4
0 7.111 6.164 6.702 5.978 6.209 6.270
5 8.586 6.976 7.570 8.085 7.854 8.189
10 10.269 7.688 8.298 10.992 9.398 9.957 15 11.887 8.361 8.964 14.090 10.559 11.237
Db6
0 7.170 6.233 6.818 5.930 6.241 6.277
5 8.699 6.987 7.629 8.104 7.923 8.246
10 10.399 7.633 8.271 11.060 9.445 10.012 15 12.010 8.318 8.934 14.172 10.580 11.259
Sym5
0 7.152 6.176 6.776 5.921 6.147 6.204
5 8.640 6.968 7.577 8.089 7.851 8.193
10 10.342 7.646 8.253 11.064 9.472 10.012 15 11.870 8.247 8.897 14.161 10.560 11.228
Sym7
0 7.108 6.335 6.833 5.936 6.219 6.274
5 8.632 7.061 7.670 8.114 7.880 8.242
10 10.387 7.689 8.353 11.065 9.419 9.997 15 12.011 7.746 9.034 14.199 10.564 11.265
Wavelet family
Input SNR dB
LLR Measure Using Different Threshold Methods
TH TS TI TMI TH1 TH2
Db4
0 0.336 0.031 0.059 0.396 0.192 0.224
5 0.277 0.024 0.038 0.275 0.129 0.142
10 0.232 0.017 0.024 0.190 0.085 0.091
15 0.187 0.011 0.014 0.131 0.056 0.058
Db6
0 0.358 0.035 0.064 0.408 0.193 0.226
5 0.296 0.027 0.040 0.280 0.128 0.142
10 0.245 0.018 0.025 0.192 0.082 0.087
15 0.376 0.011 0.014 0.133 0.054 0.056
Sym5
0 0.349 0.032 0.061 0.402 0.191 0.224
5 0.287 0.025 0.038 0.277 0.127 0.141
10 0.236 0.018 0.114 0.191 0.084 0.090
15 0.189 0.011 0.091 0.133 0.056 0.058
Sym7
0 0.367 0.038 0.068 0.412 0.191 0.226
5 0.303 0.028 0.043 0.285 0.125 0.140
10 0.250 0.020 0.027 0.198 0.081 0.087
ISSN(Print) : 2320-3765 ISSN(Online):2278-8875
International Journal of Advanced Research in Electrical,
Electronics and Instrumentation Engineering
(An ISO 3297: 2007 Certified Organization)
Vol. 3, Issue 8, August 2014
TABLE.1 (e)
SPEECH QUALITY EVALUATION WITH DIFFERENT THRESHOLDS IN TERMS OF WEIGHTED SPECTRAL SLOPE (WSS) FOR SPEECH CORRUPTED BY
WHITE GAUSSIAN NOISE AT VARIOUS INPUT SNRs
TABLE.1 (f)
SPEECH QUALITY EVALUATION WITH DIFFERENT THRESHOLDS IN TERMS OF CEPSTRUM DISTANCE (CEP) FOR SPEECH CORRUPTED BY
WHITE GAUSSIAN NOISE AT VARIOUS INPUT SNRs Wavelet
family
Input SNR dB
WSS Measure Using Different Threshold Methods
TH TS TI TMI TH1 TH2
Db4
0 53.528 56.136 55.301 57.256 58.591 58.078 5 43.088 46.144 45.368 41.474 43.076 42.601 10 35.203 38.729 37.987 28.425 30.903 30.360 15 28.915 32.904 32.216 19.292 22.381 21.829
Db6
0 52.887 55.529 54.900 56.981 58.142 57.807 5 42.673 45.276 44.667 41.273 42.512 42.089 10 34.428 37.290 36.750 28.376 30.219 29.778 15 28.199 31.112 30.670 19.186 21.440 20.951
Sym5
0 52.802 55.533 55.015 57.067 58.886 58.360 5 42.443 45.430 44.791 41.334 43.030 42.597 10 34.668 37.867 37.233 28.637 30.467 30.025 15 28.403 31.888 31.317 19.452 22.181 21.720
Sym7
0 52.820 55.570 54.956 56.900 58.469 58.062 5 42.594 45.081 44.611 41.259 42.461 42.060 10 34.363 37.070 36.643 28.476 29.974 29.633 15 28.044 30.746 30.350 19.316 21.401 21.027
Wavelet family
Input SNR dB
CEP Measure Using Different Threshold Methods
TH TS TI TMI TH1 TH2
Db4
0 2.101 2.368 2.255 2.575 2.727 2.671
5 1.747 1.932 1.837 2.129 2.301 2.246
10 1.415 1.565 1.483 1.712 1.841 1.787
15 1.100 1.225 1.156 1.418 1.512 1.478
Db6
0 2.106 2.347 2.224 2.558 2.759 2.666
5 1.728 1.915 1.813 2.110 2.267 2.170
10 1.418 1.594 1.477 1.697 1.814 1.753
15 1.101 1.211 1.142 1.391 1.501 1.441
Sym5
0 2.139 2.399 2.270 2.584 2.733 2.658
5 1.747 1.948 1.849 2.141 2.275 2.194
10 1.438 1.589 1.507 1.714 1.822 1.770
15 1.116 1.242 1.173 1.417 1.495 1.460
Sym7
0 2.099 2.354 2.246 2.554 2.765 2.675
5 1.728 1.926 1.830 2.104 2.288 2.197
10 1.428 1.573 1.481 1.692 1.832 1.763
ISSN(Print) : 2320-3765 ISSN(Online):2278-8875
International Journal of Advanced Research in Electrical,
Electronics and Instrumentation Engineering
(An ISO 3297: 2007 Certified Organization)
Vol. 3, Issue 8, August 2014
BIOGRAPHY
V.Harika received her B.Tech degree in Electronics and Communication Engineering from Gokula Krishna college of engineering, Sullerpeta, Andhra Pradesh, India and pursuing her M.Tech. degree in Digital Electronics and Communication Systems from Srikalahasteeswara Institute of Technology (SKIT), Srikalahasti, Andhra Pradesh, India.. Her research interest includes Digital Signal Processing, Image Processing and Wavelets.
Dr. A. Subbarami Reddy born in Anjimedu, a nearby village of Tirupati, Andhra Pradesh, India in 1958. He obtained his M.Sc Physics (Electronics) from S.V University, Tirupati, India. He earned his AMIE from the Institution of Engineers (India), Kolkata, India, M.Tech from now NIT, Kurukshetra, India and PhD degree from Andhra University, Waltair, India all in Electronics and Communication Engineering. He worked as Laboratory Assistant, Associate Lecturer, Lecturer, Assistant Professor, Associate Professor, Professor, Sr.Professor and Head of the Department and Dean in different Engineering colleges of Andhra Pradesh, India. Presently he is the Principal of Srikalahasteeswara Institute of Technology (SKIT), Srikalahasti, Andhra Pradesh, India. Dr. A. Subbarami Reddy is having more than 32 years of experience and published more than 35 papers in referred International and National Journals. He is a life member of ISTE (India), Fellow of IETE. His areas of interest include Signal Processing and its Sub fields.