ABSTRACT
KIM, SANGWOOK. Stresses at Electrode-Electrolyte Interface in Lithium-ion Batteries via Multiphysics Modeling. (Under the direction of Dr. Hsiao-Ying Shadow Huang.)
Since carbon dioxide from petroleum-derived fuels has become an environmental issue, the need for alternative energy sources increases dramatically. One of the most promising energy solutions is the use of lithium-ion batteries as an energy storage system. They exhibit a few favorable characteristics, such as their low cost, high thermal stability, high electrochemical performance, and high specific capacity. However, lithium-ion batteries show capacity loss and impedance rise on the surface of cathode particles during charging and discharging in several conditions. It has been suggested that high current-rates (C-rates) during discharging play an important role in the mechanical and structural deterioration of lithium-insertion materials, thereby progressively reducing the capacity of lithium-ion batteries with each charge and discharge cycle (referred to as “rate-capacity fade”). Yet our basic knowledge of how electrode material mechanical stress states contribute to the battery performance and stability is currently extremely limited, hindering materials innovation and the ability to use lithium-ion batteries as energy storage systems.
Our results provide a better understanding of mechanical stresses on the interface between the electrode and the electrolyte in lithium-ion batteries in several conditions. We explore (i) the impact of the porosity of electrode-electrolyte interface, (ii) the impact of porous electrodes in a lithium-ion half-cell, and (iii) the impact of phase transformation in porous electrodes. Specifically, we study effects of C-rate, volume fraction (porosity), viscosity, and lithiation stage during a half-cell system discharging. Moreover, our
simulations demonstrate that both electrode and electrolyte material properties have greater effects when investigating mechanical stresses on the electrode-electrolyte interface. These computational models would aid on mitigating higher stresses in cathode particles to ensure longer battery cycle life.
© Copyright 2015 by Sangwook Kim All Rights Reserved
Stresses at Electrode-Electrolyte Interface in Lithium-ion Batteries via Multiphysics Modeling
by Sangwook Kim
A thesis submitted to the Graduate Faculty of North Carolina State University
in partial fulfillment of the requirements for the Degree of
Master of Science
Mechanical Engineering
Raleigh, North Carolina 2015
APPROVED BY:
__________________________________ _________________________________ Dr. Hsiao-Ying Shadow Huang Dr. Brendan T. O’Connor
Committee Chair
ii
DEDICATION
To my parents, Soon-tae and Il-ran Kim, and My sister, Yeaeun Kim
Nothing would be possible without your support.
BIOGRAPHY
Sangwook Kim was born in Busan, South Korea, on January 3rd, 1990. He
matriculated at Pusan National University (Busan, Korea) in 2008. He served two years from 2010 at Korea Army. After that, he received his Bachelor of Science degree in Mechanical Engineering from PNU in 2014. He decided to study abroad to expand his academic and develop global leadership. In 2014, he enrolled in graduate school at North Carolina State University (Raleigh, NC) for pursuing his Master of Science degree in Mechanical
iv
ACKNOWLEDGEMENTS
First of all, I would like to thank North Carolina State University and Department of Mechanical & Aerospace Engineering for giving me this opportunity to pursue Master of Science degree in the U.S.
Secondly, I would like to thank my advisor, Dr. Hsiao-Ying Shadow Huang for continued guidance and encouragement.
I also would like to thank my committee members, Dr. Brendan T. O’Conner and Dr. Alexei V. Saveliev for being willing to serve in my committee and providing me invaluable advice.
TABLE OF CONTENTS
TABLE OF CONTENTS ... v
LIST OF TABLES ... vii
LIST OF FIGURES ... viii
CHAPTER 1: INTRODUCTION ... 1
1.1 Lithium-Ion Battery ...1
1.2 Promising LiFePO4 Electrode ...4
1.3 Research at National Laboratory ...6
1.3.1 Sandia National Laboratory ... 6
1.3.2 Brookhaven National Laboratory ... 9
1.4 Current State-of-Art and Limitation...11
1.5 Objectives of this Study ...13
CHAPTER 2: LITERATURE REVIEW ... 15
2.1 LiFePO4 as a Cathode material...15
2.2 Electrolyte ...24
2.3 Solid-Electrolyte Interphase (SEI) ...29
2.4 Phase Transformation across Electrode ...32
2.5 Diffusion-Induced Stress ...37
CHAPTER 3: MODEL DEVELOPMENT ... 43
3.1 The Impact of the Porosity of Electrode-Electrolyte Interface ...47
3.2 The Impact of Porous Electrodes in a Lithium Ion Half- Cell ...51
3.3 The Impact of Phase Transformation in Porous Electrodes ...54
CHAPTER 4: SIMULATION RESULTS AND DISCUSSION ... 58
4.1 Stress Analysis of the Porosity of Electrode-Electrolyte Interface ...58
4.1.1 Effect of C-rate ... 59
4.1.2 Effect of Porosity ... 60
4.1.3 Effect of Viscosity ... 62
vi
4.2 Multiphysics Models for Stress Analysis of Porous Electrodes ...68
4.2.1 Effect of C-rate ... 69
4.2.2 Effect of Volume Fraction ... 70
4.2.3 Effect of Viscosity ... 74
4.2.4 Conclusion ... 75
4.3 Phase Transformation Effect in Porous Electrodes via Multiphysics Modeling ....77
4.3.1 Lithiation ... 77
4.3.2 Effect of C-rate ... 80
4.3.3 Effect of Volume Fraction ... 86
4.3.4 Conclusion ... 91
CHAPTER 5: SUMMARY AND CONCLUSIONS ... 92
5.1 Future Work ...95
REFERENCES ... 96
APPENDIX ... 105
Appendix A: Material Property and Supplementary Information
...106A1: Electrode Material Property Change during Discharging ... 106
A2: Material Property of Electrolyte ... 107
A3: Supplementary Information on Model 1 ... 108
A3: Supplementary Information on Model 2 ... 113
LIST OF TABLES
viii
LIST OF FIGURES
Chapter 1
Figure 1: Comparison of the different battery technologies in terms of gravimetric(x-axis), and volumetric(y-axis) energy density [2]... 2 Figure 2: Working mechanism of lithium-ion batteries during discharging [3]. ... 3 Figure 3: Comparison of various cathode materials; LiCoO2, LiMn2O4, LiNiO2, and
LiFePO4 [1]. ... 5
Figure 4: SOC mapping obtained via scanning transmission X-ray microscopy (a) 26µm, (b) 18µm, and (c) 6µm from the current collector [6]. ... 7 Figure 5: (a) The number of particles in terms of particle size, and (b) the fraction of delithiated particles plotted as a function of percentile of particle size (lithium-rich particles are in color red and lithium-poor particles are in color green) [6]... 8 Figure 6: Schematic illustration for multi-particle LiFePO4 system [7]. ... 10
Chapter 2
Figure 7: Comparison of the discharge capacity of various LiFePO4 electrodes at 25 °C
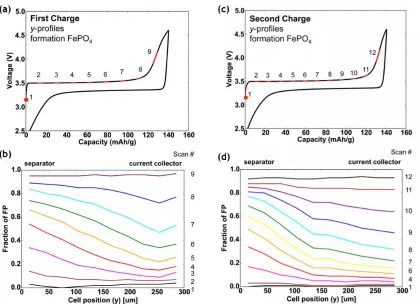
[17]. ... 16 Figure 8: Simulation snapshots of 50% SOC electrodes discharged at different C-rates [20]. ... 17 Figure 9: The voltage as a function of the capacity at (a) the first cycle, and (b) the second cycle. The phase fraction of FePO4 during charging as a function of the cell
position (y) at (c) the first cycle, and (d) the second cycle in C/7 [18]. ... 18 Figure 10: Discharge capacity versus cycle number for various LiFePO4 electrodes in
0.2 C-rate [18]. ... 20 Figure 11: Normalized 7Li MAS NMR spectra of (a) carbon coated LiFePO4, and (b)
pure LiFePO4 at 25 ºC [19]. ... 21
Figure 12: The SEM images of LiFePO4 carbon coated electrode (a) before cycling, (b)
after 10 cycles, (c) after 30 cycles, and (d) after 60 cycles [23]. ... 22 Figure 13: (a) Average SOC (γ) from current collector to separator, and (b)
intercalation stresses at the surface of the particles across the electrode during
discharge [24]. ... 23 Figure 14: (a) Fe-ion dissolution from LiFePO4 olivine powders in different electrolytes
at 30 ºC, and (b) unstable behavior of a LiFePO4 olivine electrode in acidic electrolyte
Figure 17: General reactions at an electrode, an electrode surface region, and bulk solution [34]. ... 29 Figure 18: The Nyquist plots of carbon coated LiFePO4 after 5 charge–discharge cycles.
(a) 100%, (b) 50%, and (c) 0% SOC at 303 K [39]. ... 30 Figure 19: SEM images of (a) pristine cathodes, (b) pristine anodes, (c) cathodes after 15-day storage, and (d) anodes after 15-day storage [38]. ... 31 Figure 20: (a) XRD spectra in terms of SOC from starting material to 95% SOC, and (b) unit cell volumes and the normalized crystalline phase fraction of triphylite and heterosite [39]. ... 33 Figure 21: Illustration of the shrinking-core model with the juxtaposition of the two phases and the movement of the phase boundary [11]. ... 35 Figure 22. (a) Contour plots for lithium concentration according to the lithium
intercalation, and (b) anisotropic misfit between FePO4 and LiFePO4 along 3 directions
according to one-dimensional lithium diffusion along [010] [42]. ... 36 Figure 23: (a) Dimensionless concentration profile, (b) radial stress, and (c) tangential stress in terms of location in the spherical particle [45]. ... 39 Figure 24: Diffusion-induced stress fields in a particle using (a) the isotropic model, and (b) the anisotropic model [46]. ... 40 Figure 25: Effect of (a) porosity of anode, and (b) partcile size on the total stress along the thickness of the anode [24]. ... 41 Figure 26: Maximum and minimum stress in terms of C-rate (dashed: 5.5 µm, dotted: 55 µm, and solid: 165 µm electrodes) [47]. ... 42
Chapter 3
Figure 27: (a) Geometry, and (b) mesh of the model 1 composed of electrolyte and cathode domains. ... 47 Figure 28: Project schematic simulation in ANSYS including Fluid Flow (CFX),
x
Chapter 4
Figure 33: (a) Velocity vector of electrolyte across electrolyte and electrode domains, and (b) velocity profiles at 3 different locations in the half-cell system (red: inlet boundary, blue: middle of the electrolyte domain, and green: middle of the electrode). ... 59 Figure 34: Influences of varying C-rate on the normalized normal stress and shear stress (porosity of 0.25 and EC is used as an electrolyte). ... 60 Figure 35: Relationship between porosity and normalized normal stress (EC is used as an electrolyte). ... 61 Figure 36: The effect of electrolyte viscosity on normal and shear stresses at 1C
Figure 51: Effect of C-rate on normal stress at the position 1 during lithiation (volume fraction of 15.5% and EC is used as an electrolyte). ... 84 Figure 52: Relationship between the surface concentration and the dimensionless discharging time for the models with volume fraction of 15.5% and EC is used as an electrolyte. ... 85 Figure 53: Effect of C-rate on the normalized strain energy during lithiation (volume fraction of 15.5% and EC is used as an electrolyte). ... 86 Figure 54: Contour plots of normal stress for the model with volume fraction of (a) 3.3%, and (b) 26.8% particle at 50% lithiation in 1C (EC is used as an electrolyte). .... 87 Figure 55: Effect of volume fraction on normal stress in (a) 1C, (b) 6C, and (c)
1
CHAPTER 1: INTRODUCTION
1.1 Lithium-Ion Battery
Since carbon dioxide from petroleum-derived fuels has become an environmental issue, the need for alternative energy sources and the replacement of the internal combustion engine increases. The use of lithium-ion batteries is one of the most promising power source. Lithium-ion batteries have been used for a wide range of applications such as portable electronics, power tools, and transportation [1]. Especially, the lithium-ion batteries show good potential for the application on hybrid electric vehicles (HEVs),plug-in hybrid electric vehicles (PHEVs), and electric vehicles (EVs). The main reasons why lithium-ion batteries are now the prevailing rechargeable battery system are due to their low cost, low toxicity, high thermal stability, high electrochemical performance, and high specific capacity compared to commonly used batteries such as Ni–Cd and Ni–MH portable batteries [2].
Gravimetric and volumetric energy densities, which are important properties for cathode materials, determine the energy release rate and energy storage capacity per unit weight or volume. Since a lighter battery with the same energy capacity is easier to carry around, the gravimetric energy density is especially important for portable devices.
3 Figure 2 below portrays how lithium-ion batteries work. The lithium-ion battery cell is made up of five essential components; a positive and a negative electrode, electrolyte, a separator, and current collectors. During the charge and discharge process, lithium ions are shuttled between an anode and a cathode through electrolyte. When lithium ions reached the cathode surface, lithium ion insertion (intercalation) occurs, and it causes diffusion-induced stress (DIS). Graphite is commonly used as an anode, whereas various materials such as LiCoO2, LiMn2O4, LiNiO2, and LiFePO4 are used as a cathode. Moreover, organic-carbonate solvents such as ethylene carbonate (EC) and dimethyl carbonate (DMC) with a lithium salt dissolved are commonly used as an electrolyte.
1.2 Promising LiFePO4 Electrode
In 1997, Padhi et al. [4] proposed LiFePO4 as a cathode material, which shows a higher capacity (170 mAh/g) as high as LiCoO2. It also exhibits high volumetric energy (970 WhL-1), and volumetric power (1236 WL-1) compared to the four mainstream cathode materials as shown in Figure 3 [1]. Since LiFePO4 is made from non-toxic materials and the abundant transition metal (160 billion tons in the Earth), it is an environmental-friendly and cheaper material (Table 1).
Moreover, one of the prominent problems of lithium-ion batteries is safety, attributed primarily to the material’s thermal stability [5]. In 2013, the United States Federal Aviation Administration (FAA) ordered a review into Boeing 787 Dreamliner due to the battery overheating problems. The lithium-ion batteries of Boeing 787 have used LiCoO2 as a cathode material. Table 1 shows that LiFePO4 exhibits the lowest exothermic peak
5
Figure 3: Comparison of various cathode materials; LiCoO2, LiMn2O4, LiNiO2, and
LiFePO4 [1].
1.3 Research at National Laboratory
Interesting research on lithium-ion batteries have been conducted by several national laboratories and universities. In this section, a few studies conducted by U.S. national laboratories, such as Sandia National Laboratory and Brookhaven National Laboratory, are introduced.
1.3.1 Sandia National Laboratory
For better performance in lithium-ion batteries in electric vehicles, medical
equipment, and aircrafts, Sandia National Lab has been conducting research using LiFePO4 as a cathode material in lithium-ion batteries. Chueh et al. [6] studied the particle-by-particle pathway of lithium intercalation, which is the ability of a molecule to be inserted and
extracted from two other molecules.
7
Figure 4: SOC mapping obtained via scanning transmission X-ray microscopy (a) 26µm, (b) 18µm, and (c) 6µm from the current collector [6].
Figure 5 demonstrates the particle-size distributions of all the single-phase particles. The two vertical lines (i.e., a red and a green line) in the Figure 5a indicate the average particle size of lithium-rich particles and lithium-poor particles. It has been observed that the average
particle size is 256 nm for lithium-rich LiFePO4 particles and 294 nm for lithium-poor LiFePO4 particles. Even though there is a difference of average particles size between
lithium-rich and lithium-poor LiFePO4, Figure 5b displays the fraction of delithiated particles (in color green) and lithiated particles (in color red) plotted as a function of percentile of particle size. That is, lithiation state depends weakly on the particle size. It suggest that increases in particle size does not influence the fraction of delithiation. This result is contrary to the common expectation that smaller particles would delithiate before larger ones.
9
1.3.2 Brookhaven National Laboratory
At the Brookhaven National Laboratory, Wang et al. [7] have used X-ray microscopy to track the phase transformation process at nano-scale resolution during charging and discharging. They focused on the reasons why charging under high C-rate constrains LiFePO4 battery performance. Figure 6 compares phase transformation mechanism and intercalation pathway at fast and slow charging rates for a multi-particle LiFePO4 system. It suggests that in a multiple LiFePO4 particle system, phase transformation occurs
concurrently at slow C-rate, whereas it proceeds inhomogeneously at faster C-rate [7]. Even at the end of discharging, an incomplete phase transformation marked in red is still detected at faster C-rate (i.e., 5C). To improve the ionic and electron conductivity, they tried to relieve inhomogeneity of phase distribution by using low active material loading and liquid
11
1.4 Current State-of-Art and Limitation
Currently, lithium-ion batteries have become commercially available. Due to their high gravimetric energy density, lithium-ion batteries have become the choices of the energy storage systems for laptops, cell phones, and many other portable applications. For example, Samsung SDI continues to develop lithium-ion batteries for portable electronic devices. One of latest batteries, called ICR18650-32A, has 3200mAh current capacity and 12Wh energy capacity [8]. It has the highest capacity among the cylindrical-type lithium-ion batteries and it provides increased hours of laptop usage.
Moreover, lithium-ion batteries are commonly used in HEV, PHEV, and EV because of their high volumetric energy density. BMW has released a PHEV in 2015, called BMW i8. It has a 7.1 kWh pack, which suggests that BMW i8 can operate 37 km (23 miles) without gas [9]. Since BMW i8 have an additional internal combustion engine, the battery pack can be charged during driving with gas. TESLA has developed a high profile EV, which has received a lot of attention. It is reported that the 85 kWh lithium-ion battery in model S (85D) has an ability to deliver 230 miles (370 km) [10].
Even though lithium-ion batteries have been commercially used in industry due to their many advantages, they have some obstacles and limitations. First of all, LiFePO4 has relatively low electronic conductivity and lithium ion diffusivity comparing to other
commonly used cathodes such as LiMn2O4 or LiCoO2 (Table 2). Low electronic conductivity and lithium ion diffusivity of LiFePO4 results in considerable ohmic drops within the
better acceleration for EV, LiFePO4 limited high-rate capability, with considerable loss in utilization with a high C-rate [11]. Moreover, capacity loss is very significant with the longer period of charge and discharge cycles or storage [13]. Thirdly, an irreversible charge loss occurs on the solid-electrolyte interphase (SEI) is observed [14]. It is noted that the SEI plays negative roles on the battery performance via irreversible charge losses, and it harms the battery safety by forming an additional layer on the electrode surface.
Table 2: Lithium ion diffusivity and electronic conductivity of cathode materials [15].
Lithium Ion Diffusivity [cm2·s-1] Electronic Conductivity [S ·cm-1]
LiCoO2 10-10 ~ 10-8 10-4
LiMn2O4 10-11 ~ 10-9 10-6
13
1.5 Objectives of this Study
It has been observed that the capacity fade with a high C-rate or with a long period of cycling is strongly related to the mechanical stresses inside lithium-ion batteries [12].
Moreover, it has been experimentally observed that stresses due to intercalation and phase transformation can cause local fractures in the active materials of lithium-ion batteries [16]. Yet our basic knowledge of how electrode material mechanical stress states contribute to the battery performance and stability is currently extremely limited, hindering materials
innovation and the ability to use lithium-ion battery as an energy storage system.
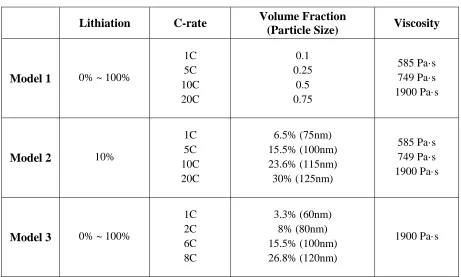
Table 3: Summary of simulations to present
Lithiation C-rate Volume Fraction
(Particle Size) Viscosity
Model 1 0% ~ 100%
1C 5C 10C 20C 0.1 0.25 0.5 0.75 585 Pa·s 749 Pa·s 1900 Pa·s
Model 2 10%
1C 5C 10C 20C 6.5% (75nm) 15.5% (100nm) 23.6% (115nm) 30% (125nm) 585 Pa·s 749 Pa·s 1900 Pa·s
Model 3 0% ~ 100%
15
CHAPTER 2: LITERATURE REVIEW
2.1 LiFePO4 as a Cathode material
Figure 7: Comparison of the discharge capacity of various LiFePO4 electrodes at 25 °C
[17].
17
Figure 8: Simulation snapshots of 50% SOC electrodes discharged at different C-rates [20].
Strobridge et al. [21] have measured a fraction of nano-scale LiFePO4 electrode to investigate inhomogeneous reaction by using X-ray diffraction (XRD). They have reported that the fraction of LiFePO4 decreases along with the diffusion direction (y-direction) at both the first and the second cycle (Figure 9b, d) because of lithium diffusion limited-kinetics in the electrolyte across the cathode. Moreover, it has been observed that the fraction of LiFePO4 decreases more drastically at the second cycle especially between 15µm and
line in Figure 9d). To understand the reduced battery performance due to the inhomogeneous reaction, a simulation have been performed to examine the hypothesis that the decrease in electronic conductivity at the second cycle affects the inhomogeneity across the electrode. With the same geometry and parameters in the simulations, Strobridge et al. [21] varied the electronic conductivity to observe the change of the battery performance. Their result suggests that an expansion and a contraction of particles during cycling have caused a decrease in electronic conductivity of LiFePO4, which negatively affects the battery performance.
Figure 10: Discharge capacity versus cycle number for various LiFePO4 electrodes in
0.2 C-rate [18].
Dupré et al. [19] have utilized 7Li magic angle spinning nuclear magnetic resonance (MAS NMR) spectroscopy, electrochemical impedance spectroscopy (EIS), and X-ray photoelectron spectroscopy (XPS) to study the influence of carbon coating of LiFePO4 during storage at the room temperature. Through normalized 7Li MAS NMR spectra, the reactions of the interphase are evaluated after aging (Figure 11). After one month of contact with electrolyte, the detected NMR signal for the carbon-free LiFePO4 has increased
21
Figure 11: Normalized 7Li MAS NMR spectra of (a) carbon coated LiFePO4, and (b)
Another important issue regarding the battery degradation is that cracks are observed in LiFePO4 after cycling. Wang et al. [23] have investigated cracks on the LiFePO4 particles using XRD and SEM. Small flaws were observed in some particles after 10 cycles (Figure 12b). Figure 12c demonstrates that the crack becomes more obviously after 30 cycles. They believe that the cracks, which related to the performance degradation, may be caused by high internal strain energy during lithium intercalation. Thus, the importance of investigating mechanical stresses and strain energy in electrode particles during charging and discharging becomes more significant.
Figure 12: The SEM images of LiFePO4 carbon coated electrode (a) before cycling, (b)
23 Reganathan et al. [24] have published a mathematical model to develop a correlation between the mechanical properties and the performance of the porous battery electrodes. In their study, γ is expressed as the ratio of average concentration of lithium in the particle and τ is defined to present normalized SOC:
𝛾 = 𝐶1,𝑖
𝐶𝑙,𝑖𝑚𝑎𝑥, 𝑖 = 𝑝 (1) τ = [∫ 𝛾𝑖𝑜 ]
𝑚/[∫ 𝛾
𝑚𝑎𝑥
𝑜
𝑖 ]𝐶/33, 𝑖 = 𝑝, 𝑚 =given rate of discharge (2)
As shown in Figure 13a, the ratio of average concentration of the particles (i.e., γ) across the thickness of the cathode could be realized in terms of normalized SOC (i.e., τ). It has been reported that once the concentration on the surface is saturated when τ is 80%, phase
transformation initiates near the separator causing a drastic increase in average concentration γ near the separator above 80% (Figure 13a). Because of the phase transformation, the magnitude of the stress across the electrode increases until τ = 80% (single phase) (Figure 13b), and the stress starts to decrease in this point (not shown in figure).
2.2 Electrolyte
The electrolyte plays an important role in the performance of lithium-ion batteries. Generally, battery electrolytes are optimized for maximizing conductivity and
electrochemical stability [25], [26]. Table 4 lists candidates for organic carbonate electrolyte for lithium-ion batteries.
Table 4: A candidate of organic electrolyte for lithium-ion batteries
Electrolyte Melting point [oC]
Boiling point [oC]
Dipole moment [10-30 Cm]
Viscosity [mPa·s]
Propylene Carbonate (PC) -54.5 a 241.7 a 16.5 a 2.4711 b
Ethylene Carbonate (EC) 36.4 a 238 a 4.87 a 1.900 a
Diethyl Carbonate (DEC) -43.0 a 126.8 a 3.15 a 0.749 c
Dimethyl Carbonate (DMC) 4 a 90 a 2.95 a 0.585 c
aNazri and Pistia [26], bMuhuri and Hazra [27], and cRodríguez et al. [28]
25 is commonly used for lithium-ion batteries [25]. Moreover, doubling the concentration of lithium ion in the electrolyte can increase the capacity up to 15% [31]. Therefore, studying transport of lithium ion in the electrolyte is of importance.
Figure 14: (a) Fe-ion dissolution from LiFePO4 olivine powders in different electrolytes
at 30 ºC, and (b) unstable behavior of a LiFePO4 olivine electrode in acidic electrolyte
[29].
Generally, tortuosity refers to the ratio of the diffusivity in the free space to the diffusivity in the porous medium. Figure 15 displays the simulated porous electrode
27
Figure 15: (a) Simulated porous electrode microstructure, and (b) resultant stream lines highlight the tortuous path [33].
Using in-situ energy-dispersive X-ray diffraction, Strobridge et al. [21] have analyzed the average lithium content gradient across the electrode with three different particle size distributions, to study the magnitude of the inhomogeneity, the porosity, and C-rate effects. Figure 16a shows that when the porosity increases to 35% (i.e., relatively low volume fraction), the lithium concentration gradient decreases, which can be related to a higher effective diffusivity of the ions in the electrolyte. Figure 16b suggests that the lithium concentration gradients increase with C-rate. It also suggested that the lithium ion diffusion in the electrolyte becomes more limiting at higher C-rate [21].
29
2.3 Solid-Electrolyte Interphase (SEI)
Figure 17 demonstrates overall electrode reactions characterized by a reduction-oxidation mechanism including mass transfer, and chemical reactions [34]. Although an electrode region and a bulk solution region were commonly studied in many papers [20][23][35][36], it is now realized that more research about electrode surface region is needed. Especially, among electrode surface regions, solid-electrolyte interphase (SEI) growth at an interface between the negative electrode and the electrolyte is one of the most focused research areas [37]. Furthermore, it has been reported that lithium ions must also travel through an additional layer between the cathode and the electrolyte, which is similar with the SEI observed on an anode [38][39].
Figure 17: General reactions at an electrode, an electrode surface region, and bulk solution [34].
Reduction (Cathode)
The experimental results from Ju et al. [39] suggest the charge exchange process should take place at the interface between LiFePO4 and the electrolyte for pure phase LiFePO4 electrode. From the Nyquist plot in Figure 18, after cycling for 5 times, the SEI is formed on the cathode surface. The migration process of lithium ions through the SEI layer leads to the manifestation of the additional semicircle in the Nyquist plots. Strobridge et al. [21] used XRD to map the evolution of the inhomogeneous electrochemical reaction in electrodes. Their results also show that the poorer electronic wiring could result from both the expansion and the contraction of the particles during cycling and the formation of a SEI layer [21].
Figure 18: The Nyquist plots of carbon coated LiFePO4 after 5 charge–discharge cycles.
31 Zhong et al. [40] have used an electrochemical method to investigate SEI film on the surface of the both electrode. Figure 19 below portrays SEM images of electrodes. After 15-day storage, the surfaces of both cathode and anode become coarse (Figure 19c and d) caused by the formation of SEI films. Generally, SEI films deteriorate surface structures of the electrodes. The SEI formation was also confirmed by an increasing internal resistance from 13.8 mΩ to 14.7 mΩ after 15-day storage. The internal resistance is caused by the SEI formation since the other resistances including lithium ion diffusion resistance in the
electrolyte, charge transfer resistance, and Ohm contact resistance are typically the same for each electrode due to the same battery materials used and in the battery assembly
technologies adopted [40].
2.4 Phase Transformation across Electrode
Investigating phase stability and phase transformation of electrodes is very important to the battery performance. As current is transferred from the anode to the cathode, an electrochemical reaction occurs inside the particle and it can be represented as below equation 3.
𝐿𝑖𝑥𝐹𝑒𝑃𝑂4
𝑐ℎ𝑎𝑟𝑔𝑖𝑛𝑔 →
𝑑𝑖𝑠𝑐ℎ𝑎𝑟𝑔𝑖𝑛𝑔
← 𝐹𝑒𝑃𝑂4+ 𝑥𝐿𝑖
++ 𝑥𝑒− (0 ≤ 𝑥 ≤ 1), (3)
where x represents lithium concentration in the particles.
33
The shrinking-core model for a single particle of LiFePO4 has been developed to investigate phase transformation (Figure 21). During discharging, an electrochemical reactions initiates when lithium ions and electrons reach the surface of a single phase particles (LiyFePO4). The phase transformation proceeds from Li1-xFePO4 (lithium-rich phase) to LiyFePO4 (lithium-poor phase) due to the electrochemical reactions. As lithium ions continuously traverse from the surface toward the core of particles, lithiation reaction occurs simultaneously. Finally, whole particle is composed of a single phase particles (Li1-xFePO4) [11].
Neglecting any migration effects, and assuming a concentration-independent diffusion coefficient the governing equation for this process can be written in spherical coordinates as follows:
𝜕𝑐𝑠 𝜕𝑡 = 𝐷𝐿𝑖
𝜕2𝑐𝑠 𝜕𝑟2 +
2𝐷𝐿𝑖 𝑟
𝜕𝑐𝑠
𝜕𝑟 (4)
Equation 4 is solved with the boundary conditions, 𝐷𝐿𝑖
𝜕𝑐𝑠
𝜕𝑟 = 0 𝑎𝑡 𝑟 = 0, (5) 𝑐𝑠 = 𝑐0 𝑎𝑡 𝑡 = 0, (6)
35
Figure 21: Illustration of the shrinking-core model with the juxtaposition of the two phases and the movement of the phase boundary [11].
Figure 22. (a) Contour plots for lithium concentration according to the lithium
intercalation, and (b) anisotropic misfit between FePO4 and LiFePO4 along 3 directions
37
2.5 Diffusion-Induced Stress
Lithium insertion and removal in lithium-ion battery electrodes can result in diffusion-induced stresses (DIS) upon phase transformation. Capacity fade and fracture of electrode, one of the most significant problems in electrode materials, can be associated with DIS [43][44]. Cheng et al. [45] adopted a thermal stress analysis approach to investigate DIS based on the similarity of the law of heat conduction (Fourier’s law) and Fick's laws of diffusion. The diffusion equation in the bulk of the insertion electrode is as follows:
∂Θ𝐼
∂t = 𝐷𝐼∇ 2Θ
𝐼, (7)
where 𝐷𝐼 is intercalate diffusion coefficient, Θ𝐼 is the local concentration.
The stress-strain relationships can be expressed in spherical coordinate system as following equation:
𝜀𝑟= 1
𝐸(𝜎𝑟− 2𝜈𝜎𝜃) +
1
3Ω𝑐Θ𝐼, (8)
𝜀𝜃 =
1
𝐸[(1 − 𝜈)𝜎𝜃− 𝜈𝜎𝑟] +
1
3Ω𝑐Θ𝐼, (9)
where E is Young’s modulus, 𝜈 is Poisson’s ratio, Ω is the partial molar volume of the solute, and c is the concentration of sites available for lithium insertion. The solutions for the normal and tangential stresses are expressed as following equation:
𝜎𝑟(𝑟) = 2𝐸Ω𝑐
9(1−𝜈)[Θ𝐼
𝑎𝑣(𝑅) − Θ
𝐼
𝑎𝑣(𝑟)], (10)
𝜎𝜃(𝑟) = 𝐸Ω𝑐
9(1−𝜈)[2Θ𝐼
𝑎𝑣(𝑅) + Θ
𝐼
𝑎𝑣(𝑟) − 3Θ
𝐼(𝑟)], (11)
where Θ𝐼𝑎𝑣(𝑟) ≡ (3/𝑟3) ∫ 𝑟2Θ
𝐼(𝑟)𝑑𝑟
𝑟
0 is the average concentration in the spherical volume
From the results presented in the Figure 23a below, it can be seen that when the dimensional time (𝜏) increases, lithium ions move from the surface (r/R=1) towards the center of the particle (r/R=0). When dimensionless time 𝜏 = 0.4, dimensionless concentration (Θ𝐼(𝑟,𝑡)−Θ0
Θ𝑅−Θ0 )
39
Malavé et al. [46] have investigated mechanical behaviors within LixCoO2 cathode
particles via isotropic and anisotropic computational models. Figure 24 compares DIS fields using isotropic and anisotropic models at t = 1820s (nearly 50% discharged) during 1C. In both cases, compressive stresses observed in the particle interior, while the stresses near the particle surfaces are tensile stresses [46]. The simulation results suggest that the anisotropic model predicts higher tensile stresses than the isotropic model. Especially, higher tensile stresses, which are likely to cause crack initiation and fracture, are observed at the concaved area indicated by arrow. These results suggest that DIS is largely related to analysis models and surface shapes of particles.
41 Renganathan et al. [24] have developed a mathematical model to simulate the
generation of DIS during the discharge process. They have reported that the intercalation process, related to the elastic deformation of the material, must be considered to quantify the stress generated in the electrode. To simulate the intercalation process, they also used the approach similar to that used to account for thermally induced stresses in a material. The effect of porosity and the particle size in the anode on DIS have been analyzed (Figure 25). It has been observed that the stresses increase with a decrease in the porosity and an increase in the particle size of negative electrode.
A lithium ion cell-sandwich mathematical model with porous electrodes has been proposed by Christensen [47] to investigate DIS. It is observed that peak tensile stresses occur at the center of particles and peak compressive stresses occur at the surface of the particles. Figure 26 below represents that higher C-rate and larger particles result in a higher DIS. Besides, it could be observed that extensive fracturing of the cathode occurs exclusively in the region closest to the separator [47].
43
CHAPTER 3: MODEL DEVELOPMENT
Several published studies have focused on the topic of the effect of mechanical stress in lithium-ion batteries [24][46][45][47][48]. However, these studies emphasized only one component of the battery cells (i.e., only cathode, anode or electrolyte). To better understand electrochemical and mechanical relations in lithium-ion batteries, factors such as
(dis)charging current rate (C-rate), the volume fraction of the electrode, the viscosity of the electrolyte, and the phase transformation of the electrode materials, ought to be considered as a whole. Three distinct multiphysics finite element models of half-cell systems (i.e., with electrolyte and cathode materials) are developed in ANSYS Multiphysics (ANSYS, Inc., Canonsburg, Pennsylvania, USA).
Model 1 sets up a foundation for studying stresses on the interface between the electrolyte and the electrode. The advantage of this model is that we could investigate variations of mechanical stresses in lithium-ion batteries by different combinations of the porosity, C-rate, and electrolyte viscosity. Moreover, due to the simple geometry of the model, it allows us to evaluate resulting mechanical stresses on the interface between the electrode and the electrolyte quickly. Based on the results, a determinant factor contributing to the stress-induced degradation of the battery could be derived. However, this model is oversimplified by considering the electrode as a continuum media.
C-rate, the volume fraction, and electrolyte viscosity are deduced. Based on the results of the second model, we have a better understanding of the electrochemistry-induced mechanical stresses in porous electrodes.
To further capture phase transformation induced by lithium ion diffusion in electrode materials, a third multiphysics finite element model is developed. In this model, shrinking-core model developed by Shrinvasan and Newman [11] is extended by considering several particles and electrolyte. Specifically, changes of the materials properties of the electrode (from lithium-poor phase to lithium-rich phase) are coupled with the lithiation stage during discharging. Stresses at electrode-electrolyte interface in lithium-ion batteries are
45
Table 5: Material properties for cathode and electrolyte
Parameter Symbol Value Reference
Ethylene Carbonate
(EC)
Density ρ 1.321 g·cm-3
[26]
Molar Mass M 88.06 g/mol
Viscosity η 1900 Pa·s
Dimethyl Carbonate
(DMC)
Density ρ 1.0635 g·cm-3
[28]
Molar Mass M 90.08 g/mol
Viscosity η 585 Pa·s
Diethyl Carbonate
(DEC)
Density ρ 0.9691 g·cm-3
Molar Mass M 118.13 g/mol
Viscosity η 749 Pa·s
47
3.1 The Impact of the Porosity of Electrode-Electrolyte Interface
Figure 27a demonstrates the geometry of the model 1 used in the simulations. In order to model the interface between the electrolyte and the cathode, two 0.3μm × 0.3μm ×
0.3μm domains are adopted: one of them is for electrolyte and the other one is for the
cathode. The domain size is designed to be resembled 300nm thick LiFePO4 films developed by Sauvage et al. [51]. Thus, the long edge of the simulation domain is set to L=0.6μm. The surface marked in green indicates the electrode-electrolyte interface. Particularly, Fluid-Porous Interface was used in this Fluid Flow module (CFX), in which the cathode material is considered as a continuum media with various porous ratios to simulate the solid domain as a porous electrode. Figure 27b portrays the mesh of the finite element model. The element model contains 1024 elements with the 8-nodes hexahedral (H8) element type. Moreover, the simulations are conducted in a steady-state and ionic flux is not considered as it is our first step to understand the impact of the porosity of electrode-electrolyte interface.
Figure 28 below shows how the simulations based on the model 1 work in ANSYS. At first, the streamline of the electrolyte, where the lithium ions traverse, is calculated using the Fluid Flow module (CFX). Momentum loss of electrolyte occurs when electrolyte meets the surface of the electrode, and it causes mechanical stresses on the surface of the cathode. The C-rate dependent lithiation stage is calculated using the Transient Thermal module. By combining the results from the Fluid Flow and Transient Thermal modules, the mechanical stresses are investigated on the interface between electrolyte and cathode via the Static Structural module.
Figure 28: Project schematic simulation in ANSYS including Fluid Flow (CFX), Transient Thermal, and Static Structural modules.
In this simulation, the phase transformation from FePO4 to LiFePO4 during
discharging is considered and the material properties of the electrode changes based on the following equation:
[𝐶(𝑥)] = 𝑥[𝐶]𝐿𝑖𝐹𝑒𝑃𝑂4+ (1 − 𝑥)[𝐶]𝐹𝑒𝑃𝑂4, (12)
49 is anisotropic material property stiffness matrix of FePO4, and x represents lithiation from the lithium-poor phase to the lithium-rich phase (0 ≤ 𝑥 ≤ 1).
Equation 13 below indicates generalized Butler-Volmer kinetics usually describing the lithium insertion rate:
𝐽 = 𝑘0
𝛼𝐿𝑖,𝑦𝑡𝑒1−𝛼 𝛼𝐿𝑖,𝑠𝛼
𝛾𝑇𝑆 [exp (−
𝛼𝑒𝜂
𝑘𝐵) − exp (
(1−𝛼)𝑒𝜂
𝑘𝐵𝑇 )], (13)
where 𝐽 is the lithium insertion rate, k0 is the rate constant, αLi,yte and αLi,s are the respective activities of lithium in the electrolyte and in solid particles, e is the elementary charge, η is the reaction over-potential at the LiFePO4/carbon/electrolyte triple-phase boundary, and 𝛾𝑇𝑆 is the activity coefficient of the transition state [52]. The 1C model has 𝐽1𝐶 = 0.19 A ∙ 𝑚−2,
the 5C model has 𝐽5𝐶 = 0.25 A ∙ 𝑚−2, the 10C model is with 𝐽10𝐶 = 0.31 A ∙ 𝑚−2, and the 20C model has 𝐽20𝐶 = 0.59 A ∙ 𝑚−2 obtained from Li et al. [20]. To fulfill above insertion
rate (𝐽), the current density (𝐼) at the inlet boundary was calculated by equation 14 since the current density can be expressed in terms of the velocities of the ions [36].
𝐼
𝐹= 𝑐(𝐿𝑖+)𝑣(𝐿𝑖+)− 𝑐(𝑃𝐹6−)𝑣(𝑃𝐹6−), (14)
where 𝐼 is the current density, 𝐹 is Faraday’s constant, 𝑐𝐿𝑖+, 𝑐𝑃𝐹
6−, 𝑣𝐿𝑖+ , and 𝑣𝑃𝐹6−indicates
concentration of lithium ion and hexafluorophosphate ion, and velocity of lithium ion and hexafluorophosphate ion, respectively. To simplify the simulations, the concentration and the velocity of hexafluorophosphate ions are disregarded and we assumed that concentration of lithium ion are constant across the electrolyte.
To investigate the C-rate effects in our finite element models, we also assume that the velocity of lithium ions calculated above is used as an inlet velocity of the electrolyte.
51
3.2 The Impact of Porous Electrodes in a Lithium Ion Half- Cell
The model presented in the previous section does not consider particle size, shape, and molar volume misfit, therefore, the second multiphysics model is developed: a porous medium with various spherical particle sizes in cathode materials. As shown in Figure 29a, model 2 consists of a 0.3μm × 0.3μm × 0.6μm rectangular domain for the electrolyte and several spherical particles as electrode materials. Moreover, symmetry boundary conditions and fluid-solid interface boundary conditions are adopted in the second model. Figure 29b displays the mesh of the finite element model. The element model contains 57456 elements with the 10-nodes tetrahedral (T10) element type.
Figure 29: (a) Geometry, and (b) mesh of the model 2 composed of electrolyte and cathode domains.
particles, the resistant occurs on the electrode-electrolyte surface. The similar assumption in the model 1 that momentum loss of electrolyte causes pressure on the surface of cathode is also used. To determine inlet boundary conditions, the lithium ions’ transversal diffusion distance at a given time is estimated by the equation 15 [54]:
𝛿𝑖(𝑡) = √𝐷𝑖𝑡 , (15)
where 𝐷𝑖 is the diffusion coefficient of the electrolyte and 𝛿𝑖 is the estimated diffusion
distance of lithium ion at a given time. Based on the estimated diffusion distance, the velocity of the electrolyte is calculated by dividing the diffusion length by the different discharging time due to different C-rates (i.e., 1C requires 3600s to reach a fully discharging, 5C requires 720s to reach a fully discharging). In this porous electrode half-cell model the diffusion coefficient of electrolyte is assumed to be a constant across the half-cell system, and with 𝐷𝑒𝑙𝑒𝑐𝑡𝑟𝑜𝑙𝑦𝑡𝑒 = 1 × 10⁻¹⁰𝑚2𝑠−1 [55]. Details on how to calculate lithiation are
discussed in the Section 4.1.4.
Figure 30 below demonstrates the multiphysics mechanism for stress analysis in the second model. To calculate the electrolyte flow around spherical particles, Fluid Flow module is used. Electrolyte flow produces fluid pressure on the interface between spherical particles and the electrolyte (i.e., solid-fluid interactions). As a result, pressured-induced mechanical stresses are generated in the half-cell system, which is then captured in the Static Structural module as the second step. In this step, spherical particles are modeled as
53
3.3 The Impact of Phase Transformation in Porous Electrodes
Although reasonable results are obtained from the porous model (model 2) developed in the previous section, where the viscosity of the electrolyte and multiple interfaces are included, however, the C-rate dependent molar volume misfits, lithiation, and associated the phase transformation of the particle during discharging are not incorporated. Therefore, a third model is developed to address these factors. The geometry used in the model 3 is the same as the model 2, as shown in Figure 31. Specifically, changes of the material property of the electrode (from lithium-poor phase to lithium-rich phase) are coupled with the C-rate dependent lithiation stage during discharging in model 3.
Figure 31: (a) Geometry, and (b) mesh of the model 3 composed of electrolyte and cathode domains.
55 experimental observations [56]. Thus, the importance of lithium-ion intercalation is further emphasized in the third model. The stress is calculated by following equation:
[σ] = [𝐶]([ε] − 3α∇Φ), (16) where α is a volume expansion coefficient, ∇Φ is the concentration gradients of lithium ion, and [C] is the phase transformation dependent anisotropic material property matrix.
The driving force (flux) of the lithium ions movement is modeled by the heat flux. Since heat flux (flux of lithium ions) is an inlet boundary condition, heat energy (lithium-ion chemical potential) transfers through this domain. Lithiation can be simulated based on similarities between the heat equation (equation 17) and Fick’s second law of diffusion (equation 18).
𝜕𝑇
𝜕𝑡 = −𝛼𝑇∆𝑇, (17) 𝜕𝐶
𝜕𝑡 = −𝐷∆𝐶, (18)
where T is the temperature, αT is a thermal diffusivity, C is the concentration of lithium ion, and D is the diffusion coefficient of lithium ion. In this simulation, the concept of heat
transfer and temperature is used for simulating the diffusion and concentration of lithium ion. Thus, the limitation of the model is that the real effects due to the temperature and heat on lithium-ion batteries have to be disregarded.
In order to represent various C-rates, different mass fluxes (𝐽) are determined to ensure enough time for lithium ion intercalation and diffusion in both electrolyte and cathode, where the 1C model has 𝐽1𝐶 = 0.125𝑊𝑚−2, the 2C model has 𝐽
2𝐶 = 0.25𝑊𝑚−2,
the 6C model has 𝐽6𝐶 = 0.75𝑊𝑚−2, and the 8C model has 𝐽8𝐶 = 1𝑊𝑚−2. In addition, a
10−10𝑚2𝑠−1[55] , and 𝐷
𝐿𝑖𝐹𝑒𝑃𝑂4 = 𝐷𝐹𝑒𝑃𝑂4 = 1 × 10⁻¹⁵𝑚2𝑠−1 [57]. Detail on how to
calculate lithiation is discussed in the Section 4.3.1.
57
CHAPTER 4: SIMULATION RESULTS AND DISCUSSION
Sections below details the simulation results that were carried out by ANSYS Multiphysics. The results from the current study provide a better understanding of the mechanical stresses on the electrode-electrolyte interface of a lithium-ion half-cell system. Several parameters such as C-rate, volume fraction (porosity), viscosity, and phase
transformation are considered in this study. Since it has been reported that tensile or compressive stresses are highly correlated to fractures in cathode particles [16] and highest stress is observed on the surface of electrode particles [46], we focus on normal stress on the surface of the electrode in our study.
4.1 Stress Analysis of the Porosity of Electrode-Electrolyte Interface
59
Figure 33: (a) Velocity vector of electrolyte across electrolyte and electrode domains, and (b) velocity profiles at 3 different locations in the half-cell system (red: inlet boundary, blue: middle of the electrolyte domain, and green: middle of the electrode).
4.1.1 Effect of C-rate
Figure 34: Influences of varying C-rate on the normalized normal stress and shear stress (porosity of 0.25 and EC is used as an electrolyte).
4.1.2 Effect of Porosity
In the model 1, the porosity is calculated according to equation 19 below.
∅ =𝑉𝑉
𝑉𝑇, (19)
where 𝑉𝑉 is the volume of the void-space, and 𝑉𝑇 is the bulk volume of the material. Various porosities, 0.1, 0.25, 0.5, and 0.75, are considered and the resulting maximum stresses on the interface are analyzed. The plot in Figure 35 below represents that the normal stress
61 electrode needs to move faster to reach a fully discharging, and as a result, a larger normal stress is generated. This result is consistent with the theoretical analysis by Renganathan et al. [24]. We also conduct another simulation with a larger domain size (10μm) (not shown in this thesis), and a similar result about the effect of the porosity of the electrode to the stresses is also observed.
4.1.3 Effect of Viscosity
Figure 36 demonstrates that normal and shear stresses increase with the increasing viscosity of electrolyte, suggesting that viscous force generated from the electrolyte has great influence. Moreover, the normal stress is affected by the electrolyte viscosity to a greater degree than the shear stress. The electrolyte Ethylene Carbonate has 3.25 times higher viscosity than Dimethyl Carbonate, and our simulation results show that the normal stress increase more than 3 times. It is confirmed that in spite of the higher conductivity properties in Ethylene Carbonate, the electrolyte with a higher viscosity plays a negative role in the battery performance due to the resulting higher mechanical stresses. It is also observed that the other properties of electrolyte, such as the molar mass and density, do not affect both normal and shear stresses that much.
63
4.1.4 Effect of Lithiation
LiFePO4 electrode undergoes a phase transformation during charging and
discharging. Upon lithium intercalation and diffusion in cathode, lithium-poor phase (FePO4) is transformed into lithium-rich phase (LiFePO4) [11]. In this study, effect of lithiation of the electrode is incorporated and the study from ChiuHuang [56] is employed. The contour plots in Figure 37 shows lithium concentration profiles when the cathode is lithiated 20% and 80%. In this model, the property change according to lithiation stage is considered instead of C-rat dependent lithiation stage. Therefore, maximum concentration (marked in red) is imposed on the surface of lithium-poor phase electrode (marked in blue) to make
concentration gradients. Concentration gradients is the driving force of lithium ion diffusion.
Figure 37: Concentration profile calculated by the transient thermal module in ANSYS. Each model represents lithiation of (a) 20%, and (b) 80%.
The lithiation of the electrode is calculated by the following equation:
𝐿𝑖𝑡ℎ𝑖𝑎𝑡𝑖𝑜𝑛 𝑠𝑡𝑎𝑔𝑒 = (∫ 𝐶𝑖
𝑙
0 𝑑𝑦)/(∫ 𝐶𝑠
𝑙
where 𝐶𝑠 is the concentration when the surface of the cathode is fully saturated (i.e., 𝐶𝑠 = 1)
and 𝐶𝑖 is the concentration at 𝑖 (0 ≤ 𝑖 ≤ 𝑙). 𝑙 is the total length of cathode (i.e., 0.3𝜇𝑚 ). In equation 20, ∫ 𝐶𝑖
𝑙
0 𝑑𝑦 indicates gray area whereas ∫ 𝐶𝑠 𝑙
0 𝑑𝑦 indicates sum of gray area and
yellow area in Figure 38. Since lithium ion diffusion occurs proportional to the surface of the electrode, lithium-ion concentration change is completely independent along the x and z directions. Using equation 20, lithiation is calculated based on the local concentration distribution (Figure 38).
Figure 38: Local concentration in terms of diffusion distance. Each concentration distribution shows lithiation of 20% (a) and 80% (b).
As shown in Figure 39, both normal and shear stresses decrease in non-linear fashion as lithium lithiation increases, suggesting phase transformation has a great effect on
65 are not included. Therefore, we reinvestigate effect of phase transformation and associated volume misfits in Section 4.3.2.
4.1.5 Conclusion
The highest stress has been observed on the surface of electrode particles [46] and normal stresses are highly associated with the fracture in the electrode [16], therefore we focus on studying maximum normal stress on the surface between electrolyte and electrode in the model 1.
First, the effect of C-rate was investigated in Figure 34. Both normal and shear stresses increase with an increasing C-rate by adjusting inlet boundary conditions in our simulations. In other words, higher stresses at the electrode-electrolyte interface caused by higher C-rate during discharging, suggesting damages strongly related to the mechanical stresses occur in the electrode. Our results provide qualitative and quantitative information on mechanical stresses and could be used to support the experimental observation that the reduced performance such as capacity loss is caused by high C-rate discharging.
Secondly, Figure 35 portrays the effect of electrode porosity. It indicates that mechanical stresses on the electrode-electrolyte interface decreases exponentially as the porosity of electrode increases. In the low porosity electrode, an increase in diffusion length results in higher stress. Similar trend was also concluded in LiCoO2 battery materials [24]. In the model with a larger domain size (10μm) (not shown in this thesis), similar result about the effect of the porosity of the electrode to the stresses is also observed.
67 of view. Furthermore, the results also suggest that the effects of molar mass and density of the electrolyte is less important than that of viscosity.
4.2 Multiphysics Models for Stress Analysis of Porous Electrodes
Several experiments have observed volume change (expansion and contraction) in LiFePO4 cathode materials during lithiation [50][58], and therefore volume change and the pressure induced by electrolyte are considered in this study. To incorporate volume change in this study, lithiation stages are considered 10%, where 10% lithium-rich phase and 90% lithium-poor phase are included in the computational models by using the material property in Table 5. Since LiFePO4 has relatively larger molar volume than that of FePO4 and two phases are constrained at a coherent interface, volume misfits are observed. As shown in Figure 41, this higher volume misfit could lead to a tensile stress marked in red. On the other hand, electrolyte pressure causes compressive stress is acting on some parts of the model 2, marked in blue (Figure 41).
Figure 40: Molar volume misfits when lithium-poor phase and lithium-rich phase exist.
69 Since maximum stress occurs on different locations in the model 2, we compare stresses at specific points: position 1, 2, and 3 (Figure 41). As expected, the stress at position 1 is much higher than stress at position 3.
Figure 41: Contour plots of stress and locations of position 1, 2, and 3 in (a) electrode domain and (b) a zoom-in top view of the electrode domain. Snapshots are taking from the 1C model with the volume fraction of 15.5%.
4.2.1 Effect of C-rate
Figure 42: Influences of C-rate on normalized normal and shear stresses at position 1 (volume fraction of 15.5% and EC is used as an electrolyte).
4.2.2 Effect of Volume Fraction
71
Figure 43: Streamline of model 2 in 1C with the volume fraction of (a) 6.5%, (b) 15.5%, and (c) 30%.
Figure 44: Contour plots of normal stress (y-axis) in 1C with volume fraction of (a) 6.5%, (b) 15.5%, and (c) 30% at the lithiation of 10%.
73 experimental results from Li et al. [20], suggesting more lithiation occurs near the electrode-electrolyte interface (i.e., more lithiation occurs at position 1 than that at position 3).
Therefore, the stress induced by fluid pressureat position 1 is higher than any other position due to more lithiation at position 1.
4.2.3 Effect of Viscosity
75
Figure 46: Effect of the viscosity of electrolyte on normalized normal stress at specific location in the 1C model at the lithiation of 10% (volume fraction of 15.5%).
4.2.4 Conclusion
In the model 2, molar volume misfits and fluid pressure are considered to investigate mechanical stresses on the interface. Since Model 2 has several interfaces between the electrolyte and the electrode, the stresses at three specific positions are compared rather than the maximum stress on the interface (Figure 41).
Furthermore, the effect of volume fraction on normal stress at each position is investigated (Figure 45). The volume fraction is determined by the size and number of particles because electrolyte domain size is fixed. Due to a larger contact area between the electrolyte and the electrode, the model with volume fraction of 30% has 1.66 times higher normal stress than 15.5% volume fraction model at position 1. It is also observed that stress induced by fluid pressure at position 1 is always higher than any other position in the electrode and it is due to more lithiation occurs at the position 1.
77
4.3 Phase Transformation Effect in Porous Electrodes via Multiphysics Modeling
Reasonable results are obtained from the previous models where the viscosity of the electrolyte and multiple interfaces are included, however, during the course of this thesis, several factors are also important to be included. Therefore, a third model is developed to address factors such as, the C-rate dependent volume change due to the molar volume misfits, lithiation and associated the phase transformation of the particle during discharging. Within the model 3, several simulations were carried out to better understand the influences of C-rate, volume fraction during lithiation and to reinvestigate mechanical stresses at the electrode-electrolyte interface.
4.3.1 Lithiation
To adopt the concept of lithiation, we used a thermal stress analysis approach, which has been widely discussed [44] [48] [56]. Specifically, shrinking-core model developed by Shrinvasan and Newman [11] is used and the thermal diffusivity mimics lithium ion diffusivity. In this study, mass flux of lithium ion (𝐽) is expressed as heat flux, and the temperature gradient represents lithium-ion concentration gradient. The concept depends on the similarities between lithium concertation distribution equation (equation 18) and
inlet boundary, the lithium concentration changes as diffusion occurs (i.e., lithiation proceeds). Figure 47 represents a cross-sectional view of whole model which demonstrates concentration distribution in the electrolyte and the cathode. The lithiation of particles shows lithiation of 0%, 15.8%, and 83%, respectively. In this study, it is assumed that conductivity of electrolyte and electrode are constant and the diffusion coefficient are 𝐷𝑒𝑙𝑒𝑐𝑡𝑟𝑜𝑙𝑦𝑡𝑒 = 1 × 10⁻¹⁰𝑚2𝑠−1 [55], and 𝐷
𝐿𝑖𝐹𝑒𝑃𝑂4 = 𝐷𝐹𝑒𝑃𝑂4 = 1 × 10⁻¹⁵𝑚2𝑠−1 [57], respectively. Thus, the
concentration of electrolyte changes more rapidly than that of the cathode. Even though lithium concentration of electrolyte indicates 100% concentration, only a surface of particles shows 100% concentration (i.e., fully saturated) and the lithiation of the electrode is
still in progress.
Figure 47: Concentration distribution at the lithiation of (a) 0%, (b) 15.8%, and (c) 83% in cathode in a 1C model (volume fraction of 15.5%).
In Figure 48a demonstrating a full contour plot at lithiation of 50%, high
79 in blue. Figure 48b portrays a 10-nodes tetrahedral (T10) type element, which is used in this simulations. Based on the data from each element, lithiation of electrode can be calculated by following equation:
𝐿𝑖𝑡ℎ𝑖𝑎𝑡𝑖𝑜𝑛 𝑠𝑡𝑎𝑔𝑒 = ∑ 𝑉𝑖 𝑖× (
∑𝑗=10𝑗=1 𝐶𝑗
10 ) 𝑉𝑇 ⁄
, (22) where 𝑖 is the number of elements 𝑗 is the number of nodes (10 nodes in each element), 𝑉𝑇 and 𝑉𝑖 indicates volume of particles for each element, and 𝐶𝑗 is concentration of lithium ion
at each nodes.
Figure 48: (a) Contour plot of lithiation at 50% lithiation in 1C (volume fraction of 15.5%), and (b) a 10-nodes tetrahedral type element.
Figure 49: Contour plot at lithiation stage of (a) 0%, (b) 5%, (c) 10%, (d) 20%, (e) 30%, (f) 50%, (g) 75%, and (h) 100% for 1C model with volume fraction of 15.5%.
4.3.2 Effect of C-rate
Figure 50 below displays contour plots of normal stress in the models with volume fraction of 30% in 1C and 6C, respectively. The stress field within the particles shows
Figure 51: Effect of C-rate on normal stress at the position 1 during lithiation (volume fraction of 15.5% and EC is used as an electrolyte).
85
Figure 52: Relationship between the surface concentration and the dimensionless discharging time for the models with volume fraction of 15.5% and EC is used as an electrolyte.
Figure 53: Effect of C-rate on the normalized strain energy during lithiation (volume fraction of 15.5% and EC is used as an electrolyte).
4.3.3 Effect of Volume Fraction
87 strongly affected by volume fraction of electrode. Based on intensive literature search and review, it is the first study reporting diffusion-induced stresses from the coupled effects of electrolyte and electrode.
Figure 55 demonstrates the impact of volume fraction on normal stress in 1C and 6C models. The results suggest that normal stress increases with the increasing volume fraction (i.e., particle size). This results match up with that of model 2. As the volume fraction
89
Figure 55: Effect of volume fraction on normal stress in (a) 1C, (b) 6C, and (c) combined results (EC is used as an electrolyte).
gradient increases with a decrease in porosity [21]. That is, when we consider the relationship between volume fraction and porosity (volume fraction + porosity = 100%), higher volume fraction causes increases in lithium concentration gradient, which is strongly related the capacity loss.
![Figure 1: Comparison of the different battery technologies in terms of gravimetric(x-axis), and volumetric(y-axis) energy density [2]](https://thumb-us.123doks.com/thumbv2/123dok_us/1725758.1220168/16.612.118.528.79.407/figure-comparison-different-battery-technologies-gravimetric-volumetric-density.webp)
![Figure 2: Working mechanism of lithium-ion batteries during discharging [3].](https://thumb-us.123doks.com/thumbv2/123dok_us/1725758.1220168/17.612.174.458.343.555/figure-working-mechanism-lithium-ion-batteries-discharging.webp)
![Table 1: Thermal stability characteristics and other factors in cost and environmental issues for battery materials [1]](https://thumb-us.123doks.com/thumbv2/123dok_us/1725758.1220168/19.612.145.490.73.347/table-thermal-stability-characteristics-factors-environmental-battery-materials.webp)
![Figure 4: SOC mapping obtained via scanning transmission X-ray microscopy (a) 26µm, (b) 18µm, and (c) 6µm from the current collector [6]](https://thumb-us.123doks.com/thumbv2/123dok_us/1725758.1220168/21.612.124.500.75.562/figure-mapping-obtained-scanning-transmission-microscopy-current-collector.webp)
![Figure 5: (a) The number of particles in terms of particle size, and (b) the fraction of delithiated particles plotted as a function of percentile of particle size (lithium-rich particles are in color red and lithium-poor particles are in color green) [6]](https://thumb-us.123doks.com/thumbv2/123dok_us/1725758.1220168/22.612.98.541.378.561/particles-particle-delithiated-particles-percentile-particle-particles-particles.webp)
![Figure 6: Schematic illustration for multi-particle LiFePO4 system [7].](https://thumb-us.123doks.com/thumbv2/123dok_us/1725758.1220168/24.612.116.503.74.333/figure-schematic-illustration-for-multi-particle-lifepo-system.webp)
![Figure 7: Comparison of the discharge capacity of various LiFePO4 electrodes at 25 °C [17]](https://thumb-us.123doks.com/thumbv2/123dok_us/1725758.1220168/30.612.141.488.75.304/figure-comparison-discharge-capacity-various-lifepo-electrodes-c.webp)
![Figure 8: Simulation snapshots of 50% SOC electrodes discharged at different C-rates [20]](https://thumb-us.123doks.com/thumbv2/123dok_us/1725758.1220168/31.612.103.530.74.387/figure-simulation-snapshots-soc-electrodes-discharged-different-rates.webp)